INFRASTRUCTURE FINANCING TRENDS IN AFRICA 2015 - ICA Report - 2015 www.icafrica.org - The ...
←
→
Page content transcription
If your browser does not render page correctly, please read the page content below
INFRASTRUCTURE FINANCING
   TRENDS IN AFRICA – 2015

ICA Report - 2015
www.icafrica.org
© 2016 The Infrastructure Consortium for Africa Secretariat c/o African Development Bank

                                01 BP 1387, Abidjan 01, Côte d'Ivoire

                                Disclaimer

                                This report was written by the ICA Secretariat in collaboration with a consultant. While care has
                                been taken to ensure the accuracy of the information provided in this report, the authors make no
                                representation, warranty or covenant with respect to its accuracy or validity.

                                No responsibility or liability will be accepted by the ICA Secretariat, its employees, associates and/or
www.icafrica.org                consultants for reliance placed upon information contained in this document by any third party.

2 | INFRASTRUCTURE FINANCING TRENDS IN AFRICA – 2015
Contents

Foreword                                                          4
About the ICA                                                     5
Definitions and Acronyms                                          6
List of Graphics and Maps                                         8
1. The Big Picture 2015                                           9
1.1 Key Messages and Findings                                    10
2. Financing Trends                                              12
2.1 Who is Financing Africa’s Infrastructure                     12
2.2 Financing Trends by Sector                                   14
2.3 Financing Trends by Region                                   16
3. General Trends                                                18
3.1 Climate Resilient Infrastructure                             18
3.2 Quality Infrastructure                                       20
3.3 Strategic Analysis                                           22
4. ICA Member Financing                                          24
4.1 Overview                                                     24
4.2 Types of Funding                                             26
4.3 Trends in Commitments and Disbursements                      28
4.4 ICA Member Activities                                        34
5. Other Public Sources of Financing                             38
5.1 African National Budgets for Infrastructure                  38
5.2 Subnational Financing                                        42
5.3 China                                                        44
5.4 Arab Co-ordination Group                                     46
5.5 Non-ICA European Sources                                     48
5.6 Regional Development Banks                                   50
5.7 Brazil, India, South Korea                                   51
6. Private Sector                                                52
6.1 Private Sector Engagement with the Public Sector             52
6.2 Private Sector Survey                                        55
7. Sectoral Analysis                                             58
7.1 Overview                                                     58
7.2 Transport                                                    60
7.3 Water and Sanitation                                         64
7.4 Energy                                                       68
7.5 ICT                                                          72
7.6 Multi-sector                                                 76
8. Regional Analysis                                             78
8.1 Support for Regional and PIDA Projects                       78
8.2 North Africa                                                 80
8.3 West Africa                                                  81
8.4 Central Africa                                               82
8.5 East Africa                                                  83
8.6 Southern Africa, Excluding Republic of South Africa          84
8.7 Republic of South Africa                                     85
Annexes                                                          86

                INFRASTRUCTURE FINANCING TRENDS IN AFRICA - 2015 | 3
Foreword

 It is a pleasure to present to you the seventh edition of the ICA   these financings may well be critical in this emerging
 annual report, Infrastructure Financing Trends in Africa –          paradigm. Development partners are also looking beyond
 2015. The report presents trends in a consistent manner,            projects, investing in people through training and skills
 identifying how resources are being mobilised to make an            development initiatives and schemes to mobilise African
 impact on Africa’s infrastructure development.                      people and businesses to create and maintain the continent’s
                                                                     infrastructure.
 Innovations in this year’s report include more detailed analysis
 of the processes and dynamics that drive or restrain the            The role of the Programme for Infrastructure Development in
 continent’s infrastructure financing trends. The report includes    Africa (PIDA) and its Priority Action Plan (PAP) is examined
 views from a wide range of stakeholders on these forces and         against a backdrop of increased commitments to some of its
 how strategies are emerging and developing to address the           larger programmes. Commitments to PIDA/PAP projects are
 challenges of infrastructure financing in Africa. As well as        substantially up in 2015, exceeding $1.3bn and accounting for
 perspectives from ICA members, the report includes views            7.2% of overall commitments, 4.8% of country commitments
 from private sector stakeholders in Africa’s infrastructure         and 16.2% of regional commitments.
 development, including private equity investors, debt               At the other end of the scale, Infrastructure Financing Trends in
 financiers, developers and major contractors.                       Africa – 2015 looks at the challenges of financing smaller scale
 Infrastructure Financing Trends in Africa – 2015 shows total        developments such as the increasing range of renewable
 commitments from all sources analysed of $83.4bn compared           energy opportunities.
 with $74.5bn in 2014. This 12% increase is encouraging, though      Climate change considerations rose to the fore in 2015 in the
 some sources of funds differ markedly. China announced               wake of the UN Climate Change Conference (COP 21) that led
 $20.9bn of investments in infrastructure in 2015 compared           to the Paris Agreement in which 195 countries adopted the
 with $3.1bn in 2014. Identified budget allocations from 44          first-ever universal, legally binding global climate deal. The
 African governments were limited to $28.4bn in 2015,                report describes how ICA members have risen to the challenge
 compared with $34.5bn from 42 countries in the previous year.       of focusing even more on developing climate resilient
 There was no exceptional item of funding such as the $8.4bn         infrastructure. We hope that the 2016 edition will cover this in
 raised in 2014 by Egyptian citizens for the expansion of the        more in detail.
 Suez Canal. The Arab Co-ordination Group committed $4.4bn
 to infrastructure projects across the continent.                    All ICA members focus on mechanisms for improving and
                                                                     assessing the effectiveness of their work. This year’s report
 ICA members reported infrastructure financing commitments           focuses on Quality Infrastructure, an emerging approach in
 of $19.8bn in 2015. Comparing data on a broadly like-for-like       infrastructure development circles that incorporates elements
 basis, excluding exceptional contributions, commitments have        of economic efficiency, social inclusion, safety and resilience
 remained quite constant over the four years to 2015 at              and environmental sustainability.
 between $18.3bn and $19.8bn.
                                                                     Infrastructure Financing Trends in Africa – 2015 looks at
 Data from the UK’s development finance institution CDC is           development partner support for centres of training
 included for the first time in the ICA members’ data. Additional    excellence to bridge the human resource capacity gap in the
 data from the US’ Power Africa initiative is provided in this       energy sector and on private sector investments that are
 year’s report too.                                                  creating skills development opportunities in the ICT sector and
                                                                     new manufacturing facilities in the railway sub-sector.
 ICA members are consistently mobilising their resources.
 Disbursements totalled $12.6bn in 2015 compared with $13bn          The ICA plans in the 2016 edition of Infrastructure Financing
 in 2014. Over recent years, they have remained reasonably           Trends in Africa to specifically monitor and analyse resource
 constant, amounting to $11.4bn in 2013 and $12.7bn in 2012.         flows to important Renewable Energy and Climate Change
                                                                     initiatives. This is in line with the ICA vision that all Africans
 The European Bank of Reconstruction and Development has             should have access to sustainable and reliable infrastructure
 emerged as a major infrastructure funder in North Africa with       services, including energy, transport, water and ICT. We are
 commitments of $638m.                                               sure this report will inform and assist the mobilisation of
                                                                     resources needed to achieve that vision.
 Blended finance and a greater use of development capital are
 amongst the innovative finance mechanisms deployed to
                                                                                                     MOHAMED H HASSAN
 leverage public and private funds for infrastructure
 development. Support from ICA members able to catalyse                                     Co-ordinator, ICA Secretariat

4 | INFRASTRUCTURE FINANCING TRENDS IN AFRICA – 2015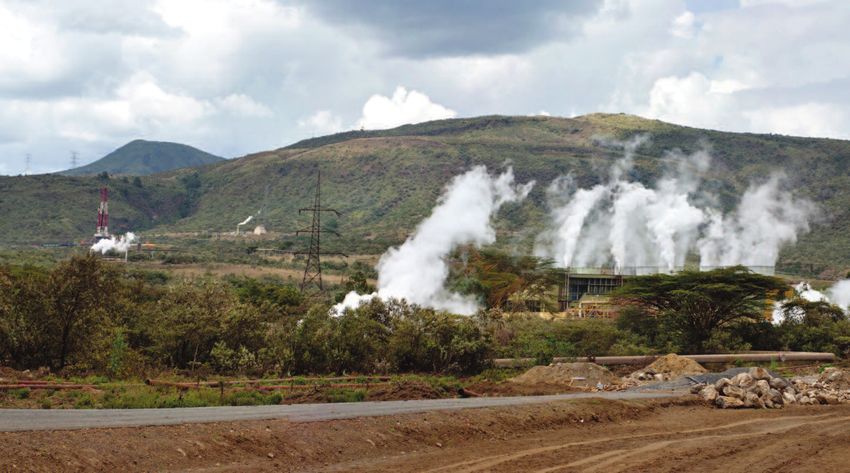
About the ICA

The Infrastructure Consortium for            infrastructure development with an          improve the co-ordination of activities
Africa (ICA) was launched at the             emphasis on regional infrastructure,        among members, and with other
G8 Gleneagles summit in 2005. The            recognizing the challenges at this          significant sources of infrastructure
membership is the G8 countries,              scale. The Consortium is intended to        finance, including China, India, Arab
the World Bank Group, the African            make its members more effective at          and Islamic financiers, African
Development Bank (AfDB) Group,               supporting infrastructure by pooling        regional development banks and the
the European Commission, the                 efforts in selected areas such as           private sector. n
European Investment Bank and                 information     sharing,      project
Development Bank of South                    development and good practice.               Urban Transportation
Africa.
                                             Although ICA is not a financing              The Diagnostic Study and Project
African institutions such as the             agency, the consortium acts as a             Development/Investment Pipeline for
                                             platform to broker more financing            Urban Transportation in Sub-Saharan
African Union, the New Partnership
                                                                                          Africa was commissioned by the ICA,
for Africa’s Development (NEPAD)             of infrastructure projects and               with funds from EIB and the EC, and
and     the    Regional  Economic            programmes in Africa.                        support from AfDB.
Communities all participate as               The main objectives of the ICA can be        The study was set in the context of a
observers in the meetings of the             broadly defined as follows:                  Sub-Saharan African urban population
consortium. AfDB has hosted the                                                           set to grow from 40% to over 56% by
Secretariat of the ICA since its             • Increase the amount of finance             2050. The continent is rapidly
                                             going to sustainable infrastructure in       transforming into a predominantly
inception in 2006.
                                                                                          urban continent. Urban proliferation
                                             Africa from public, private and public
At the May 2011 Annual meeting of the                                                     can drive significant and inclusive
                                             and private sources;                         economic growth. But challenges
Consortium, the decision was made to                                                      remain. Several cities will almost
                                             • Facilitate    greater cooperation
enlarge ICA membership from G8 to                                                         double in size over the next 30 years.
                                             between members of ICA and other
G20. In November 2013, the Republic of
                                             important sources of finance e.g.            The objective was to identify specific
South Africa joined the ICA as the first                                                  opportunities and develop a project
                                             China, India, Arab Funds and the
G20 country non-G8 and first African                                                      development and investment pipeline
                                             private sector;
country member of the ICA.                                                                of urban transportation projects in
                                             • Highlight and help remove policy           Sub-Saharan Africa.
The ICA is a major initiative to             and technical blockages and progress;        Stage one of the study diagnosed and
accelerate progress to meet the urgent                                                    assessed 16 of Africa’s fastest growing
                                             • Increase knowledge of the sector
infrastructure needs of Africa in                                                         and largest cities based on earlier
                                             and through monitoring and reporting
support of economic growth and                                                            studies by the Sub-Saharan Africa
                                             on the key trends and development.           Transport Programme (SSATP) on
development. It addresses both
                                                                                          Mobility and Accessibility in Urban
national and regional constraints to         Increasingly, the ICA is working to
                                                                                          Areas of Africa. The aim was to identify
                                                                                          five potential cities or urban areas in
 IWA/ICA Nexus Report                        indicates where investment can be            which investable projects could be
                                             focused.                                     developed. The study looked at each
 The “nexus” is the place where water,                                                    location’s needs for urban mobility,
 energy and agricultural security            The study applied a structured analytical
                                                                                          transport or accessibility projects and
 systems intersect. All rely on water        process to Africa’s Volta and Lake
                                                                                          services as well as each urban area’s
 infrastructure.   A    major     study      Victoria basins and used this analysis to
                                                                                          preparedness to host investable urban
 commissioned by the International           provide an overview of regional
                                                                                          transport projects.
 Water Association on behalf of the ICA      challenges and opportunities for
 and published in 2015 looks at how to       multipurpose water infrastructure. It set    Stage two comprised field surveys of
 address the water, agriculture and          out to design a framework for assessing      cities – Accra, Addis Ababa, Dakar, Dar
 energy security “nexus” in Africa. The      how      current      and     upcoming       es Salaam and Lagos – and identified
 International Union for Conservation        infrastructure projects deal with nexus      and assessed five projects that could
 Nature was also a partner in                challenges.                                  be considered for investment or other
 development of the study.                                                                financing by ICA members including
                                             Central to the nexus concept is
                                                                                          proposals for candidate PPP projects.
 Nexus Trade-offs and Strategies for          an       understanding      of      the
                                                                                          Opportunities for investment in
 Addressing the Water, Agriculture and       interdependencies between the three
                                                                                          sustainable urban transport mobility
 Energy Security Nexus in Africa outlines    systems. The nexus concept involves a
                                                                                          were then identified.
 a roadmap towards solutions in a typical    process for allocating and using
 African transboundary river basin. It       resources to ensure water, energy and        The ICA then arranged an investors’
 identifies possible regional solutions to   food security for growing populations at     conference to present and discuss the
 local problems and an understanding of      a time of climate change, land use           study’s recommendations and to
                                             transformation       and     economic        share the investment opportunities
                                             diversification. n                           identified in the studies. n
 the institutional capacity required and
 the gaps that need to be filled. This

                                                          INFRASTRUCTURE FINANCING TRENDS IN AFRICA – 2015 | 5
Definitions, Acronyms

Budget Data                              project from identification through        Gabon, Rwanda, São Tomé and
                                         concept design to financial close. This    Príncipe (STP).
Budget allocations: Total approved       includes feasibility testing and
                                                                                    East Africa: Djibouti, Eritrea,
government budget for the respective     financial and legal structuring, as well
                                                                                    Ethiopia, Kenya, Seychelles, Somalia,
item.                                    as raising capital.
                                                                                    South Sudan, Sudan, Tanzania,
Total infrastructure budget: Sum                                                    Uganda.
                                         Funding
of energy, water and sanitation,
                                                                                    Southern Africa excluding RSA:
transport, and ICT budget allocations.   Commitments:         Direct   funds
                                                                                    Angola, Botswana, Comoros, Lesotho,
Where available, significant multi-      approved in a given year to projects
                                                                                    Madagascar, Malawi, Mauritius,
sector or other infrastructure           over their lifetime.
                                                                                    Mozambique, Namibia, Swaziland,
allocations are indicated separately.                                               Zambia, Zimbabwe.
                                         Disbursements: Money outflow
                                         going to infrastructure projects during    RSA: Republic of South Africa.
ICA Members                              a given year.
AfDB, DBSA, EC, EIB, G8 countries,       ODA – official development                 Regional Development
Republic of South Africa and the         Assistance: Grant or loan with public      Banks
World Bank Group. In 2011 all G20        concessional modalities administered
                                                                                    Central African States Development
countries were invited to join the       by donor government agencies.
                                                                                    Bank (CASDB), DBSA (an ICA
ICA. The AU Commission, NEPAD
                                         Non ODA: Non-concessional funding          member), EBID, EADB, West African
Secretariat and Regional Economic
                                         from public or private sources.            Development Bank (BOAD).
Communities participate as
observers at ICA meetings.               Regional project: Projects with
                                                                                    Sector
                                         direct beneficiaries in more than one
Infrastructure                           country. These can either be cross-        Transport: Airports, ports, rail, road.
                                         border projects or other regional
Total infrastructure budget: Sum                                                    Energy: Generation, transmission
                                         integration projects involving a
of energy, water and sanitation,                                                    and distribution of electricity and gas
                                         minimum of two countries or national
transport, ICT, and multi-sector                                                    (including pipelines, and associated
                                         projects.
infrastructure budget allocations.                                                  infrastructure).

Hard infrastructure:          Physical   Location
                                                                                    Water and sanitation: Sanitation,
infrastructure.                          North Africa: Algeria, Egypt, Libya,       irrigation, (trans-boundary) water
Soft infrastructure: Measures to         Mauritania, Morocco, Tunisia.              resource infrastructure, water supply,
support or accompany the production                                                 waste (solid & liquid) treatment
                                         West Africa: Benin, Burkina Faso,
of physical infrastructure outputs,                                                 and management.
                                         Cape Verde, Gambia, Ghana, Guinea,
including      research,    enabling     Guinea Bissau, Côte d’Ivoire, Liberia,     ICT: Information and communication
legislation, project preparation and     Mali, Niger, Nigeria, Senegal, Sierra      technology, including broadband,
capacity building.                       Leone, Togo.                               mobile network, satellite.
Project      preparation:         The    Central Africa: Burundi, Cameroon,         Multi-sector: Not sector-specific or
undertaking of all project preparation   Central African Republic (CAR),            cross-cutting projects. This could
cycles or development activities         Chad, Congo, Democratic Republic of        include implementation of a PPP unit
necessary to take an infrastructure      Congo (DRC), Equatorial Guinea,            or capacity building programmes.

Acronyms
ADF – African Development Fund           AfDB-OPSD – Private Sector Department      AUC – African Union Commission
ADFD – Abu Dhabi Fund for Development    AfDB-OWAS     –   Water   &   Sanitation   AWF – African Water Facility
                                         Department                                 BADEA – Arab Bank for Economic
AFC – Africa Finance Corporation
                                         AfDB-OWAS UA                               Development in Africa
AFD – Agence Française de
Développement (France)                   AFESD – Arab Fund for Economic and         BDEAC – Banque de Développement des
                                         Social Development                         Etats de l’Afrique Centrale
AfDB – African Development Bank
                                         AMCOW–African Ministers Council on         BIDC – Banque d’Investissement et de
AfDB-OITC – Transport & ICT Department   Water                                      Développement de la CEDEAO (EBID)
AfDB-ONEC – Energy, Environment and      ACG – Arab Co-ordination Group             bn – 1 billion = 1,000,000,000
Climate Change Department                AU – African Union                         BIO – Belgian Investment Company for

6 | INFRASTRUCTURE FINANCING TRENDS IN AFRICA – 2015
Developing Countries                            GIF – Global Infrastructure Facility          PIDA – Programme for Infrastructure
BOAD – Banque Ouest Africaine de                GIZ – Deutsche Gesellschaft             für   Development in Africa
Développement                                   Internationale Zusammenarbeit                 PIDA/PAP –      PIDA    Priority    Action
BOOT – build-own-operate-transfer               IBRD   –    International  Bank         for   Programme
BNDS     –   Banco          Nacional      de    Reconstruction and Development                PPA – power purchase agreement
Desenvolvimento                                 ICA – Infrastructure Consortium for Africa    PPDU – ECOWAS’ Project Preparation and
C2Ds – Debt Reduction-Development               ICT – Information and Communications          Development Unit
Contracts                                       Technology                                    PPFN – Project Preparation Facilities
CADF – China-Africa Development Fund            IDA   –   International   Development         Network
CAGR – compound annual growth rate              Association (World Bank Group)                PPIAF – Public-Private Infrastructure
                                                IDB – Islamic Development Bank                Advisory Facility
CAR – Central African Republic
                                                IDC – Industrial Development Corporation      PPIU – COMESA’s Project Preparation and
CASDB – Central         African        States
                                                of South Africa Ltd                           Implementation Unit
Development Bank
                                                IFC – International Finance Corporation       PPP – public-private partnership
CIF – Climate Investment Fund
                                                IPO – initial public offering                  Proparco – AFD’s private sector arm
COFIDES – Spanish Development Funding
Company                                         IPP – independent power                       PTA Bank – Preferential Trade Area Bank
COMESA – Common Market for Eastern              producer/project                              PV – photovoltaic
and Southern Africa                             IPPF – Infrastructure Project Preparation     RDB – regional development bank
CSP – concentrated solar power                  Facility                                      RECs – Regional Economic Communities
DBSA – Development Bank of Southern             ITF – Infrastructure Trust Fund               RSA – Republic of South Africa
Africa                                          JBIC – The Japan Bank for International       SADC – Southern African Development
DEG – Deutsche Investitions- und                Co-operation                                  Community
Entwicklungsgesellschaft (KfW Group)            JICA – Japan International Co-operation       SEFA – Sustainable Energy Fund for Africa
DFI – development finance institution           Agency
                                                                                              SFD – Saudi Fund for Development
DFID – Department for International             KFAED – Kuwait Fund for Arab Economic
                                                                                              SME – small- and medium-size enterprise
Development (UK)                                Development
                                                                                              SSA – Sub-Saharan Africa
DRC – Democratic Republic of Congo              KfW – KfW Development Bank (Germany)
                                                                                              SWF – sovereign wealth fund
EAC – East African Community                    LIC – low-income country
                                                                                              TA – technical assistance
EADB – East Africa Development Bank             m – 1 million = 1,000,000
                                                MD – Moroccan dirham                          TSF – Transition Support Facility
EAIF – Emerging Africa Infrastructure
Fund                                            MCC – Millennium Challenge Corporation        UEMOA – West African Economic and
EAPP – Eastern African Power Pool               MDB – Multilateral development banks          Monetary Union
EBID – ECOWAS Bank for Investment and           MIC Fund – Middle Income Countries            UNECA – United Nations Economic
Development                                     Fund                                          Commission for Africa
EC – European Commission                        MIGA – Multilateral Investment Guarantee      UAE – United Arab Emirates
ECA – export credit agency                      Agency (WBG)                                  UK –United Kingdom of Great Britain and
                                                MoU – memorandum of understanding             Northern Ireland
ECOWAS – Economic Community Of West
African States                                  MW – megawatt                                 US – United States
EDF – European Development Fund                 NEPAD – New Partnership for Africa’s          $ – US dollar
EDFI – European DFIs                            Development                                   USAID – United States Agency for
                                                NTF – Nigeria Trust Fund                      International Development
EIB – European Investment Bank
                                                Norfund – Norwegian            Investment     USTDA – US Trade and Development
EPC – engineering, procurement and
                                                Development Fund for           Developing     Agency
construction
                                                Countries                                     WACDEP – Water, Climate & Development
EU-AITF – European            Union-Africa
                                                NPCA – NEPAD Planning             and   Co-   Programme
Infrastructure Trust Fund
                                                ordinating Agency                             WAPP – West African Power Pool
EXIM Bank – The Export-Import Bank of
the United States                               O&M – operations and maintenance              WBG – World Bank Group
FMO – Netherlands’           Development        OCGT – open cycle gas turbine                 WSP – Water and Sanitation Programme
Finance Company                                 ODA – official development assistance         ZAR – South African rand
G8 – Group of Eight (Canada, France,            OeEB – Development Bank of Austria
Germany, Italy, Japan, Russia, UK, US)          OFID – Organisation of the Petroleum
G20 – Group of 20 (Argentina, Australia,        Exporting Countries [OPEC] Fund for
Brazil, Canada, China, France, Germany,         International Development
India, Indonesia, Italy, Japan, South           OPIC – Overseas Private Investment
Korea, Mexico, Russia, Saudi Arabia,            Corporation (US)
South Africa, Turkey, UK, US and the EU)
                                                % – per cent

                                                               INFRASTRUCTURE FINANCING TRENDS IN AFRICA – 2015 | 7
List of Graphics and Maps

Figure 1:ICA members’ commitments & disbursements, 2010-15 10           Figure 49: Subnational financing – average sources of funds       42
Figure 2: Total infrastructure financing, 2010-2015                10   Figure 50: Subnational financing – average spend per sector       42
Figure 3: Total infrastructure financing in 2015 by sector         11   Figure 51: Chinese commitments by sector 2011-2015                44
Figure 4: Total infrastructure financing in 2015 by region         11   Figure 52: Chinese commitments by region 2011-2015                45
Figure 5: Total infrastructure financing in 2015 by source         11   Figure 53: ACG commitments by sector & region, 2013-2015          46
Figure 6: Financing flows into Africa’s infrastructure, 2015       12   Figure 54: ACG commitments, by institution 2010-2015              47
Figure 7: Sources of finance 2015, public external and private     13   Figure 55: European commitments by sector, 2015                   48
Figure 8: Total infrastructure commitments by sector & region 13        Figure 56: European commitments by region by %, 2015              48
Figure 9:Total infrastructure commitments by sector & source 14         Figure 57: European commitments by country and EBRD, 2015         49
Figure 10: Total infrastructure commitments by sector, 2014-15     14   Figure 58: DBSA commitments by sector, 2015                       50
Figure 11: Trends in ICA member commitments, 2010-2015             15   Figure 59: BOAD commitments by sector, 2015                       50
Figure 12: Total infrastructure commitments by region & source 16       Figure 60: India commitments 2012-2015                            51
Figure 13: Total commitments by region, 2014- 2015                 16   Figure 61: PPI Project Database trends 2010-2015                  52
Figure 14:Total ICA member commitments by region, 2011-2015 17          Figure 62:Private sector projects reaching financial close, 2015 53
Figure 15: Total ACG commitments by region, 2011-2015              17   Figure 63: Private sector financing by region, 2015               53
Figure 16:ICA member & ACG commitments by region, 2011-15          17   Figure 64: Private sector financing trends by sector, 2010-2015   53
Figure 17: Average ICA & ACG commitments by region, 2011-15 17          Figure 65: Private sector survey: respondents’ role               55
Figure 18: ICA members’ 2015 commitments by sector                 24   Figure 66: Sectors where respondents are active                   55
Figure 19: ICA members’ 2015 commitments by region                 24   Figure 67: Investment destinations – top 10 attractive countries 56
Figure 20: ICA members’ 2015 commitments by type of funding 26          Figure 68: Investment destinations – top three first choices      56
Figure 21: ICA members’ 2015 hard/soft/project preparation              Figure 69: African portfolio intentions, next two years           57
infrastructure commitments                                         27   Figure 70: Greatest challenges facing the private sector          57
Figure 22: ICA members’ 2015 hard and soft infrastructure               Figure 71: Delays experienced by the private sector               57
disbursements                                                      27   Figure 72: Total financing by sector and source, 2015             59
Figure 23: ICA members’ commitments by sector, 2010-2015           28   Figure 73: ICA member commitments to transport, 2011-2015         61
Figure 24: ICA members’ commitments by region, 2010-2015 28             Figure 74: Total commitments to transport, 2014 & 2015            61
Figure 25: ICA members’ 2015 commitments, donor and region 29           Figure 75: Transport sector map with selected projects            63
Figure 26: ICA members’ 2015 disbursements, donor and region 29         Figure 76: Total transport sector commitments by region, 2015     63
Figure 27:ICA members’ 2015 commitments, sector and region 30           Figure 77: ICA member commitments to water, 2011-2015             65
Figure 28:ICA members’ 2015 disbursements, sector and region 30         Figure 78: Total commitments to water, 2014 & 2015                65
Figure 29:ICA members' disbursements by sector, 2012-2015 30            Figure 79: Water sector map with selected projects                67
Figure 30: Disbursement rates per sector for selected ICA               Figure 80: Total water sector commitments by region, 2015         67
member projects completed in 2015                                  31
                                                                        Figure 81: ICA member commitments to energy, 2011-2015            69
Figure 31:Trends in regional infrastructure portfolios, 2010-2015 32
                                                                        Figure 82: Total commitments to energy, 2014 and 2015             69
Figure 32: Country vs. regional commitments per sector
                                                                        Figure 83: Energy sector map with selected projects               71
incl PIDA/PAP shares                                               33
                                                                        Figure 84: Total energy sector commitments by region, 2015        71
Figure 33: Country vs. regional disbursements per sector
incl PIDA/PAP shares                                               33   Figure 85: ICA member commitments to ICT, 2011-2015               73

Figure 34: National government budget allocations control               Figure 86: Total commitments to ICT, 2014 and 2015                73
group (larger economies) $bn, 2013-2015                            39   Figure 87: ICA member multi-sector commitments, 2011-2015         77
Figure 35: National government budget allocations control               Figure 88: Total multi-sector commitments, 2014 and 2015          77
group (smaller economies), 2013-2015                               39   Figure 89: Total commitments to North Africa, sector & source     80
Figure 36: National government budget allocations by sector 39          Figure 90: ICA members’ commitments to North Africa, 2011-15 80
Figure 37: National government budget allocations by region        39   Figure 91: Total commitments to West Africa, sector & source      81
Figure 38: Identifiable national budget allocations, South Africa 40    Figure 92: ICA members’ commitments to West Africa, 2011-15 81
Figure 39: Identifiable national budget allocations, Egypt         40   Figure 93: Total commitments to Central Africa, sector & source 82
Figure 40: Identifiable national budget allocations, Angola        40   Figure 94: ICA members’ commitments to Central Africa, 2011-15 82
Figure 41: Identifiable national budget allocations, Ethiopia      40   Figure 95: Total commitments to East Africa, sector & source      83
Figure 42: Identifiable national budget allocations,Cameroon 40         Figure 96: ICA members’ commitments to East Africa, 2011-15 83
Figure 43: Identifiable national budget allocations, Nigeria       40   Figure 97:Total commitments, Southern Africa, sector & source     84
Figure 44: Infrastructure in national budgets, 2015, $ per capita 41    Figure 98: ICA members’ commitments, Southern Africa, 2012-15 84
Figure 45: Infrastructure in national budgets, 2015, % of GDP      41   Figure 99: Total commitments to South Africa, sector & source 85
Figure 46: Percentage of infrastructure allocations by sector      41   Figure 100: ICA members’ commitments, South Africa, 2012-15 85
Figure 47: Sources of finance for sample cities & municipalities   42   Figure 101: ICT sector map with selected projects                 89
Figure 48: Spend by sector for sample cities & municipalities      42   Figure 102: Total ICT sector commitments by region, 2015          89

8 | INFRASTRUCTURE FINANCING TRENDS IN AFRICA – 2015
1. The Big Picture – 2015

INFRASTRUCTURE FINANCING TRENDS IN AFRICA – 2015 | 9
1.1 Key Messages and Findings

A total of $83.4bn was committed             energy sector, with South Africa the
to     Africa’s      infrastructure          main beneficiary with investments of
development in 2015 compared                 $3.8bn.
with $74.5bn in 2014. This
                                             Even though the total amount of
comprised nearly $28.4bn of identified
                                             commitments is 12% up in 2015
African national budget allocations,
                                             compared with 2014, there are causes
commitments from ICA members of
                                             for concern due to steep declines in
$19.8bn, identifiable private sector
                                             one sector, water, and one region,
investment of $7.4bn and $27.7bn
                                             Central Africa.
from    non-ICA      bilateral    and
multilateral financiers.                     Water sector commitments show a
Of the $27.7bn of non-ICA                    trend of significantly declining
bilateral and multilateral finance,          commitments since 2013. In that
$20.9bn is from announcements of             year, ICA commitments alone to the
funding        from    China.       This     sector were nearly $6bn but by 2015,
compares with just $3bn in the               total funding from all sources
previous year while the average of           amounted to $8.1bn. Of this amount,
announced investments from China             ICA members alongside other
over the five years to 2015 is $12.3bn.      development partners provided 44%
Wide year-on-year fluctuations and           while national governments provided
lack of official data make it difficult to   around 51%. The private sector
verify figures regarding China’s             provided just 1.4%, while China rarely
investments in Africa.                       invests in water projects.

In contrast, 2015 saw reduced                Central Africa saw a substantial
identifiable        infrastructure           $3.4bn or 41% fall in anticipated
allocations of $28.4bn by 44                 infrastructure spending from
African national governments                 $8.3bn in 2014 to $4.9bn in 2015,
compared with $34.5bn based on 42            due to African national government
countries in 2014. The reduction in          budget allocations declining from
allocations was most marked in oil           $4.3bn to $2.2bn and ICA members’
producing economies.                         commitments declining from $3.7bn to
                                             $1.3bn. Arab Co-ordination Group
Private    sector    commitments             (ACG) members’ commitments are up
increased by $4.6bn in 2015 to               from a relatively low base of $79m in
$7.4bn, of which $7.2bn went to the          2014 to $498m in 2015.

                                             South Africa saw the biggest
                                             increase in commitments from
                                             $4.9bn in 2014 to $11.7bn in 2015,
                                             substantially due to Chinese and
                                                                                      Figure 2
                                             private capital in its transport and     Total infrastructure financing, 2010-
                                             energy sectors.                          2015

                                             Energy      sector    commitments
                                                                                      member commitments increased from
                                             appear to have seen a sustained
                                                                                      $3.7bn in 2014 to $6.8bn in 2015 while
                                             but not entirely even increase
                                                                                      ACG commitments over the same
                                             over the last five-years, attracting
                                                                                      period increased from $1.2bn to
                                             increasing amounts of both public and
                                                                                      $2.1bn. Overall commitments to the
                                             private capital. But the increase is
                                                                                      transport sector remained broadly the
                                             centred on North Africa and Southern
                                                                                      same in 2015 at $34.7bn compared
                                             Africa.
                                                                                      with $34.3bn in the previous year,
                                             There are substantially more             although the 2014 data included the
Figure 1
                                             commitments to the transport             exceptional $8.4bn Suez Canal
ICA members’ commitments and
disbursements, 2010-2015                     sector from several sources. ICA         funding.

10 | INFRASTRUCTURE FINANCING TRENDS IN AFRICA – 2015
Whereas there are several indications USAID, which did not report in 2014, and to increase the impact of EU aid.
of stronger investment flows into the comprises information from the Power The facility will progressively
energy sector it is too soon to tell Africa interagency, including OPIC, substitute EU-AITF.
whether increased flows to transport EXIM Bank, USTDA and others.
Blending mechanisms – albeit with
operations from some sources marks EXIM Bank, OPIC and MCC did not
different definitions of what
the beginning of an upward trend. provide data directly.
constitutes blended funding – are
ICA members reported infrastructure Data for CDC, the wholly-UK much talked about among some ICA
financing commitments of $19.8bn in government owned DFI that manages members and attracted $1.4bn in
2015. This is 5.6% or $1bn more than capital provided entirely by DFID is commitments during 2015 compared
the $18.8bn reported in 2014 but provided for the first time. Russia’s with $1.3bn in 2013.
includes additional data from the US Prognoz responded to the ICA’s
‘Quality Infrastructure’ is
(Power Africa, $307m) and the UK request for data for the first time and
emerging as a new approach in
(CDC, $139m). reported that it had made no
infrastructure development
commitments in 2015 to Africa’s
Disbursements in 2015 totalled circles. It incorporates elements of
infrastructure.
$12.6bn, a small decline of 2.9% economic efficiency, social inclusion,
compared with the $13bn DBSA’s regional funding portfolio safety and resilience, environmental
reported in 2014. looks set on a growth path. In 2015 sustainability as well as the
it made regional commitments of convenience and comfort seen as vital
Disbursements over recent years have
$292m. New commitments from for sustainable development.
remained reasonably constant,
DBSA’s international operations were
amounting to $11.4bn in 2013 and Private sector interest in
made in respect of initiatives
$12.7bn in 2012. infrastructure is certainly robust
in Congo, DRC, Kenya, Nigeria,
in some areas, notably in Nigeria’s
Commitments to PIDA/PAP Tanzania, Uganda and Zambia.
ICT sector and South Africa’s
projects exceeded $1.2bn in 2015,
DBSA, acting as fund manager on renewables market and growing in
a very substantial increase over
behalf of the SADC Project others, including Morocco’s water
the $161m reported in 2014. The
Preparation and Development sector and East Africa’s ports.
$1.2bn of PIDA commitments
Facility, obtained approval for the first
reported in 2015 represent 7.2% of In the fourth annual African
allocation of preparation funding, with
overall commitments, 4.8% of country Infrastructure Investment Survey,
$3.5m for the development of the
commitments and 16.2% of regional South Africa ranked top in the
Mozambique-Zimbabwe-South Africa
commitments. choice of investment location. In
regional power interconnector.
2014 it shared the top spot with
The EBRD in 2015 emerged as
The EC has launched the Africa Kenya, which has dropped back to
major contributor to Africa’s
Investment Facility (AfIF), a new second place in the rankings. Ghana
infrastructure with commitments
blending mechanism that started has taken third position from Nigeria,
of more than $638m.
operating in November 2015 and which is now in fourth place. Morocco,
Of members who have reported in the combines grants with other resources which did not feature in the top ten
previous four years Germany’s DEG such as loans from DFIs to leverage investment locations at all in 2014,
provided no data. Data submitted by additional financing for development ranked fifth in the 2015 survey. n
Figure 3 Figure 4 Figure 5
Total infrastructure financing in 2015 by Total infrastructure financing in 2015 by Total infrastructure financing in 2015 by
sector region source
INFRASTRUCTURE FINANCING TRENDS IN AFRICA – 2015 | 112. Financing Trends
Figure 6
Reported and
identified
financing flows
into Africa’s
infrastructure,
2015
2.1 Who Is Financing Africa’s Infrastructure
A total of $83.4bn was committed analysis of identifiable infrastructure (excluding DBSA) committed $418m
to Africa’s infrastructure allocations across 44 African national in 2015, a decrease on the $583m
development compared with governments revealed that $28.4bn committed in 2014.
$74.5bn in 2014. But there has was allocated in 2015 compared with
been a substantial shift in the $34.5bn based on 42 countries in ICA members committed $19.8bn in
sources of funds committing to 2014. 2015, up from $18.8bn in 2014.
infrastructure spending. Excluding the exceptional Power
Contributions from non-ICA bilaterals
Africa contribution of $7bn to 2013
Announcements of Chinese funding and multilaterals apart from China
increased from around $6bn in 2014 to figures, ICA member commitments
are up to nearly $21bn in 2015
$6.8bn in 2015, largely as a result of have remained quite constant over the
compared with just $3bn in the
ACG commitments increasing from past four years at between $18.3bn
previous year. In 2013, announced
investments from China were $9.1bn $3.5bn in 2014 to a record $4.4bn in and $19.8bn.
while the average over the five years 2015, surpassing the group’s
A notable aspect of this year’s report is
to 2015 is $12.3bn. But the wide year- previously highest commitments of
$3.9bn in 2012. Overall commitments that there are no reported exceptional
on-year fluctuations and lack of
in 2015 were bolstered by $500m from single-item fundings. The 2014 report
official data render it very difficult to
Brazil, $524m from India and $88m recorded the $8.4bn Suez Canal
predict future trends with any
from South Korea. expansion funding by public
accuracy.
subscription to investment certificates,
Commitments from non-ICA
The apparent increase in funding while the $7bn Power Africa
European DFIs and multilaterals
from China in 2015 is offset by contribution was reported in 2013.
reduced from $1.3bn to $876m, most
pressure from low oil and commodity
of which was provided by the EBRD, However, China’s $21bn of reported
prices on African governments to
with approvals of $638m.
allocate fewer budget resources to investments could be considered
infrastructure development. The ICA’s Africa’s regional development banks 2015’s exceptional circumstance. n
12 | INFRASTRUCTURE FINANCING TRENDS IN AFRICA – 2015Figure 7
Sources of
finance 2015,
public external
and private
Figure 8
Total 2015
infrastructure
commitments by
sector and
region
INFRASTRUCTURE FINANCING TRENDS IN AFRICA – 2015 | 132.2 Financing Trends By Sector
Figures 9 and 10
Total 2015
infrastructure
commitments by
sector and source
(left); Total
infrastructure
commitments by
sector, 2014-2015
(above right)
Of the $83.4bn total financing sector stood at $2.5bn in 2015, slightly
commitments made in 2015, total more than the $2.3bn recorded the Data Note
commitments to the African previous year. Discerning trends by sector requires
transport sector stood at $34.7bn, several years’ analysis of funding
Analysis of consistent ICA and ACG from a consistent set of sources. Data
broadly similar to the $34.4bn
member data provides a clear picture in this report to describe total
recorded the previous year. This infrastructure commitments contains
of how trends are shaping up in
is despite substantial Chinese only two years of reasonably
different sectors. Figure 11 shows consistent data on African national
investments and a significant
investments in all sectors by ICA and government budget allocations so
increase in ICA funding, offset by
ACG members since 2010. meaningful trends based on this
declining budget allocations from wider ranger of sources will yield
African national governments, trends in the future. A two-year
picture is nevertheless useful. n
Transport
traditionally the largest group of
Transport commitments dipped in
funders in the transport sector.
2011-14 but returned to $6.8bn in
Commitments to the water sector 2015, just as was reported in 2010. sources canvassed for this year’s
stood at $8.1bn in 2015, a decline from Commitments from ACG members report suggested substantial amounts
the $9.7bn recorded in 2014. African rose quite sharply to $2.1bn in 2015, of investment were coming into East
national governments allocated and have now overtaken energy Africa because several projects in the
$4.1bn or 50.8% while ICA members allocations making transport the most region, which is also attracting
reported $3.2bn or 39.2% of all water invested in sector by that group. Chinese investment to its transport
commitments. sector, are underpinned by substantial
But commitments to the transport
political will and improved regional
The energy sector received sector can be subject to spikes – in
cohesion.
commitments of $34.7bn in 2015, a terms of public and private sectors –
significant rise on the $22.4bn if a few big projects are committed to
Water
invested the previous year due to in one year, as happened with two big
In the four years to 2014,
announcements of very large Chinese port projects featuring in the PPI
commitments to the water and
investments, strong commitments Database in 2013 for example.
transport sectors from ICA and ACG
from DFIs and successful efforts to
It remains to be seen whether this members broadly tracked each other
attract private investment in South
year’s encouraging increase in but whereas transport allocations
Africa’s renewable sector.
transport sector commitments is a increased in 2015, they declined in the
Total commitments to the African ICT spike or the beginnings of a trend, but water sector.
14 | INFRASTRUCTURE FINANCING TRENDS IN AFRICA – 2015Figure 11
Trends in ICA
member
commitments,
2010-2015 and
combined ICA and
ACG financing,
2011-2015
ICA members are very substantial there is an underlying trend in the 12 seem to be increasing, growing to
players in the water sector, and energy sector of steadily increasing $396m and $506m in the following
reported commitments of $3.2bn in investment. ACG data reveal a sharp two years and reaching $616m in
2015 compared with the $3.4bn in increase in energy commitments in 2015. ACG’s ICT commitments are
2014 – substantially less than 2011 and then levelling out at around
negligible.
commitments of $5bn and $4.7bn in an average of $1.4bn since then.
2013 and 2012 respectively and below But these ICT datasets present only a
Energy projects have also done very
the average of $3.9bn over the six-year partial picture, and a different set of
well in terms of private sector
period. Commitments to the water metrics may well be needed to take
investments, attracting 97% of private
sector from ACG members appear to capital reported in the PPI database in into account some of the now very
have been in decline since 2011 too. 2015. These are predominantly large amounts of private investments
The apparent decline in water sector investments in South Africa and by telecommunications companies
commitments may provide cause for Morocco, perhaps underlining very operating in Africa. Nigeria for
concern, especially since this is a strongly the benefits of robust enabling
example has received some $6bn of
sector that has not stimulated so environments to attract private capital.
foreign direct investment flowing into
much interest from either China or ICT in the three years up to 2015.
the private sector. ICT
Total investment in the sector has
Total commitments to the ICT sector
from sources of finance usually now reached in excess of $38bn by
Energy
monitored in analysis of some estimates (see page 74).
Figure 11 shows that the most
striking feature in financing trends in infrastructure investments in Africa
Other dynamics in the ICT sector
the six years to 2015 is the very high stood at $2.5bn in 2015, slightly more
include increased market penetration
than the $2.3bn recorded the previous
level of energy commitments in 2010. and investment by Chinese
year. ICA member data show an
Without having the project level detail
increase over the last two years in telecommunications firms, notably
to confirm an actual figure, ICA
commitments while the PPI database, Huawei alongside others, and
members’ energy commitments in
which in 2010 and 2011 contained an apparently very investable
that year were substantially due to
substantial amounts of ICT funding, telecommunications tower sector that
large North African energy projects
now contains very little. is attracting finance from both the
and the Eskom Investment Support
Project for South Africa. Taking this ICA members’ ICT commitments, private sector and development
into account, it may be discerned that which averaged under $200m in 2010- partners. n
INFRASTRUCTURE FINANCING TRENDS IN AFRICA – 2015 | 152.3 Financing Trends By Region
Figure 12
Total 2015
infrastructure
commitments by
region and source
Of the $83.4bn total financing A $9.3bn reduction in commitments to
commitments made in 2015, North North Africa is substantially because Data Note
Africa accounted for $14.1bn, the 2014 data include the exceptional Analysing trends by region requires
West Africa $15.2bn, Central $8.4bn of investment certificates several years’ analysis of funding from
Africa $4.9bn, East Africa $19.3bn, bought by Egyptian citizens to fund a consistent set of sources. Data in
Southern Africa $16bn, and RSA the Suez Canal expansion. There were this report to describe total
infrastructure commitments contains
$11.7bn. Intraregional and pan- also fewer commitments from ACG
only two years’ reasonably consistent
African commitments amounted members and lower budget allocations data on African national government
to $2.2bn. to infrastructure by North African budget allocations so meaningful
governments in 2015 compared with trends based on this wider range of
Commitments to Central Africa fell sources will yield trends in the future.
the previous year.
$3.4bn or 41% from $8.3bn in 2014 to A two-year picture is nevertheless
$4.9bn in 2015 (Figure 13, below), due A very substantial increase in useful. n
to African national government commitments to South Africa from
budget allocations declining from $4.9bn to $11.7bn is partly explained Africa also stands to benefit from
$4.3bn to $2.2bn and ICA members’ by a successful bidding round in 2015 $2.2bn of announced investments
commitments declining from $3.7bn to in the country’s REIPPP programme, from China, which include around
$1.3bn. ACG member commitments to which attracted significant private $1.9bn in favour of Transnet for
Central Africa increased to $498m in sector investment, including $3.8bn railway projects as well as a China
2015 from $79m in 2014. recorded in the PPI Database. South Development Bank loan of $500m for
power utility Eskom’s infrastructure
construction programme.
Commitments to Southern Africa
increased by some $4bn, despite
falling African national government
budget allocations, largely due to
newly announced Chinese
investments. These included $4.5bn
for the 2,172MW Caculo Cabaça
Figure 13
hydroelectric project and $840m for
Total commitments
by region, 2014- the 750MW Soyo gas power project,
2015 both in Angola, and $1.2bn for the
16 | INFRASTRUCTURE FINANCING TRENDS IN AFRICA – 2015Hwange coal power plant in
Zimbabwe. Brazil committed $500m
to the Lauca hydropower project.
Analysis of broadly consistent ICA
member data (excluding the
exceptional 2013 Power Africa
contribution) could provide a better
picture of how trends are shaping up
in different regions over recent years.
Figure 14 shows investments in all
regions by ICA members since 2011.
There are few discernible trends here.
Figure 14
In every region except Southern
Total ICA member
Africa, the highest commitment in a commitments by
single year is more than double the region, 2011-2015
lowest annual commitment during
the period analysed. The lowest
commitments for most regions were
reported in 2011, except for East
Africa with $2bn in 2014 and Central
Africa with just $1.3bn in 2015. Figure 15
Total ACG
A steady trend over recent years has commitments by
been the broadening focus of ACG region, 2011-2015
members across the continent.
Commitments to Sub-Saharan Africa
exceeded those to North Africa in
2015 for the first time since 2011. The
group’s expansion across the
continent has been particularly
noticeable in West Africa, where
commitments have increased steadily
each year from $219m in 2011 to
$1.2bn in 2015.
The trend of combined ICA and ACG
members’ total commitments appears
to show that after a lean year in 2011,
allocations to infrastructure returned
to what appears to be becoming a Figure 16
normality for this group of an average Total combined ICA
member and ACG
$21bn a year in the period 2012-15.
commitments by
Figure 17 shows average annual ICA region, 2011-2015
and ACG member commitments to
each region.
While more research is needed, per
capita spending on infrastructure
appears to be highest in Southern
Africa (including South Africa) at
about double the amount spent in Figure 17
Average annual ICA
North Africa. On a regional basis, per
and ACG member
capita spending is perhaps lowest in
East and West Africa. n
commitments by
region, 2011-2015
INFRASTRUCTURE FINANCING TRENDS IN AFRICA – 2015 | 173. General Trends
Olkaria II geothermal power plant – iStock, Byelikova Oksana
3.1 Climate Resilient Infrastructure
ICA members participating in the COP21 and the pursuant nationally The SPCR will review climate change
first Africa Climate Resilient determined contributions (NDCs), vulnerability assessment and risk
Infrastructure Summit in Addis alongside the new Sustainable activities so as to identify key hotspots,
Ababa in April 2015 sent some Development Goals (SDGs), were and assess institutional capacity for
very clear messages. perhaps the two very big deals to climate resilience co-ordination. This
emerge in terms of Africa’s includes mainstreaming climate
A senior regional advisor to the World infrastructure development during change development plans, designing
Bank called for climate change 2015. As a result, ICA members are climate change adaption and
and infrastructure development increasing efforts to promote climate mitigation strategies and establishing
programmes to be at the heart of resilience, some of which build upon the national climate change
Africa’s development agenda, while an existing activities. Information Management System.
EIB loan officer underscored the Similar projects are underway in
AfDB and the IFC are active
bank’s role in efforts to achieve Ethiopia, Malawi, Mozambique and
participants in the Pilot Programme
sustainable development and poverty Niger.
for Climate Resilience (PPCR), the
reduction by highlighting that it had
first programme developed and The World Bank is implementing the
set aside €19bn ($21bn) for climate
operational under the Strategic Lake Chad Development and Climate
action.
Climate Fund (SCF), one of two funds Resilience Action Plan. This project,
Later in the year, a very substantial (alongside the Clean Technology set to run from 2016-2025,
force for developing climate resilient Fund) in the framework of the incorporates aspects of the Lake Chad
infrastructure emerged with the UN Climate Investment Funds (CIF). Basin Commission five-year (2013-
Climate Change Conference (COP 21). 2017) investment plan. Ultimately,
As a part of the PPCR, a national
It led to the Paris Agreement in which this plan aims to turn Lake Chad into
Strategy Programme for Climate
195 countries adopted the first-ever a sustainable regional hub for
Resilience (SPCR) is currently being
universal, legally binding global development.
implemented in several African
climate deal. The agreement, due to countries. In Uganda, the AfDB is In 2015, EIB provided a €8m ($9m)
enter into force in 2020, sets out a leading the implementation of a loan to Omnicane, Mauritius’ largest
global action plan to put the world on national SPCR – supported by IFC, the sugar company. Work has been
track to avoid dangerous climate World Bank and the CIF – that aims to underway over several years on
change by limiting global warming to create and enable resilience to climate initiatives to convert waste products
well below 2°C. change. from the sugar refining process into
18 | INFRASTRUCTURE FINANCING TRENDS IN AFRICA – 2015ICA members’ Respond to Focus on Climate Change
ICA members canvassed for Change Action Plan, which aims to support for Africa contributes to climate
Infrastructure Financing Trends in accelerate efforts to tackle climate adaption or mitigation. While COP21 did
Africa – 2015 described their responses change over the next five years and help not change AFD’s pre-existing focus on
to the increased focus on climate developing countries deliver on their climate change, the NDCs provide
change. NDCs. tangible targets for support.
Climate change considerations are IFC aims to expand its climate As the world’s largest provider of
incorporated in JICA’s projects and investments from the current $2.2bn a climate finance, EIB’s outlook will be
programmes in various sectors. year to a goal of $3.5bn a year, and lead influenced by COP21 and the bank will
Measures against climate change are on leveraging an additional $13bn a year
now play a key part in mobilising the
largely divided into mitigation and in private sector financing by 2020. As
additional resources needed, much of it
adaptation measures. Mitigation well as its own financing, the World Bank
from the private sector. It has
measures are designed to reduce also intends to mobilise $25bn in
greenhouse gas (GHG) emissions or commercial financing for clean energy committed to invest at least 25% of its
increase GHG removal from the over the next five years. lending portfolio in low-carbon and
atmosphere in several sectors, including climate-resilient growth.
Other members have already
energy, transport, solid waste AfDB has committed to triple its climate
demonstrated a clear commitment to
management and forestry, with the aim
climate resilient endeavours. One change finance to about $5bn per year
of promoting low-carbon societies.
significant initiative in this respect is the and to provide $12bn in renewable
Adaptation measures may be built into Geothermal Risk Mitigation Facility for energy investments by 2020. The bank’s
sectors including transport, water and Eastern Africa, involving the AU on the energy unit, while remaining technology
sanitation, and agriculture to make one side and the German Federal agnostic, has upped its estimate on
societies more resilient to climate Ministry for Economic Co-operation and climate resilient financing as countries
change impacts. Development (BMZ), DFID and the EU- increasingly shift towards renewables
AITF via KfW. and the bank expects to support more
At WBG, climate change was a big
consideration prior to COP21 and the Climate resilience is a significant issue renewable projects.
bank is putting much effort into COP22 from a policy point of view for KfW, and Several ICA members and other
during which a sharp focus on Africa is it has responded in practice. In 2015 it
stakeholders forged new partnerships at
expected. Two months before COP21, provided the funding to support South
COP21 in Paris. DFID said it would
WBG President Jim Yong Kim Africa's strategy to increase the
collaborate with the US’ Power Africa
announced a major increase in the efficiency and capacity of its freight
group’s financing to help countries initiative to expand and leverage
transport sector, thereby achieving a
combat climate change by building low modal shift from road to rail. This will investments in cleaner energy; support
carbon and resilient developments. To reduce CO2 emissions and make an power pools and other interventions to
date, about 21% of WBG’s global funding important contribution to protecting the increase cleaner energy power
is climate related. Under new plans, that climate. generation and access to power through
could rise to 28%, a percentage that the regional integration. Specifically Power
group’s infrastructure funding already With France hosting COP21, AFD Africa would collaborate in the DFID-led
way exceeds. organised or participated in around 40 Energy Africa access campaign, which
events in Paris. Following the pledges
focuses on how to rapidly accelerate
Already, WBG has announced plans to made at COP21, the AFD Group, which
growth in the African household solar
help developing countries add 30GW of along with Proparco has already
renewable energy – enough to power industry. This partnership will also
mobilised $18bn for projects that will
150m homes – to the world’s energy have a positive impact on climate support efforts to advance the full
capacity, bring early warning systems to change, is actively helping to boost participation of women in the energy
100m people and develop climate-smart synergies between lenders and to sector; support the regional
agriculture investment plans for at least standardise practices and climate development of the geothermal sector,
40 countries – all by 2020. These are related financing tools. AFD is in the and strengthen donor coordination in
among a number of ambitious targets the sector by maximising impact of
interventions.n
process of updating climate strategy
laid out in the group’s new Climate based on need to ensure that 30% of
products such as ethanol and carbon facility, set to be completed in late for NGOs to increase the resilience of
dioxide. As a result, Mauritius’ sugar 2016. people to extreme climate events in
industry has become increasingly selected countries in the Sahel and
efficient and sustainable, while The UK supports the Building sub-Saharan Africa. BRACED has a
creating local jobs, with 50 created in Resilience and Adaptation to Climate focus on creating resilient cities and
2015 alone. Omnicane’s 2015 loan is Extremes and Disasters Programme infrastructure and ensuring access to
intended for a ‘carbon burn-out’ (BRACED), which provides funding clean water, alongside its aims to
INFRASTRUCTURE FINANCING TRENDS IN AFRICA – 2015 | 19You can also read


