Infrastructure Strategy - Central Otago District Council 2018 2048
←
→
Page content transcription
If your browser does not render page correctly, please read the page content below

Central Otago District Council

Infrastructure Strategy
2018 - 2048

                                 Page 1
Issue Information
Issue Purpose                    Final
Issue Date                       7 March 2018
Version Number                   Incorporating Audit Feedback

Authorisation
Central Otago District Council
Prepared By                      Julie Muir
Reviewed By
Date                             7 March 2018
TABLE OF CONTENTS
1.0    EXECUTIVE SUMMARY ...............................................................................................1
2.0    INTRODUCTION ............................................................................................................3
2.1    Scope ............................................................................................................................ 3
3.0    OVERVIEW OF THE DISTRICT ....................................................................................4
3.1    Central Otago District Council ....................................................................................... 5
3.2    The Infrastructure Assets .............................................................................................. 5
4.0    STRATEGIC CONTEXT ................................................................................................6
4.1    National Policy Statement for Freshwater Management ............................................... 6
4.2    National Infrastructure Plan ........................................................................................... 6
4.3    Delivery of Services ....................................................................................................... 7
4.4    Sustainability ................................................................................................................. 7
5.0    COUNCIL’S INFRASTRUCTURE STRATEGY .............................................................9
5.1    Infrastructure Vision ...................................................................................................... 9
5.2    Overarching Principles .................................................................................................. 9
5.3    Asset Management Policy ........................................................................................... 10
6.0    INFRASTRUCTURE STRATEGIC OBJECTIVES ..................................................... 11
7.0    LEVELS OF SERVICE ................................................................................................ 14
8.0    DRIVERS OF DEMAND AND CHANGE .................................................................... 18
8.1    The Central Otago Economy ....................................................................................... 18
8.3    Population Growth ....................................................................................................... 19
8.4    Demographic Context .................................................................................................. 20
8.5    Subdivision Growth ..................................................................................................... 20
8.6    Affordability .................................................................................................................. 21
8.7    New Technologies ....................................................................................................... 21
8.8    Climate Change ........................................................................................................... 22
8.9    Infrastructure Resilience .............................................................................................. 24
9.0    DATA CONFIDENCE AND QUALITY ........................................................................ 25
9.1    Data Confidence .......................................................................................................... 25
9.2    Data Improvement Plan ............................................................................................... 28
10.0   KEY INFRASTRUCTURE ISSUES ............................................................................ 29
10.1   Treatment of Urban Water Supplies ............................................................................ 29
10.2   Treatment of Urban Wastewater Discharges .............................................................. 33
10.3   Increased Pedestrian, Cycle, And Traffic Demand Within Town Centres .................. 40
11.0   OTHER CHALLENGES .............................................................................................. 44
12.0   ACTIVITY SUMMARIES ............................................................................................. 45
12.1   Water ........................................................................................................................... 45
12.2   Wastewater.................................................................................................................. 54
12.3   Stormwater .................................................................................................................. 60
12.4   Roads and Footpaths .................................................................................................. 63
12.5   Summary of Significant Infrastructure Projects ........................................................... 70
13.0   COMBINED INFRASTRUCTURE FINANCIAL ESTIMATES .................................... 71
13.1   Financial Impacts of the Infrastructure Strategy.......................................................... 73
14.0   ASSUMPTIONS AND RISK........................................................................................ 74

TABLE OF TABLES
Table 1.0.1 Central Otago Population 2018…………………………………………………….4
Table 1.2.1 2016 replacement value for the infrastructure assets ………………………….5
Table 1.3.1 Central Otago projected population growth 2018 – 2048………………….…..20
Table 9.1.1 Data Confidence – Roading Assets …………………………………………...…26
Table 9.1.2 Data Confidence – Water Services Assets……………………………………..27
Table 9.2.1 Data Improvements……………………………………………………………..… 28
Table 1.1.1 Proposed timeline and cost estimates for water treatment upgrades………. 29
Table 1.1.2 Proposed timeline and revised cost estimates………………………… …..…..30
Table 1.2.1 Options for staging of Clyde Wastewater Scheme………………………….….35
Table 1.2.2    Short list of Options for Addressing Wastewater Discharges in Clyde…….. 39
Table 10.3.1 Options for the Clyde Historic Precinct…………………………………………42
Table 1.1.1    …………………………………………………………………………………..…..54
Table 1-2.1    …………………………………………………………………………………..…..60
Table 1-4.1    …………………………………………………………………………………..…..67
Table 14.1.1    ………………………………………………………………………………..……75

TABLE OF FIGURES
Figure 3.0.1    Overview of District……………………………………………………………….4
Figure 1.2.1 Plan of the proposed staging of the reticulation……………………………..…40
Figure 1.3.1   Clyde Precinct Concept Plan – Option 4………………………………….…...44
Figure 12.1.1 Drivers of Demand for 30 Year Water Capital Program……………….…….47
Figure 12.1.2 Projected Capital Expenditure – Water………………………………………..48
Figure 12.1.3 Projected Operational Expenditure – Water……………………………….….48
Figure 12.2.1 – Drivers of Demand for 30 Year Wastewater Capital Program……………..56
Figure 12.2.2 Projected Capital Expenditure – Wastewater…………………………………57
Figure 12.2.3 Projected Operational Expenditure – Wastewater……………………………57
Figure 12.3.1 Drivers of Demand for 30 Year Roads and Footpaths Capital Program…..62
Figure 12.3.2 Projected Capital Expenditure – Stormwater…………………………………63
Figure 12.3.3 Projected Operational Expenditure – Stormwater……………………………63
Figure 12.4.1 Drivers of Demand for 30 Year Roads and Footpaths Capital Program…..65
Figure 12.4.2 Projected Capital Expenditure – Roads and Footpaths……………………..66
Figure 12.4.3 Projected Operational Expenditure – Roads and Footpaths………………..66
Figure 12.5.1 Significant Infrastructure Projects……………………………………………..71
Figure 1.0.1 Projected Maintenance Expenditure –Infrastructure Assets………………....72
Figure 1.0.2 Projected Capital Expenditure –Infrastructure Assets………………………...73
1.0       Executive Summary
Infrastructure supports much of our daily lives – it is essential to health, safety, and for the
transport of both people and freight. It enables businesses and communities to flourish. Failure
to manage infrastructure appropriately and invest in it would inhibit the economic performance,
health, prosperity and sustainability of the District.

Infrastructure is a core part of what Central Otago District Council provides its communities – it
makes up the majority of the Council’s spending, and Council has almost $1 billion worth of
assets.

This Strategy outlines how Council will manage its assets for water, wastewater, stormwater
and roading. It identifies the investment that is required to meet the needs of our communities
for the next 30 years.

Council’s vision for Infrastructure Services recognises that the infrastructure that we build today
will provide service well beyond the 30 year window of this strategy. Our vision is:
“We will deliver safe and reliable infrastructure services that support our local economy and
communities, in a manner that is affordable, sustainable and equitable for current and future
generations.”

In 30 years’ time our District will be different. There will be more people, and a higher proportion
of our population will be retired. Technology will influence demand, the way we manage our
infrastructure, and how we respond to this demand. We will make greater use of green
technologies and renewable energy to deliver our services. Our climate is also expected to
change.

Projections indicate that on peak days in 2048 we will have 25% more people in the District
than we do in 2018. This growth will be concentrated in the Cromwell area, where there will be
35% more people on peak days. The peak population in the Vincent ward will have increased
by 20%. The resident population in areas around Clyde and Alexandra will have increased by
35%.

The resident population will be older, with 39% of the population 65 years of age, or older. The
proportion of our population aged between 15 and 64 years of age is projected to decline from
over 60% in 2018, to under 50% of our population in 2048. This may have a flow-on effect to
the make-up of the district’s work force.

Our water, wastewater and transport systems will need to be expanded to meet the demands
of an increase in population and urban area.

Our climate is predicted to be warmer, with less frost days, and hotter summers. Overall rainfall
will not change, but it will fall in less frequent, higher intensity events. Our bridges and
stormwater infrastructure will need to be built to cope with these events.

There is a higher likelihood of extreme snow events occurring during the winter. The amount
of water stored in the snowcaps however will reduce. This, combined with less frequent rain,
will affect how we manage water supply and demand in the future.

As our infrastructure is upgraded it will be built to be more resilient to natural hazards, such as
storms and earthquakes.

                                              Page 1
Technology will have changed the way we communicate what is happening on our networks.
It will enable us to manage more of our infrastructure remotely, and warn us of upcoming issues
and servicing needs. The vehicles we use for transportation will have a greater level of
automation, safety features, and use renewable energy.

Discharges from urban wastewater and stormwater networks will be treated to higher levels to
ensure there are no cumulative environmental effects. Our infrastructure will be operated more
sustainably with increased use of green technologies which use less energy.

This 30-year Infrastructure Strategy outlines the steps that Central Otago District Council is
taking to meet the challenges on its infrastructure for the future.

                                            Page 2
2.0 Introduction
This is Central Otago District Council’s second infrastructure strategy and has been prepared
to meet the requirements of section 101B of the Local Government Act 2002.
The purpose of the infrastructure strategy is prescribed by the Local Government Act. It must
identify the significant infrastructure issues for the Central Otago District for the next 30 years;
identify the principal options for managing those issues and the implications of those options.
In setting out how Council intends to manage its infrastructure assets, it must take into account
the need to -
renew or replace existing assets;
respond to growth or decline in the demand for services;
allow for planned increases or decreases in levels of service
maintain or improve public health and environmental outcomes or mitigate adverse
effects on them;
provide for the resilience of infrastructure assets by identifying and managing risks
relating to natural hazards and by making appropriate financial provision for those risks.
The infrastructure strategy provides the strategic framework for the more detailed activity
management plans. It is reviewed every three years, and is a guiding document for the Long
Term Plan.
The issues discussed reflect the current legislative environment and the communities’ priorities.
The financial forecasts are estimates and the reliability of the forecasts decreases beyond ten
years and towards the thirty year planning horizon.
2.1 Scope
The strategy covers the 30 year period of 2018 to 2047 and includes the following groups of
Council activities:
water supply:
sewerage and the treatment and disposal of sewage (wastewater)
stormwater drainage:
roads and footpaths
Central Otago District Council does not manage any flood protection and control works. The
Otago Regional Council manages these activities within the Central Otago area.
There are a number of private water supplies within Central Otago that are not managed by
Council. These water supplies are not included within the scope of this plan.
Page 3
3.0         Overview of the District
   Central Otago is New Zealand’s most inland region, located in the southern half of the South
   Island. It’s breathtakingly different from the rest of New Zealand, with vast undulating
   landscapes, rugged snow-capped mountains, clear blue rivers and lake, deep gorges and
   tussock-clad hills.

   Central Otago covers an area of 9969km2 and has one of the lowest population densities per
   square kilometre in New Zealand. This, together with the landscape, gives Central Otago its
   particular character.

   The community consists of a variety of small towns that offer a wide range of services. It is a
   popular holiday destination, and the population swells over the summer months.

                            2018 Usual Resident Population           2018 Peak Population

    Total District          20,460                                   35,741
    Alexandra               5200                                     8648
    Cromwell                5,070                                    8644
    Clyde                   1,140                                    2432
    Roxburgh                540                                      1135
    Ranfurly                680                                      1487
    Omakau and Ophir        340                                      854
    Naseby                  120                                      1,000
    Patearoa                80 (based on water connections)          240

   Table 3.0.1 Central Otago Population 2018

Figure 3.0.1
Overview of District

                                               Page 4
3.1       Central Otago District Council
The Central Otago District Council was formed in 1989, and amalgamated the Vincent County
Council, Cromwell Borough Council, Alexandra Borough Council, Maniototo County Council,
and part of the Tuapeka County Council.

The Council’s primary office is located in Alexandra, with service centres located in Ranfurly,
Roxburgh and Cromwell. Council employs 130 full time equivalents, and has an operating
revenue of $43 million.

The Council is lead by the Mayor, with 10 elected councillors. There are four community
boards: Vincent, Cromwell, Teviot Valley, and Maniototo.

Core infrastructure is funded and managed at a District wide level. Governance decisions are
delegated to the Roading Committee, and the Three Waters Committee.

Council also has an Audit and Risk Committee that consists of the Mayor, three Councillors,
and an independent representative as chair. The objective of the Audit and Risk Committee is
to provide governance and oversight to ensure systems and practices are of a standard to
provide assurance that there is sufficient risk identification and mitigation in place. The Audit
and Risk Committee provides feedback to Council on a broad range of matters, including
strategic management and operational performance.

3.2       The Infrastructure Assets
The 2016 replacement value for the infrastructure assets covered in this strategy is $764 million.
This is made up of nine water schemes, seven sewage schemes, and five reticulated storm
water schemes. There is 1,913 km of maintained roads, 167km of formed footpaths, and 177
bridges.

                                                                Replacement
 Asset          Description                                                        % of total
                                                                Value

 Water          Water extraction, treatment and distribution    $99 M              12%

                Wastewater     collection,   treatment    and
 Wastewater                                                     $81 M              11%
                discharge

 Stormwater     Stormwater collection and discharge             $37 M              5%

 Roads and
                Roads, bridges, footpaths and carparks          $547 M             72%
 footpaths

 TOTAL                                                          $764 M             100%

Table 3.2.1 2016 replacement value for the infrastructure assets

                                              Page 5
4.0 Strategic Context
There are a number of number of national policies and plans, and legislation which set the
scene for Council’s 30 year Infrastructure Strategy. This infrastructure strategy documents
Councils response to the direction provided by the National Policy Statement for Freshwater
Management, the National Infrastructure Plan, and the Local Government Act.
4.1 National Policy Statement for Freshwater Management
The National Policy Statement
for Freshwater Management
provides direction on how local
authorities should carry out
their responsibilities under the
Resource Management Act
1991 for managing fresh water.
This policy was amended on 7
August 2017 and requires
regional councils to improve
water quality and meet targets.
There are new requirements for
regional councils to follow when
managing the level of nutrients
– such as nitrogen and
phosphorus – which can get
into waterways. This requires
the consideration of cumulative
effects.
4.2 National Infrastructure Plan
The government's objective is that by 2045 New Zealand’s infrastructure should be resilient
and coordinated. It will also contribute to a strong economy and high living standards. This will
be achieved through better use of existing assets and better allocation of new investment, as
set out in the New Zealand Infrastructure Plan 2015.
The National Infrastructure Plan 2015 is the third National Infrastructure Plan released by
Government. This identifies the following challenges:
We have a number of aging infrastructure networks that will need renewing
Some of our regions will grow and others will shrink
Our population is also aging
At the same time, our lifestyles are changing
Technology is driving change everywhere.
We also face economic challenges
On top of these challenges, our climate is changing, and our natural resources are
under pressure
These challenges need to be met at a time when central and local government face
financial constraints.
Page 6The National Infrastructure Plan identifies that in light of the challenges, we need to make a
step-change in our approach to infrastructure planning and management. Simply building things
to address our problems is no longer sustainable.
There are three main elements to the response outlined in the National Infrastructure Plan.
a better understanding of the levels of service we want to deliver
more mature asset management practices
more effective decision-making that considers non-asset solutions
4.3 Delivery of Services
Section 17A of the Local Government Act requires Local Authorities to review the cost-
effectiveness of current arrangements for meeting the needs of communities for good-quality
local infrastructure, local public services, and performance of regulatory functions.
Central Otago will continue to work with other Otago Councils on investigating opportunities for
shared services. Council currently shares services for landfill and transfer stations with the
Queenstown Lakes District Council. We also work collaboratively with Queenstown Lakes
District Council in both the water services and roading areas on procurement, contract form,
and improving asset management.
4.4 Sustainability
The Ministry for the Environment identifies that to make New Zealand the most liveable place
in the world, we need our environment to prosper.
We are incredibly lucky to have a wealth of natural resources at our doorstep – good access to
water, productive land and a rich biodiversity. Over a thousand years, our culture, society and
our economy have been built on the back of our environment and, for many, it’s why they want
to live, work and visit here.
We need to care for and invest in our natural resources, understanding the consequences of
our decisions, and making wise choices that will benefit future generations.
A Sustainability Strategy has been developed and adopted by Central Otago District Council in
2018. The strategy builds on the Community Outcomes, and incorporates the United Nations
Sustainability Goals. The strategy refines Council’s focus on sustainability to issues it directly
controls in the first instance. This acknowledges that improvements can be made. By getting
our own house in order first, we can better lead the community in wider sustainability
discussions.
Page 7Page 8
5.0 Council’s Infrastructure Strategy
At a high level Council has Community Outcomes. These are:
Thriving Economy - A thriving Economy that is attractive to both businesses and
residents alike.
Sustainable Environment - This would be an environment that provides a good quality
of life. The community would also have a healthy balance between its natural and built
environment.
A Safe and Healthy Community - This would be a vibrant community with a range of
services and facilities. This would also be a community that valued and celebrated its
rich heritage.
The use of Community Outcomes on their own does not provide sufficient clarity regarding the
strategic direction Council intends to take to deliver services to the community.
To address this, Council has defined a vision, overarching principles, and a common level of
service framework for the provision of Infrastructure Services.
5.1 Infrastructure Vision
The vision for Infrastructure Services is:
We will deliver safe and reliable infrastructure services that support our
local economy and communities, in a manner that is affordable,
sustainable and equitable for current and future generations.
5.2 Overarching Principles
The vision is supported by five overarching principles. These underpin all decisions relating to
delivery of infrastructure services. The overarching principles are:
Infrastructure services will be delivered as part of an integrated district network and
should offer an increasingly consistent, fit for purpose level of service for users.
Value for money and whole of life cost will be considered to deliver affordable levels of
service.
Infrastructure services will be delivered in a manner which balances the current and
future impact on the environment, and makes use of sustainable practices.
We will look for new ways and innovative practices to enable us to cost effectively deliver
our services.
Our levels of service will meet legislative requirements.
Page 95.3 Asset Management Policy
The Asset Management Policy was last reviewed by Council in February 2014. The next review
will be undertaken in 2018.
Through effective asset management practices, Council aims to:
Ensure that service delivery and costs are appropriate to meet the needs of the
community.
Minimise lifecycle costs whilst maintaining the required service levels at acceptable risk.
Provide transparent and effective asset decision making.
Council expects asset management plans and practices to meet an intermediate level of
maturity for roads and footpaths, water, and wastewater, and core for stormwater.
Page 106.0 Infrastructure Strategic Objectives
Infrastructure services will be delivered as part of an integrated district
network and should offer an increasingly consistent, fit for purpose level
of service for users.
While our roading activities have been delivered as a district funded activity for the past twenty
years, our water services and footpaths were ward funded until 2015. This has resulted in
varying levels of service across the District for water, wastewater, and footpaths. In some
cases, options which provide best whole of life cost, or required outcomes, have not been
implemented due to the initial capital cost and affordability to ratepayers in smaller communities.
In 2015 Council made the decision to fund core infrastructure activities across all properties in
the District which receive these services, regardless of location. This means properties that
receive Council supplied water, wastewater, or stormwater service pay the same rates for these
activities. All properties pay for roads and footpaths.
The National One Network Road Classification framework and levels of service have been
applied across the roading network. A similar District wide level of service framework has been
implemented for the water, wastewater, and stormwater networks.
Value for money and whole of life cost will be considered to deliver
affordable levels of service.
Value for money and whole of life cost have been considered in delivery of roading
infrastructure since 2009. The adoption of District funding is resulting in a change to our
lifecycle management processes across the water and wastewater networks. This means
capital work is now targeted to the areas of need, rather than to the areas who can afford it.
Deterioration models which incorporate optimised decision making have been used in
investment forecasting for sealed roads since 2015. These will be extended to forecasting of
footpath, water and wastewater pipe renewals and investment need in 2021.
Advanced asset management tools require complete and accurate asset data to produce robust
outputs. The RAMM software, and NZTA performance measuring processes have been in
place for roading since 1996. These have been built on since 2009 to provide a high level of
asset and cost understanding to guide decision making in the roading area.
In the past three years Council has been investing in a new asset management system (Assetic)
for water services, as well as closed circuit television (CCTV) inspections of the wastewater
pipes, and laboratory sampling of water pipes. All water schemes and the Alexandra and
Cromwell wastewater schemes have been hydraulically modelled. The service provider for
hydraulic modelling has been changed to meet increasing demands from growth. Over the next
three years further investment will be made to refine understanding of the demands on, and
capacity of the existing water and wastewater networks.
Condition rating processes for water services assets will be aligned with those undertaken in
the roading area.
Page 11Infrastructure services will be delivered in a manner that balances the
current and future impact on the environment, and makes use of
sustainable practices.
Council adopted a Sustainability Strategy in 2018. The strategy focusses Council on activities
it controls in the first instance. By getting our own house in order we will be better able to lead
the Community in wider discussions in sustainability. The strategy recognises that Council
influences sustainability both in the manner in which services are provided to the community
and through the regulatory processes it applies.
An Environmental Engineering Team has been established in 2017 to provide focus and
resources to improving sustainable practises in the delivery of infrastructure. This includes an
increased emphasis on engineering and design practises used in subdivision development,
energy use, use of green technologies, and project design.
We will look for new ways and innovative practices to enable us to cost
effectively deliver our services.
Council implemented systems thinking in the Roading area in 2009. This resulted in
streamlining work practises and improved customer and cost efficiency outcomes. The
Roading contract is a shared risk, collaborative model that includes most of the physical work
undertaken on the network. This model has delivered value for money, innovative and efficient
practices, and is flexible to respond to growth and demand changes. The systems thinking
model encourages the use of evidence and data to support decision making.
While systems thinking was undertaken in the Water Services area, this was not sustained due
to contractor and staff changes. The existing water services contracts are traditional models,
which provide limited scope for change. Contract delivery options for water services will be
reviewed in 2019, and changes to responsibilities, processes and contract models considered.
Council has also adopted Treasury’s Better Business Case Model for consideration of key
infrastructure projects. This provides:
A compelling and clear justification for the proposed investment
An explicit and systematic basis for decision making which is documented and
presented in a common format
Transparency and accountability for the use of limited funding to achieve best value
A communication tool for engaging stakeholders and providing assurance that the
proposed programme optimises value for money compared to other organisational
priorities
A plan for achieving the expected benefits and for managing costs and risks.
Council is applying the Better Business Case process to a number of current infrastructure
projects.
Otago Councils are undertaking a joint review to identify collaboration opportunities for delivery
of services. This follows the requirements of Section 17A of the Local Government Act.
Page 12Our levels of service will meet legislative requirements.
Our 2015 Infrastructure Strategy identified six water supplies which required treatment
upgrades to meet the New Zealand Water Standards for treatment of protozoa. All Council
provided water supplies are chlorinated and meet the requirements for bacteria treatment.
Projects to address protozoa treatment were programmed to commence in 2026 with
construction of treatment for the Cromwell water supply. Treatment for Lake Dunstan (Clyde
and Alexandra) was programmed for 2027, Ranfurly and Patearoa for 2029, Naseby in 2030,
and Omakau in 2031.
Council was provided with a presentation from an environmental scientist in 2017 which
provided information on the background of the New Zealand Water Standards, and implications
and risks regarding treatment of public water supplies. As a result of the Havelock North
contamination event, and more detailed information regarding the risks of not treating for
protozoa and virus risk, Council is revisiting the proposed timing for upgrades to fully comply
with the current New Zealand Drinking Water Standards.
Page 137.0 Levels of Service
Council has set a common level of service framework for core infrastructure activities. Levels
of service are defined under five key customer outcomes. These are:
Reliability
Safety
Accessibility
Resilience
Aesthetics and comfort (Amenity)
In some cases improvements to levels of service require additional financial investment to
achieve improved outcomes.
In many cases customer experiences can be enhanced by improved planning and
communication. These are relatively low cost opportunities for improvements and are outlined
below.
RELIABILITY
This relates to the consistency of service that users can expect under normal operating
conditions, and managing the impact of planned interruptions.
Council will:
Provide increasingly consistent levels of service
Advise customers of interruptions to service, and when service will be restored
There is currently has no issues regarding reliability for the Council operated roading,
wastewater or stormwater networks.
A level of service issue exists for reliability of the Omakau Water Supply. This is placed on boil
water notices on a regular basis due to rain affecting turbidity of the Manuherikia River. A
project is underway in 2017 to address this and it is expected to be resolved in 2018.
High water pressure is an issue for residents in Roxburgh and Bannockburn. Low pressure is
an issue for residents in Omakau and Ophir. Pressure improvement projects are included in
the 30 year infrastructure strategy for Omakau, Ophir, Bannockburn and Roxburgh.
Page 14RESILIENCE
This objective relates to Council’s preparedness for emergency or weather events, and the
availability and restoration of service following an event. Resilience also includes provisions
for alternative supply or service, and public information.
Council will:
Ensure we are prepared for response to incidents and emergency events
Keep customers informed during events
Restore services as soon as circumstances allow
Provide alternatives when feasible
Carry out mitigation to avoid disruption for critical services where appropriate
Council staff participate in regular civil defence training and exercises, and Council is an active
member on the Otago Lifelines group. This group consists of essential service providers
including water, wastewater, electricity, telecommunications, fuel, fire, and health services.
Council will develop a network resilience plan for core infrastructure in 2018 that identifies areas
of vulnerability and criticality to natural events. This will include a monitoring regime and a list
of preventative actions required to address any shortcomings.
The plan will cover moderate and significant events. It will also include sites that are prone to
frequent closures from events. This will identify any work required to improve the robustness
of vulnerable assets and assess the cost of doing this work. Any work identified will be put
forward for consideration of funding through the 2021 Long Term Plan process.
Council has documented response plans for snow events, and water contamination events.
Other events rely on the local knowledge of staff and contractors. This has served Council well
during past events, but a more formal response plan is required to mitigate loss of institutional
knowledge.
An emergency response plan will be developed in 2018 for core infrastructure, that:
Reflects the breadth, scale, likelihood and consequence of an event
Reflects lifeline considerations
Identifies alternative provision for providing service
Details plans for prioritisation of restoration work and access, depending on asset
criticality.
Identifies typical resource availability within the district
Includes plans for essential services and for people to be prepared until access is
restored
Council sets aside $50,000 per annum in an emergency response fund for roading, and $70,000
per annum for below ground water and wastewater assets. This accumulates to provide funding
for reinstatement following emergency or extreme weather events.
Council has insurance for above ground water and wastewater assets. Below ground assets
are not insured. Council assumes that all below ground infrastructure would not be damaged
in a single event. For this reason we have a recovery fund, with the added ability to loan fund
reinstatement following an emergency event.
Page 15SAFETY
This requires managing the safety of the public and workers on our networks by adopting a risk
based approach. This includes reducing the likelihood of incidents occurring, and the
consequences if they do.
Council will:
maintain and operate our infrastructure in a safe condition
provide guidance on safe use and warn of hazards
adopt the appropriate level of risk for our services
This includes the health and safety of Council staff, and contractors, as well as public health
and the safety of users of our services and assets.
Safety on Central Otago local roads is comparatively good, with the number of serious and fatal
injury crashes on CODC local roads remaining at a low level despite increasing traffic on the
network. Crashes involving motorcycles and single vehicle loss of control crashes on open,
rural roads remain Central Otago’s key road safety issues.
For drinking water supplies, this includes compliance with the New Zealand Drinking Water
Standards.
Reviews of current Water Safety Plans for each scheme commenced in 2018.
The health and safety of council staff and contractors has been identified as a high risk in the
activity risk registers. Any contractor or consultant working for Council, or on Council managed
land is required to be Sitewise accredited, with a minimum score of 75%.
ACCESSIBILITY
Accessibility relates to the ability and ease of accessing our networks.
For roads this includes land accessibility, and access to roads for services and public events.
It also involves ensuring that our road surfaces are adequate to enable the required level of
access by different types of vehicles in most weather conditions.
Council has a road sub-classification called Tracks. Tracks are intended to provide dry weather
access between October and March. Changes to land use on these roads are resulting in
higher demand for access for a longer period, and with heavier vehicles.
Council has level of service failings for accessibility on approximately 5 % of the unsealed road
network (excluding Tracks) for about two weeks every year. This is due to a backlog of
gravelling, and in some cases the clay content of the gravel used.
The water, wastewater and stormwater networks have been designed to supply properties
within the designated supply areas. Council has hydraulic models for the existing water and
wastewater networks. The implications of future growth have been modelled for the Clyde and
Alexandra water networks, and work is underway on understanding the wastewater capacity
for growth in both towns.
Further work is required to understand if there are capacity limitations on the Cromwell water
supply.
Hydraulic modelling will also be undertaken throughout the District Plan review to ensure supply
implications are understood for zone changes.
Page 16AESTHETICS AND COMFORT
The roading network meets national standards and customer expectations for aesthetics and
comfort. This does require the maintenance grading programme to be carefully managed to
ensure a fit for purpose unsealed network is provided.
The 2017 Residents’ Survey specifically demonstrated customer dissatisfaction with water
quality and lime scale. Most of the respondents of the survey want to see progress on improved
water quality and supply, particularly Alexandra.
This relates to the look, taste, smell, and feel of our services, and the impacts they have on the
environment.
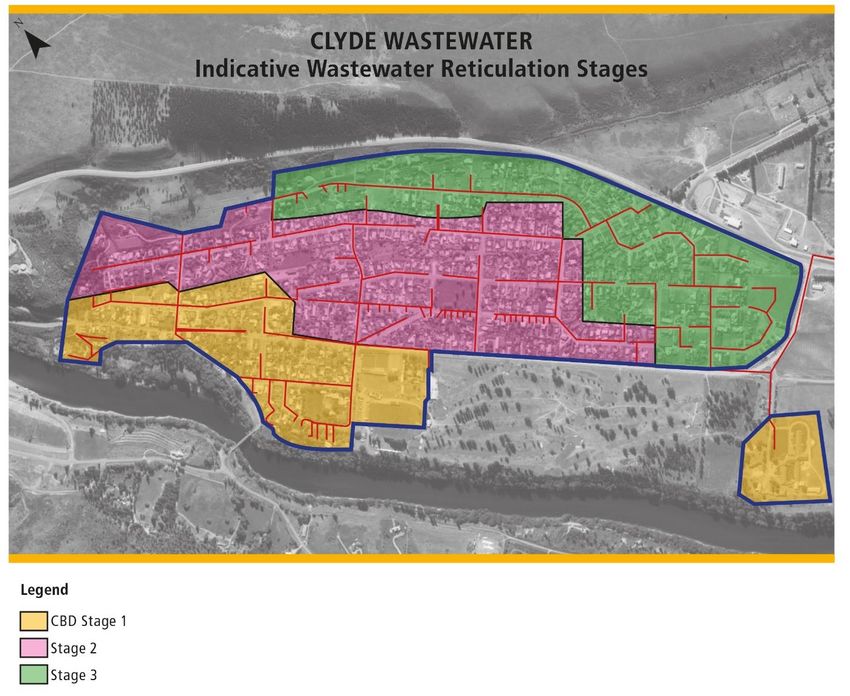
Clyde township does not have a wastewater network. High population and visitor numbers over
the summer is placing pressure on private systems on commercial properties in the historic
precinct. This generates odour issues.
Specific projects in the 30-year plan to address customer concerns are:
Lake Dunstan Water Supply, which will extend the Clyde water supply to Alexandra and
address lime scale concerns
Improved treatment of water at Omakau, Naseby, Ranfurly and Patearoa to improve
water aesthetics
Wastewater reticulation for Clyde township
Page 178.0 Drivers of Demand and Change
8.1 The Central Otago Economy
Business and Economic Research Ltd (BERL) March 2016 report stated the Central Otago
growth in employment and gross domestic product (GDP) to March 2015 was "phenomenal".
During this time, GDP increased 8.4 per cent, GDP per capita increased by 6.4 per cent, and
employment grew 7.7 per cent.
Over the last ten years the district averaged annual GDP growth of 2.1%.
The Central Otago economy is anchored in the primary sector, with construction, tourism,
hydroelectricity, and professional services other significant contributors. Traditional sheep and
beef industries are strong; we have a growing dairy industry, and thriving horticultural sector.
Stone fruit, viticulture and apples are key horticultural growth areas.
Construction is the second largest sector and is currently driven by high demand for housing
and industrial premises in both Central Otago and the neighbouring Queenstown Lakes area.
Manufacturing is dominated by the wine industry, which is predominantly located within the
Cromwell and Vincent areas.
The professional, scientific, and technical sector is developing. Improved communication
infrastructure and air services from Queenstown and Dunedin are enabling providers to service
national and international clients while opting for the Central Otago lifestyle. Almost a quarter
of Central Otago workers are self-employed, which is significantly higher than the national
average.
The value of tourism in Central Otago has grown in 24% in a four year period from $145 million
in 2012 to $181 million in 2016. This is lower than the national average (+37%) and
neighbouring regions such as Queenstown (+70%), Wanaka (+63%), and Dunedin (+28%).
International visitors are expected to continue to increase significantly on the back of national
marketing initiatives to get more tourists into the regions. Central Otago is implementing a new
Tourism Strategy to leverage off national initiatives, and encourage international visitors from
Queenstown to spend time in Central Otago. The Central Otago Touring route is one local
initiative to support this.
Page 188.3 Population Growth
Central Otago has experienced a decade of exceptional population growth. Between the 2001
and 2013 censuses the resident population grew by 25.4% from 14,750 to 18,500.
Council’s growth model uses the Statistics New Zealand population projections as the basis for
forecasting growth in the district. Information on visitor numbers is also used from Qrious. This
is a company which utilises anonymous mobile location data to identify visitors to the district,
where they spend their time, and where they come from.
Three growth scenarios have been modelled. The medium growth scenario has been used for
Council’s long term planning as this:
provides realistic projections that are conservatively optimistic. It is considered a better
reflection of historical trends and the current economic climate.
is close to historical trends of a steadily growing population but also reflects that recent
high growth may not be sustainable over the long term.
is informed by Statistics New Zealand’s medium population series. Which is considered
to be the most appropriate to assess future population changes.
The high growth scenario is considered to be too aspirational, and may lead to overstating the
growth in the long term. Similarly, the low growth scenario is more of a worst-case scenario.
While this provides a useful perspective, it is not considered appropriate for long term planning
purposes.
Under the medium growth scenario, population growth is forecast to continue for the next 30
years. Central Otago’s growth is influenced largely by increasing demand in the Queenstown
area, and the relative affordability of property in Central Otago relative to Queenstown. In
addition to the growth from Queenstown, there is a strong local economy with many people
moving to the District for work and business opportunities.
The influence of demand from the Queenstown Lakes area is reflected in terms of the
geographic spread of population growth in Central Otago. The fastest rate of growth has been
experienced in the Cromwell ward, where the population has increased between the 2001 and
2013 censuses by 73%. The Vincent Ward, which includes Alexandra, Clyde, Omakau and
Ophir, grew 15%.
The Cromwell area is projected to continue to experience the highest population growth,
followed by the Vincent area. The population is forecast to remain static in the Maniototo area,
and decline very slightly in the Teviot area. The dwelling and rating unit growth is still positive
in Maniototo and Teviot.
Page 192018 Usual Resident 2018 Peak 2048 Usual Resident 2048 Peak
Population Population Population Population
Vincent 9,534 15,823 10,707 19,128
Cromwell 7,488 12,221 9,866 16,516
Maniototo 1,798 4,649 1,818 5,616
Teviot Valley 1,640 3,048 1,500 3,388
Table 8.3.1 Central Otago projected population growth 2018 - 2048
8.4 Demographic Context
The District has a significantly higher proportion of older residents compared to the rest of New
Zealand. Projected change in the District’s population indicate the proportion of people aged
65+ will increase from the present 21% to over 30% by 2028 to become the dominant
demographic.
An older population will affect both the demands on our infrastructure and the availability of
rates funding in the long-term. An older demographic requires higher levels of service for
footpaths and infrastructure that supports accessibility for people with restricted mobility.
We have implemented an innovative method for measuring the level of service on our footpaths.
This uses a phone based application that is mounted on a mobility scooter. This records a
roughness of the footpath over 5m intervals. This information is mapped, and is used to
prioritise work programmes. This ensures that the work programmes are targeted to actual
customer experience on the network.
The importance of meeting the New Zealand Drinking Water Standards will increase as our
population ages. An older population is more vulnerable to drinking water contamination.
The reduction in the number of people aged between 15 and 64 years of age in our community
is likely to result in shortages of staff for the workforce. Innovative, streamlined work processes,
targeted work programmes, and increasing use of technology will continue to be implemented
to help limit the impact of a reduced workforce and labour shortages.
8.5 Subdivision Growth
Central Otago District Council has experienced consistent subdivision growth over the last 15
years. The District is currently experiencing another unprecedented urban growth peak.
There is currently no remaining urban-zoned land available for development in Clyde, and very
little in Cromwell and Alexandra. The lack of available land in Cromwell, Clyde and Alexandra
is impacting on property prices. This is resulting in increased demand in Omakau and Roxburgh
where property prices are more affordable.
This has resulted in a number of private plan changes being implemented. The outcome of this
is that forecasting of growth areas and the subsequent infrastructure impacts is difficult.
Page 20The District Plan is currently under review, and this will include provision of sufficient zoned
land to meet the expected demand for the next 20 years. This work is still at an early stage,
and has not been able to be used for infrastructure modelling for the 2018 Activity Management
Plans.
Council has not historically made financial provisions in forward plans for anticipated increases
in asset base as a result of subdivisions. This has largely been accommodated within the
existing operational budgets, with depreciation being recalculated annually. The duration and
extent of subdivision growth and tightening of renewal budgets means that this is no longer
viable.
Some analysis has now been undertaken of historical growth in dwelling units and the impacts
this has had on vesting of new roads in Council. Analysis of historic dwelling increases and the
associated subdivision growth indicates an average of 850m of new urban street will be vested
in Council every year to meet the current growth projections for dwellings. Further analysis is
required to understand the asset implications of subdivision growth on the water services
assets. This will be included in the financial forecasts in the 2021 plan.
8.6 Affordability
Central Otago’s relatively small and disperse population can put pressure on the affordability
of providing and improving our infrastructure. At the same time Council must also meet the
challenge of accommodating growth and funding essential improvements for the safety and
wellbeing of our community.
The average annual earnings in Central Otago in 2016 was $46,810, which is 18% less than
the New Zealand average of $57,780. Our ratepayers’ ability to absorb rate rises will be
affected as an increasing proportion of our residents become over 65 years of age and
potentially on fixed incomes.
Ensuring our levels of service are fit for purpose, and considering new ways and innovative
practices to deliver cost effective services is a key part of our Infrastructure Strategy.
We are applying for and accessing government funding where possible to help fund the effects
of tourism growth and improved environmental outcomes.
Capital improvement projects in our 30 year programme have been spread across a longer
timeframe to spread the cost impacts of this work, and keep our programme affordable. Council
will use loan funding to spread the cost of large capital projects over a longer period.
8.7 New Technologies
Central Otago District Council has embraced technology and it is widely used for quick
notification of events such as road conditions and disruptions to service. This technology is
also widely used for managing the water, wastewater and roading networks.
Electric vehicle charge stations are being installed across the network. These are often located
on Council land, but are funded by commercial providers.
The introduction of autonomous (driverless) vehicles will have a significant impact on the way
travel is undertaken in the future. For the purposes of this strategy we have assumed that
vehicle ownership will continue in rural areas. We expect autonomous vehicles to result in
substantial reductions in road crashes and associated deaths and injuries in the longer term.
Page 21While we recognise that change is coming, no specific provisions have been made in our plans
for the introduction of autonomous vehicles. Council will monitor the impacts of this technology
on larger metropolitan areas to guide future planning.
The development of technology which provides improved data for decision making is rapidly
advancing. This technology is being incorporated into Council’s operational activities where
appropriate. It is being used to mitigate risk, and to provide data for hydraulic and asset
deterioration modelling. It is also used to provide early notification of issues with plant, and
weather conditions.
8.8 Climate Change
Central Otago District Council has commissioned a report of climate change impacts on the
Central Otago District. This was prepared by Bodeker Scientific, and is titled “The Past,
Present, and Future Climate of Central Otago: Implications for the District. This includes the
scenario under the worst case or highest warming scenario, as well as the implications this may
have for the district. The worst case scenario is based on no behaviour change occurring to
lessen the impacts of climate change.
It provides a common base for long term planning across Council activity areas. The Central
Otago District is predicted to warm by several degrees by the end of the century. Total
precipitation is not projected to change much in the district, however; the distribution and
intensity of rainfall is likely to alter, with a greater likelihood of more extreme rainfall events.
The total snow volume that builds up and melts in the main ranges is projected to reduce
significantly by the end of the century, as a direct result of warming temperatures. Under the
worst case scenario the district could expect following by the end of the century:
Page 22 On average, about 30 fewer frost days per annum - a reduction of almost half
Around 35-55 more hot days per annum (maximum temperature above 25° C) - about
double the current number
An increase in average maximum temperature of 3.5 - 4.5°C
An increase in drought risk arising from higher temperatures and altered precipitation
patterns.
Snow storage will reduce considerably and in the worst case there would be very little
snow storage remaining by the end of the century. Where snow remains; snow-melt will
occur earlier leading to a significant reduction in the volume of water from snow storage
available through the spring melt season.
Precipitation that would have been stored in the snowpack will instead fall as rain and
contribute more immediately to river flows and lake levels.
The potential impacts of these climate changes for infrastructure include:
Higher intensity extreme rainfall events may lead to increased likelihood of landslides
and flooding, asset damage, asset failure, or reduced asset capacity
Events during winter may result in very high snowfall - with implications for road
availability and management
Increased heat stress from heatwaves, will affect the workforce during summer
Increased temperatures, combined with drought conditions, heighten the risk associated
with wildfire. This will increase the importance of vegetation management and impact
on when work can be undertaken due to the risk of causing a fire.
Higher summer temperatures may affect construction and cause heat damage to
bitumen
A reduction in the number of winter frost days is likely to see a reduced hazard from ice
on our roads and freeze thaw issues on unsealed roads.
Flood events caused by extreme rainfall, snowfall or snowmelt runoff may increase the
potential for greater damage to bridges and road approaches.
Council’s response to climate change for its infrastructure services is:
To incorporate consideration of climate change into design of future renewals and
network improvements. This includes considering change in demand, and resilience
due to climate change implications.
To ensure that water improvement projects include the ability to increase capacity in the
future. This could be through the future provision of additional bores, booster pumps
and additional reservoir capacity.
Upgrading of water treatment to withstand high turbidity caused by flood events
That bridges and stormwater systems are designed to accommodate extreme weather
events, or provide for secondary flow paths.
Preparation of stormwater catchment plans for urban areas.
Complete stormwater infiltration testing of the wastewater network.
Preparation of resilience plans for infrastructure, and documenting emergency response
procedures and plans.
Continuing with existing management procedures for maintenance activities during high
fire risk periods, and health and safety requirements for staff working outside during high
temperatures.
Review of Central Otago subdivision standards for stormwater management.
Page 23You can also read