Inhalable Microorganisms in Beijing's PM2.5 and PM10 Pollutants during a Severe Smog Event
←
→
Page content transcription
If your browser does not render page correctly, please read the page content below
Article

                                                                                                                                              pubs.acs.org/est
                                                                                                                                                  Terms of Use

Inhalable Microorganisms in Beijing’s PM2.5 and PM10 Pollutants
during a Severe Smog Event
Chen Cao,†,‡,§ Wenjun Jiang,†,‡,▽ Buying Wang,∥,⊥,▽ Jianhuo Fang,# Jidong Lang,# Geng Tian,#,*
Jingkun Jiang,∥,⊥,* and Ting F. Zhu†,‡,*
†
 PTN (Peking University-Tsinghua University-National Institute of Biological Sciences) Joint Graduate Program, Center for
 Synthetic and Systems Biology, TNLIST, MOE Key Laboratory of Bioinformatics, School of Life Sciences, Tsinghua University,
 Beijing 100084, People’s Republic of China
‡
 Collaborative Innovation Center for Diagnosis and Treatment of Infectious Diseases, Hangzhou 310003, People’s Republic of China
§
 Graduate program in School of Life Science, Peking University, Beijing 100871, People’s Republic of China
∥
  State Key Joint Laboratory of Environment Simulation and Pollution Control, School of Environment, Tsinghua University, Beijing
 100084, People’s Republic of China
⊥
  State Environmental Protection Key Laboratory of Sources and Control of Air Pollution Complex, Beijing 100084, People’s
 Republic of China
#
 Center of Biomedical Analysis, School of Life Sciences, Tsinghua University, Beijing 100084, People’s Republic of China
    *
    S Supporting Information

    ABSTRACT: Particulate matter (PM) air pollution poses a formidable public health threat to the city of Beijing. Among the
    various hazards of PM pollutants, microorganisms in PM2.5 and PM10 are thought to be responsible for various allergies and for
    the spread of respiratory diseases. While the physical and chemical properties of PM pollutants have been extensively studied,
    much less is known about the inhalable microorganisms. Most existing data on airborne microbial communities using 16S or 18S
    rRNA gene sequencing to categorize bacteria or fungi into the family or genus levels do not provide information on their
    allergenic and pathogenic potentials. Here we employed metagenomic methods to analyze the microbial composition of Beijing’s
    PM pollutants during a severe January smog event. We show that with sufficient sequencing depth, airborne microbes including
    bacteria, archaea, fungi, and dsDNA viruses can be identified at the species level. Our results suggested that the majority of the
    inhalable microorganisms were soil-associated and nonpathogenic to human. Nevertheless, the sequences of several respiratory
    microbial allergens and pathogens were identified and their relative abundance appeared to have increased with increased
    concentrations of PM pollution. Our findings may serve as an important reference for environmental scientists, health workers,
    and city planners.

■    INTRODUCTION
As an international megacity with a population of over 20
                                                                            when inhaled, coarse particles (PM2.5−10) deposit primarily in
                                                                            the head airways, while fine particles (PM2.5) are more likely to
million, Beijing has been suffering from frequent smog events in             penetrate and deposit deeper in the tracheobronchial and
recent years.1−5 Since the official daily monitoring data became
available in 1999, particulate matter has been shown to be a                alveolar regions.6 Historical data suggest that exposure to such
major air pollutant in Beijing,1 and its impact to the public
health may be profound.1,4 Categorized by PM2.5 and PM10                    Received:    October 30, 2013
(particulate matter with nominal mean aerodynamic diameters                 Revised:     January 13, 2014
of ≤2.5 and ≤10 μm, respectively), PM pollutants of different                Accepted:    January 13, 2014
sizes deposit and affect different regions of the respiratory tract:          Published:   January 23, 2014

                              © 2014 American Chemical Society       1499                  dx.doi.org/10.1021/es4048472 | Environ. Sci. Technol. 2014, 48, 1499−1507
Environmental Science & Technology                                                                                                                     Article

atmospheric particulate matter is linked to increases in                    next day) per sampling day from January 8 to January 14
morbidity and mortality, and decreases in life expectancy.7,8               (including January 8 as a nonsmog control, according to the
   During the period of January 10−14, 2013, the city of                    Chinese Class II Standard), resulting in approximately 1559 m3
Beijing, along with the rest of the mideastern region of China              of air flow-through per sampling day. Particulate matter with
experienced a massive, severe smog event.2 The highest daily                aerodynamic diameters of ≤2.5 and ≤10 μm were collected on
average PM2.5 concentration in Beijing measured greater than                20.32 × 25.4 cm2 Tissuquartz filters (PALL, NY, U.S.) with
500 μg/m3 at times (20-fold higher than the WHO guideline                   99.9% typical aerosol retention. All the filters were sterilized by
value), raising serious public health concerns. Wide-spread                 baking in a Muffle furnace at 500 °C for 5 h prior to sampling.
respiratory irritation symptoms (e.g., “Beijing cough”) and                 Each sterilized filter was packaged in sterilized aluminum foil
significant increases of outpatient cases related to respiratory             and stored in a sealed bag until being loaded into the filter
diseases have been reported.2 Here we asked the question of                 cartridge. The filter holder and all the tools used for changing
what microorganisms, particularly inhalable allergens and                   new filters were cleaned with 75% ethanol or autoclaved every
pathogens, are in Beijing’s PM2.5 and PM10 pollutants and                   day to avoid contamination. The net weight of each filter was
what potential effects they may have on the public health                    recorded at mg accuracy before and after sampling. The
during severe smog events like this.                                        concentrations of PM2.5 and PM10 at our sampling site were
   The public health effects of PM, particularly those of PM2.5,             estimated by the net weight of each sample (average weight of
have been well documented in the literature.9,10 While the                  the two PM2.5 samples) divided by the 23 h flow-through
physical and chemical properties of PM2.5 and PM10 pollutants               volume per sampling day (to avoid microbial contamination,
have been extensively studied, relatively less is known about               samples were not kept under 45% relative humidity at 20 °C as
inhalable biological particles such as bacteria, fungi, viruses,            typically required for PM measurements). A 47 mm diameter
pollens, and cell debris in the micrometer to submicrometer                 filter punch was taken from the PM10 sample and one of the
size range. It has been suggested that materials of biological              PM2.5 samples each day for chemical component and elemental
origin may contribute as much as 25% to the atmospheric                     analyses. The filter punches were kept in size adaptive
aerosol,11 and they are responsible for various diseases and                chambers and stored at −20 °C. All other samples were stored
allergies. The abundance of airborne bacteria measured from                 at −80 °C until downstream analyses were performed.
104 to 106 cells per m3, depending on the environment.12 While                 DNA Extraction. To overcome the issue of low yield during
culture-based methods have been used to detect airborne                     genomic DNA extraction, several technical improvements were
microorganisms,13 they are constrained to the identification of a            made to optimize the extraction of high-quality DNA from PM
limited number of cultivatable species. Although the use of                 samples. Considering the different DNA yield of PM2.5 and
amplicon-based (e.g., 16S or 18S ribosomal RNA (rRNA)                       PM10 samples, 1/4 of PM10 filter (a total of ∼103.04 cm2) and
gene) sequencing and related techniques have allowed us to                  1 and 3/4 of the PM2.5 filters (a total of ∼721.28 cm2) from
detect both cultivatable and noncultivatable microorganisms                 each sampling day were used for DNA extraction. The filters
(although DNA from cell debris may also be detected) and                    were cut into 8.96 ×11.5 cm2 pieces and were placed in 50 mL
categorize the microbial populations in airborne par-                       centrifuge tubes filled with sterilized 1X PBS buffer. The PM
ticles,12,14−17 it has been challenging to sequence the fine,                samples were then pelleted at 4 °C by centrifugation at 200g for
inhalable PM2.5 samples (which are more relevant to human                   2 h. After gentle vortexing, the resuspension was filtered with a
health) due to the low DNA yield, unless with amplification of               0.2 μm Supor 200 PES Membrane Disc Filter (PALL, NY,
the extracted DNA.18 Yet amplicon-based sequencing methods                  U.S.), which was then cut into small pieces and used for DNA
often result in biases,19 and most importantly, they are generally          extraction using the MO-BIO PowerSoil DNA isolation kit
limited to categorizing bacteria or fungi at the family or genus            (Carlsbad, CA, U.S.). All the steps mentioned above were
level (without the use of marker genes).16,20 Because microbial             carried out in a clean bench. Scissors, forceps, and filter funnels
species within the same family or genus may differ significantly              were all sterilized before use. The samples were then heated to
in pathogenic potential, the discovery of microbial allergens and           65 °C in PowerBead Tubes for 10 min followed by vortexing
pathogens requires the identification of bacteria, fungi, and                for 2 min. The remaining steps of the extraction were
viruses at the species or even strain level.21 Thus, microbial              performed according to the standard MO-BIO PowerSoil
metagenomic sequencing represents a powerful alternative for                DNA isolation protocol except for the column purification step,
studying complex microbial communities,22 particularly for its              which was replaced with magnetic bead purification (Agencourt
ability to discover clinically relevant microbes at the species             AMPure XP, Beckman, CA, U.S.) for improved yield. Genomic
level.23

■
                                                                            DNA quality and concentration were analyzed by gel
                                                                            electrophoresis and a fluorescent dsDNA-binding dye assay
    MATERIALS AND METHODS                                                   (Qubit Fluorometer, Life Technologies, CA, U.S.). Blank
   Particulate Matter Collection. PM2.5 and PM10 samples                    control samples were collected by placing a sterilized filter
were collected from the roof top of the Environmental Science               inside of the sampler without operation for 23 h, and treated
Building (40°0′17″N, 116°19′34″E, ∼10 m above the ground,                   similarly as above. DNA extraction of blank control samples
∼20 m and ∼690 m from the nearest river and hospital,                       resulted in DNA concentrations below the detection limit of
respectively) at Tsinghua University, an area without major                 our instruments, and library generation efforts failed to generate
pollution sources nearby. This site has been used to monitor                useable sequencing libraries. All the extracted DNA samples
PM2.5 pollution in Beijing since 1999.24−26 Sampling was                    were stored at −80 °C until further use.
conducted by three high volume air samplers (Thermo                            Sequencing and Phylogenetic Analysis. The Illumina
Electron Corp., MA, U.S.), two of which were equipped with                  MiSeq (for library validation) and HiSeq 2000 sequencing
PM2.5 fractionating inlets, the third one being equipped with a             systems (Illumina, CA, U.S.) were used for sequencing, and the
PM10 fractionating inlet. Ambient air was drawn at an average               library preparation kits were purchased from New England
flow rate of 1.13 m3/min for 23 h (10:00 AM to 9:00 AM the                   Biolabs (MA, U.S.). Sequencing library construction and
                                                                     1500                 dx.doi.org/10.1021/es4048472 | Environ. Sci. Technol. 2014, 48, 1499−1507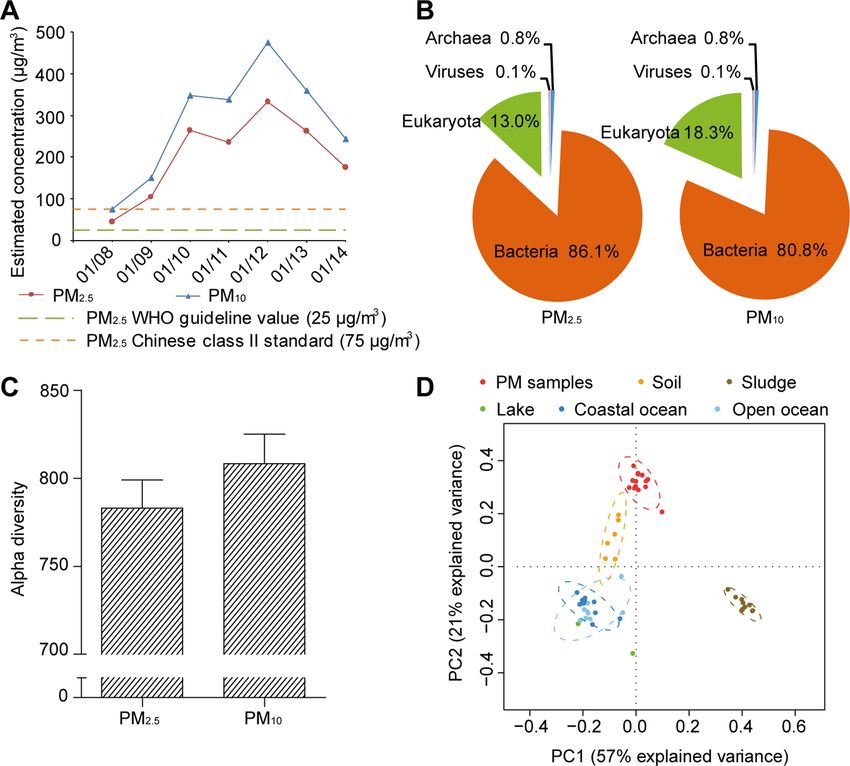
Environmental Science & Technology                                                                                                                      Article

Figure 1. Characteristics of the collected PM samples and sequenced metagenomes. (A) Daily average PM2.5 and PM10 concentrations estimated
from the collected samples during January 8−14, 2013. (B) Relative abundance of the MG-RAST taxonomic hits at the domain level in PM2.5 and
PM10 samples. (C) Estimated average alpha diversity of the PM2.5 and PM10 samples (error bars represent SD of the 7 daily PM2.5 and 7 PM10
samples, respectively). (D) Principal component analysis of the relative abundance of microorganisms at the phylum level of the 14 sequenced PM
metagenomes (red) compared to those of other environments (other colors).

template preparation were performed according to the NEB                    Genome coverage was calculated using the SOAP.coverage
library preparation protocols. We constructed a paired-end                  package (version 2.7.7). Only uniquely aligned reads were used
library with insert size of ∼500 bp for each sample. An aliquot             in the analysis. Bacterial, fungal, and viral species with coverage
of 5 ng DNA from each sample was used as the starting amount                of ≥5%, ≥0.5% (average alignment of all chromosomes), and
(except for 3 samples, the total quantities of DNA of which                 ≥1%, respectively, in either PM2.5 or PM10 samples of 7
were less than 5 ng, Supporting Information (SI), Table S1) for             consecutive sampling days were listed in SI Table S2. The
library preparation in order to ensure sample consistency. In
                                                                            genome-size-normalized relative abundance of these species
order to minimize possible bias introduced by PCR, 12 cycles
                                                                            was calculated based on the number of aligned reads
were performed during PCR amplification. Each sample was
barcoded and equal quantities of barcoded libraries were used               normalized by the species’ genome size (SI Figure S4 and
for sequencing (for index sequences, see SI Table S1). Adaptor              Table S3). The variations of the hit abundance of species across
contamination and low-quality reads were discarded from the                 7 sampling days were estimated based on the hit numbers
raw data. In total, ∼98 Gb sequence with a uniform read length              normalized by number of total aligned reads (SI Figure S5).
of 90 bp was obtained and an average of ∼7 Gb high-quality                  The Greengenes 16S rRNA gene database30 was used for 16S
HiSeq sequences were generated from each sample (SI Table                   rRNA phylogenetic analysis with the following alignment
S1). The rarefaction curve (analyzed by the Metagenomics                    parameters: >97% identity, minimal alignment 40 bp. DNA
RAST server (MG-RAST, release 3.3))27 suggested that the                    sequence data have been deposited in MG-RAST (http://
sequencing depth of the HiSeq data was sufficient to capture                  metagenomics.anl.gov/) at the following URL: http://
most of the microorganisms but not the MiSeq data (average                  metagenomics.anl.gov/linkin.cgi?project=3756.
data set of 683Mb) (SI Figure S1). MetaPhlAn (Metagenomic                      Analysis of Original Bacteria Habitats. The Greengenes
Phylogenetic Analysis)28 was used to estimate the relative                  16S rRNA gene database30 was used for assigning the HiSeq
abundance of bacteria and archaea with unique clade-specific
                                                                            reads at >97% identity threshold (only uniquely aligned reads
genes at the species level (SI Figures S2 and S3). The Illumina
HiSeq reads were aligned to a cohort of nonredundant NCBI                   were used for following calculations). All of the Greengenes
complete genomes (2637 complete genomes, including                          database sequences with available information of bacteria
bacteria, fungi, archaea, and viruses) using the Short                      habitats were classified into the four categories without
Oligonucleotide Analysis Package (SOAP) alignment tool                      overlaps. In addition, the 16S sequences of previous studies
(release 2.21t)29 to profile the common core species. We                     on high-altitude16 and urban airborne bacteria of Milan14 and
used a 90% identity threshold for bacteria, archaea, and fungi,             New York17 were assigned to the same habitat categories and
and 100% identity for viruses due to their smaller genome sizes.            compared to our results (SI Figure S6).
                                                                     1501                  dx.doi.org/10.1021/es4048472 | Environ. Sci. Technol. 2014, 48, 1499−1507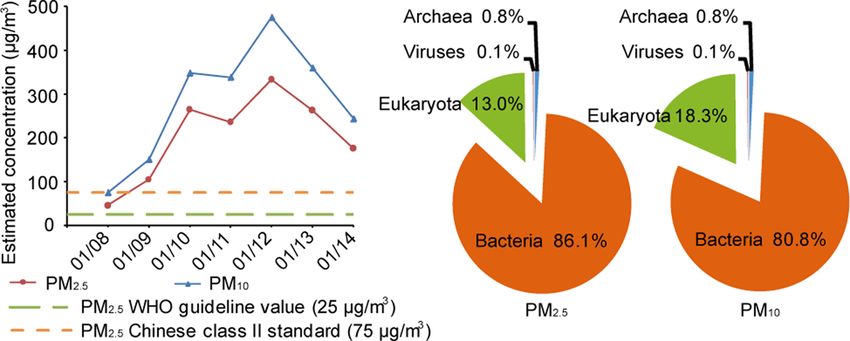
Environmental Science & Technology                                                                                                                        Article

Figure 2. Bacterial and archaeal species in PM samples and their original habitats. (A) Phylogenetic tree of the bacteria and archaea identified from
PM2.5 samples, analyzed by MetaPhlAn. The sizes of the nodes correspond to the relative abundance at the corresponding levels in the cohort. The
family, genus, and species levels of the most abundant order Actinomycetales are plotted. Only nodes with ≥1% relative abundance are labeled. (B)
Original habitats of the identified bacteria in daily PM2.5 and PM10 samples, categorized by terrestrial, fecal, freshwater, and marine sources. (C)
Bacterial and archaeal species in Beijing's PM samples were pooled and compared with those identified from the GRIP high-altitude, Milan urban,
and New York subway studies.

■   RESULTS
   Sequence of the Airborne Metagenome. We sought to
                                                                              Materials and Methods). PM2.5 and PM10 samples collected at a
                                                                              Beijing Tsinghua PM monitoring site (40°0′17″N,
sequence the metagenome of inhalable airborne microorgan-                     116°19′34″E) from January 8−14, 2013, during which period
isms in Beijing’s PM2.5 and PM10 pollutants, after having                     Beijing’s PM2.5 and PM10 pollution indexes rapidly deteriorated
overcome the technical issues involved in high-volume PM2.5                   from healthy to record-high hazardous levels, were used for
and PM10 sample collection, DNA extraction, and library                       sequencing (Figure 1A, SI Figures S7−S9 and Table S4; air
generation (for details of the DNA extraction methods, see                    temperatures are typically low in January in Beijing, creating a
                                                                       1502                  dx.doi.org/10.1021/es4048472 | Environ. Sci. Technol. 2014, 48, 1499−1507
Environmental Science & Technology Article
Figure 3. Box plot of the daily variations of the relative abundance of 48 most common bacterial, 2 fungal, and 3 viral species in PM samples. Boxes
correspond to the interquartile range between the 25th and 75th percentiles, and the central lines represent the 50th percentile. Whiskers correspond
to the lowest and highest values no more than 1.5 times the interquartile range from the box, while dots are the outliers beyond the whiskers. PM2.5
samples are labeled pink and PM10 are black.
unique high PM, low temperature environment). The Illumina Bacteria Were the Most Abundant Airborne Prokary-
HiSeq data from a total of 7 daily PM2.5 and 7 PM10 samples is otic Microorganisms and the Majority of Them Were
more than 1000-fold larger than those of three previous studies Terrestrial-Related. Bacteria appeared to be the most
on airborne bacteria combined,14,16,17 from which original abundant prokaryotic microorganisms in PM2.5 and PM10
sequence data were publicly available (SI Table S1). By aligning pollutants. To identify the prokaryotic species and to estimate
to the Greengenes 16S rRNA gene database30 at a 97% identity their relative abundance, we used the Metagenomic Phyloge-
threshold, we discovered 255 more bacteria genera than those netic Analysis (MetaPhlAn) toolbox28 to reveal a picture of
identified by the three previous studies (SI Figure S10 and complex bacteria and archaea community (Figure 2A and SI
Table S5). Overall, the PM2.5 samples contained 86.1% Figure S2). We show that the most abundant phyla were
bacterial, 13.0% eukaryotic, 0.8% archaeal, and 0.1% viral Actinobacteria, Proteobacteria, Chloroflexi, Firmicutes, Bacter-
reads, while the PM10 samples contained 80.8% bacterial, 18.3% oidetes, and Euryarchaeota (relative abundance ≥1%). At the
eukaryotic, 0.8% archaeal, and 0.1% viral reads (Figure 1B). species level, 1315 distinct bacterial and archaeal species were
The higher relative abundance of eukaryotic reads (which identified from the 14 samples. An unclassified bacterium in the
included those from fungi, plants, algae, and animal debris), as nitrogen fixing, filamentous bacteria genus Frankia appeared to
well as the higher alpha diversity (a measurement of species be the most abundant (Figure 2A and SI Figure S3). The most
diversity) found in PM10 compared with those of PM2.5 samples abundant classified bacterial species appeared to be Geo-
(Figure 1C), may in part be attributed to the fact that the dermatophilus obscurus, a bacterium commonly found in dry soil
aerodynamic diameters of many fungal spore agglomerates environments (SI Table S7). By aligning to the Greengenes 16S
were between 2.5 and 10 μm.31−33 Principal component database, categorized by terrestrial, fecal, freshwater, and
analysis (PCA) of the microbial relative abundance (Figure 1D marine-associated bacteria (see Materials and Methods), we
and SI Table S6) and dinucleotide frequency (SI Figure S11) show that the majority (>85%) of the categorized bacteria in
suggested that the metagenomes of airborne microbes were the collected PM2.5 and PM10 samples were related to fecal and
distinct from those of other environments, though relatively terrestrial sources (Figure 2B and SI Figure S6). The
more related to the soil metagenomes. proportion of bacteria from terrestrial-related sources appeared
1503 dx.doi.org/10.1021/es4048472 | Environ. Sci. Technol. 2014, 48, 1499−1507Environmental Science & Technology Article
Figure 4. Daily variations of the normalized hit abundance of microbial pathogens and allergens in the collected PM2.5 and PM10 samples. (A) S.
pneumoniae and (B) A. f umigatus.
to be higher than those identified from the three previous days to an average of 3.7 ± 2.5% in the 5 heavily polluted days
studies (Figure 2C and SI Figure S6).14,16,17 This may in part in PM2.5 samples (SI Figures S4 and S12).
be attributed to the lack of vegetation coverage and abundance Microbial Allergens and Pathogens in the PM2.5 and
of dry, exposed soil, and construction sites in the city of Beijing PM10 Samples. Among the identified microbial species, several
and its surrounding areas, especially during the winter seasons. are known to cause human allergies and respiratory diseases,
In addition, while the proportion of freshwater and marine- including Streptococcus pneumoniae, Aspergillus f umigatus, and
associated bacteria remained relatively constant, the fraction of human adenovirus C (with average genome coverage of 2.0%,
fecal-associated bacteria appeared to have increased (from 4.5% 14.5%, and 6.5%, respectively). Among them, S. pneumoniae is
to as high as 11.4% in PM2.5 samples) (Figure 2B) with the most common cause for community-acquired pneumonia
progressively increased concentrations of PM pollution. (CAP), having been isolated from nearly 50% of CAP cases.35
Most Abundant Bacterial, Fungal, and Viral Species in Its representation within the entire bacteria community
PM2.5 and PM10. Since not only bacteria, but also fungi and (analyzed by MetaPhlAn) was 0.012% in PM2.5 samples and
viruses are responsible for various human allergies and diseases, 0.017% in PM10 samples, and the normalized number of hit
we sought to identify the microbial species including fungi and reads (hit abundance) appeared to have increased by ∼2 fold
viruses (which are currently not supported by the MetaPhlAn from an average of 0.024% during the first 2 less polluted days
toolbox) in PM2.5 and PM10 pollutants. We employed the Short to an average of 0.05 ± 0.02% in the 5 heavily polluted days in
Oligonucleotide Analysis Package (SOAP) alignment tool29 to PM2.5 samples (Figure 4A). A. f umigatus, likely collected in the
align the HiSeq reads from each sample to a cohort of 2637 form of spores, is known as a major fungal allergen and
nonredundant species of NCBI complete genomes, including opportunistic pathogen that causes airway or lung invasion in
bacteria, archaea, fungi, and viruses. At a 90% identity threshold immunodeficient patients.36 Its average hit abundance was
and ≥5% coverage of the complete bacterial genomes (for a found to be higher in PM10 than in PM2.5 samples (4.5% vs
typical bacterial genome of 4 Mb, it corresponds to a minimal 1.7%), most likely because the aerodynamic diameters of the
alignment length of ∼200 kb, >100-fold longer than the 16S fungal spore agglomerates are between 2.5 and 10 μm.37 The
rRNA gene and thus provides more confidence) or ≥0.5% hit abundance of A. f umigates also appeared to be correlated
coverage for fungal genomes, the 48 most abundant bacterial with the increase of PM pollution levels, increasing ∼4-fold
and 2 fungal species were identified (SI Table S2). Because of from an average of 1.5% during the first 2 less polluted days to
the smaller genome size of viruses, we used a more stringent an average of 5.8 ± 1.8% in the 5 heavily polluted days in PM10
alignment strategy (i.e., 100% identity and ≥1% coverage), and samples (Figure 4B). To confirm the existence of A. f umigatus
3 most abundant viral species were identified. We next in our samples, we cultured the fungus and validated its
estimated the genome-size-normalized relative abundance existence by sequencing the 18S rRNA gene and a species-
(defined as the number of unique hit reads normalized by specific gene (gliI) (SI Table S8), as well as SEM imaging (SI
genome size) of each species within the most common ones (SI Figure S13). Human adenovirus, a dsDNA virus that accounts
Table S3) and analyzed the daily variations of their relative for 5−10% of upper and lower respiratory tract infections in
abundance during the 7 sampling days (Figure 3). Consistent children,38 was also found (with 100% sequence matched to
with the MetaPhlAn results, the soil-associated bacteria G. human adenovirus C in all 14 samples). The hit abundance of
obscurus appeared to be the most abundant classified bacterial adenovirus in our samples also appeared to have increased
species (with an average genome coverage of ∼42.7% and during the heavily polluted days, though with more daily
relative abundance of ∼14.6% in the PM2.5 samples), followed variations than those of S. pneumonia and A. fumigates (SI
by Modestobacter marinus, Blastococcus saxobsidens, Kocuria Figure S5).
rhizophila, and Micrococcus luteus, all of which are commonly Chemical Composition Analysis of the PM Pollutants.
found in soil habitats and some with the abilities to survive To put our findings in the context of aerosol chemistry, we
under “tough” (e.g., UV radiation) conditions (SI Table S7). analyzed the organic and elemental carbon, water-soluble ions,
Although the relative abundance of most of the bacterial species and elemental composition of the collected samples (SI Tables
remained stable during the 7 sampling days, as was found in S9−S11). We found that sulfate, ammonium, nitrate, and
previous studies,12,34 some showed considerable variations. For organic matter were among the most abundant, and altogether
example, the relative abundance of Thermobif ida f usca, an their relative abundance in PM2.5 and PM10 samples were 80%
important bacterial degrader of plant cell walls and commonly and 71% (w/w), respectively. These results, as well as the high
found in decaying organic matter (SI Table S7), increased ∼5- weight ratio of PM2.5 to PM10 (∼0.7), suggested that secondary
fold from an average of 0.7% during the first 2 less polluted formation of fine particles likely led to the high PM
1504 dx.doi.org/10.1021/es4048472 | Environ. Sci. Technol. 2014, 48, 1499−1507Environmental Science & Technology Article
concentrations during this smog event.26 Additionally, the high species-level characterization vs more sampling days (98 Gb
relative humidity (SI Figure S8) during the period may have data from 14 samples). In particular, though PM pollution
contributed to particle growth through water uptake and levels are typically high in the winter of Beijing, low
promoting aqueous redox chemistry (e.g., the oxidation of temperatures are often associated with lower overall microbial
sulfur dioxide to sulfate). This also suggested that most of the abundance compared to warmer seasons. Thus, future
particles were rich in water content during the polluted days longitudinal and multiple location studies to identify airborne
and thus would favor the survival of microbes.39 microorganisms should be performed to compare with our
■ DISCUSSION
PM pollution has been studied extensively in the context of
current results and to provide better insights on the increased
incidences of respiratory diseases during urban smog events,
and to correlate with meteorological data, chemical compo-
aerosol chemistry and physics,24,26 and statistical correlations nents, and clinically obtained pathogen samples. Additionally,
between PM pollution and decreased life expectancy have been the establishment of a monitoring network for airborne
made.8 So far, no specific components of PM have been microbes can be invaluable during outbreaks of deadly
conclusively shown to be harmless.40 In particular, much less is respiratory diseases. Information on the abundance of particular
understood about what microorganisms are in the PM airborne pathogens and their regional and seasonal variations
pollutants. Previous studies have shown that bioaerosols will be of particular importance for the prevention of
containing pathogens are responsible for the spread of respiratory diseases at a public scale, in areas such as vaccine
respiratory diseases,41,42 and thus it is crucial to understand design and distribution, as well as for understanding the spread
the composition of airborne microbes at the species level and to of drug resistant respiratory pathogens.
■
identify the potential microbial allergens and pathogens. Most
of the clinically relevant studies on inhalable pathogens were ASSOCIATED CONTENT
conducted in hospital environments,42−45 yet in Beijing, a
significant increase of outpatient cases related to respiratory * Supporting Information
S
diseases during the same severe PM pollution period studied Detailed methods: PM and meteorological data; scanning
here has been reported.2 Our results have provided sequence- electron microscopy; OC and EC analysis; elemental analysis;
based evidence for the existence of inhalable microbial allergen water soluble ion analysis; (Figure S1) rarefaction curves of
and pathogen species in an open environment, and suggested PM2.5 and PM10 samples sequenced by MiSeq and HiSeq
that high PM pollution may pose health threats to the platforms; (Figure S2) phylogenetic tree of bacteria and archaea
susceptible population (e.g., the elderlies and the immunode- identified from PM2.5 and PM10 samples; (Figure S3) heatmaps
ficient). Besides, information on the original habitats of of the relative abundance of bacteria and archaea identified by
airborne bacteria provides important insights for understanding MetaPhlAn; (Figure S4) variations of the genome-size-
the source of the biological particles, and may be used as a normalized relative abundance of the most common bacterial,
reference for future urban planning efforts to reduce PM fungal, and viral species; (Figure S5) daily variations of the
pollution and the spread of airborne microbial allergens and normalized hit abundance of human adenovirus C in the
pathogens. In future studies, clinical samples (e.g., sputum collected PM2.5 and PM10 samples; (Figure S6) original habitats
samples from respiratory disease patients) during severely of the bacteria identified from the Tsinghua PM2.5 and PM10
polluted and unpolluted days can be obtained, and the samples compared with three previous studies; (Figure S7)
sequence information can be compared to those from collected PM2.5 and PM10 concentration of Beijing, Haidian district and
PM samples for comparison. Furthermore, PM exposure Tsinghua monitoring site; (Figure S8) meteorological data
studies on animal models can be performed to characterize plotted with PM2.5 and PM10 concentration in January 2013;
the effects of PM-associated allergens and pathogens, leading to (Figure S9) filter coloration and SEM images of PM2.5 and
better understandings of their pathogenicity. PM10 samples; (Figure S10) number of overlapping airborne
Using the current methods, we were able to identify bacterial, microbes at the genus level between Tsinghua PM study and
archaeal, fungal, and dsDNA viral species in the collected PM three previous studies; (Figure S11) principle component
samples. Cultivation was used to verify the existence of A. analysis of dinucleotide frequency of pooled PM2.5 samples and
f umigatus. We also attempted to culture other bacteria and PM10 samples; (Figure S12) percentage increase of 53 common
fungi species, but not all were successfully cultured (data not species identified from PM samples; (Figure S13) images of
shown) since some species were slow-growing or difficult to cultured Aspergillus f umigatus from PM samples; (Table S1)
culture, and the samples were stored at −80 °C before use. summary of sequencing data; (Table S2) genome coverage of
RNA viruses such as rhinovirus and influenza virus are the 48 most common bacterial, 2 fungal, and 3 viral species;
undoubtedly important viral agents that affect the public (Table S3) genome-size-normalized relative abundance of the
health. Yet in our experience, it appeared to be technically 48 most common bacterial, 2 fungal, and 3 viral species; (Table
challenging to extract sufficient quantities of RNA for reverse S4) summary of PM and meteorological data; (Table S5)
transcription and sequencing from PM samples containing airborne bacteria identified at the genus level from Tsinghua
various RNA-degrading containments such as divalent cations. PM study and three previous studies combined; (Table S6)
Low-bias preamplification techniques may be used to generate public data of metagenomic studies used in PCA analysis;
sufficient libraries for the sequencing of RNA viruses in PM (Table S7) annotations of the 48 most common bacterial, 2
samples in future studies.46 As for human dsDNA viruses, fungal, and 3 viral species; (Table S8) primers and Sanger
human adenovirus C appeared to be the most abundant in our sequencing results; (Table S9) estimated concentrations of
PM samples based on our sequencing results. More organic carbon and elemental carbon measured in PM2.5 and
importantly, the current study was limited by the daily PM10 samples; (Table S10) estimated concentrations of anions
sampling capacity and availability of sampling sites, as well as and cations measured in PM2.5 and PM10 samples; (Table S11)
the trade-off between obtaining high-depth sequence data for estimated concentrations of elements measured in PM2.5 and
1505 dx.doi.org/10.1021/es4048472 | Environ. Sci. Technol. 2014, 48, 1499−1507Environmental Science & Technology Article
PM10 samples; and additional references. This material is (8) Pope, C. A., 3rd; Ezzati, M.; Dockery, D. W. Fine-particulate air
available free of charge via the Internet at http://pubs.acs.org. pollution and life expectancy in the United States. N. Engl. J. Med.
■
2009, 360 (4), 376−386.
(9) Hanzalova, K.; Rossner, P.; Sram, R. J. Oxidative damage induced
AUTHOR INFORMATION
by carcinogenic polycyclic aromatic hydrocarbons and organic extracts
Corresponding Author from urban air particulate matter. Mutat. Res.-Gen. Tox. En. 2010, 696
*Phone: +86-10-62797325 (T.F.Z.); +86-10-62795684 (G.T.); (2), 114−121.
+86-10-62781512 (J.J.). E-mail: tzhu@biomed.tsinghua.edu.cn (10) Valavanidis, A.; Fiotakis, K.; Vlachogianni, T. Airborne
(T.F.Z.); tiangeng@biomed.tsinghua.edu.cn (G.T.); jiangjk@ particulate matter and human health: Toxicological assessment and
tsinghua.edu.cn (J.J.). importance of size and composition of particles for oxidative damage
and carcinogenic mechanisms. J. Environ. Sci. Heal. Part C 2008, 26
Author Contributions (4), 339−362.
▽
These authors contributed equally to this work. (11) Jaenicke, R. Abundance of cellular material and proteins in the
Notes atmosphere. Science 2005, 308 (5718), 73.
The authors declare no competing financial interests. (12) Bowers, R. M.; McLetchie, S.; Knight, R.; Fierer, N. Spatial
■
variability in airborne bacterial communities across land-use types and
their relationship to the bacterial communities of potential source
ACKNOWLEDGMENTS environments. ISME J. 2011, 5 (4), 601−612.
We thank Gong Cheng, Lei Huang, Babak Javid, Masood (13) Lee, T.; Grinshpun, S. A.; Martuzevicius, D.; Adhikari, A.;
Kayani, Yigong Shi, Melody Toosky, Hongwei Wang, Zhen Xie, Crawford, C. M.; Luo, J.; Reponen, T. Relationship between indoor
Nieng Yan, Li Yu, Jingren Zhang, and Michael Q. Zhang for and outdoor bioaerosols collected with a button inhalable aerosol
helpful discussions and comments on the manuscript, and sampler in urban homes. Indoor Air 2006, 16 (1), 37−47.
(14) Bertolini, V.; Gandolfi, I.; Ambrosini, R.; Bestetti, G.; Innocente,
Qingran Bai, He Chen, Siyu Chen, Zhen Cheng, Hongliang Fu,
E.; Rampazzo, G.; Franzetti, A. Temporal variability and effect of
Ru He, Long Hu, Dongfang Li, Junxiang Li, Cuihua Liu, Kaigui environmental variables on airborne bacterial communities in an urban
Luo, Peng Liang, Yu Liang, Yongbin Li, Zhixun Shen, Shuxiao area of Northern Italy. Appl. Microbiol. Biotechnol. 2013, 97 (14),
Wang, Tingting Wang, Zhiying Xie, Siyin Zhang, and Wei Zhou 6561−6570.
for their assistance with the experiments. BGI-Shenzhen (15) Brodie, E. L.; DeSantis, T. Z.; Parker, J. P.; Zubietta, I. X.;
provided the sequencing platforms used in this study and Piceno, Y. M.; Andersen, G. L. Urban aerosols harbor diverse and
assistance in preliminary sequence analysis. NSCC-TJ (D.L.) dynamic bacterial populations. Proc. Natl. Acad. Sci. U.S.A. 2007, 104
and Tsinghua University School of Information Science and (1), 299−304.
Technology provided computational facilities and assistance (16) DeLeon-Rodriguez, N.; Lathem, T. L.; Rodriguez, R. L.;
with the data analysis. This work was supported in part by Barazesh, J. M.; Anderson, B. E.; Beyersdorf, A. J.; Ziemba, L. D.;
funding from the Tsinghua UniversityPeking University Bergin, M.; Nenes, A.; Konstantinidis, K. T. Microbiome of the upper
Center for Life Sciences (CLS), Collaborative Innovation troposphere: species composition and prevalence, effects of tropical
Center for Diagnosis and Treatment of Infectious Diseases, the storms, and atmospheric implications. Proc. Natl. Acad. Sci. U.S.A.
Science and Technology Major Project of the Ministry of 2013, 110 (7), 2575−2580.
(17) Robertson, C. E.; Baumgartner, L. K.; Harris, J. K.; Peterson, K.
Sc i e n c e a n d T e c h n o l o g y o f C h i n a ( G r a n t N o .
L.; Stevens, M. J.; Frank, D. N.; Pace, N. R. Culture-independent
2013ZX10003003 to Z.Z.), National Natural Science Founda- analysis of aerosol microbiology in a metropolitan subway system.
tion of China (Grant No. 21190054, 21107060, and Appl. Environ. Microbiol. 2013, 79 (11), 3485−3493.
21221004), Center for Marine Medicine and Rescue of (18) Bowers, R. M.; Clements, N.; Emerson, J. B.; Wiedinmyer, C.;
Tsinghua University, and Tsinghua Qian Ren Tuan Dui Hannigan, M. P.; Fierer, N. Seasonal variability in bacterial and fungal
funding (to M.Q.Z.). diversity of the near-surface atmosphere. Environ. Sci. Technol. 2013, 47
■ REFERENCES
(1) Cheng, Z.; Jiang, J.; Fajardo, O.; Wang, S.; Hao, J. Characteristics
(21), 12097−12106.
(19) Acinas, S. G.; Sarma-Rupavtarm, R.; Klepac-Ceraj, V.; Polz, M.
F. PCR-induced sequence artifacts and bias: insights from comparison
of two 16S rRNA clone libraries constructed from the same sample.
and health impacts of particulate matter pollution in China (2001−
Appl. Environ. Microbiol. 2005, 71 (12), 8966−8969.
2011). Atmos. Environ. 2013, 65 (0), 186−194.
(20) Bowers, R. M.; Lauber, C. L.; Wiedinmyer, C.; Hamady, M.;
(2) Ouyang, Y. China wakes up to the crisis of air pollution. Lancet
Hallar, A. G.; Fall, R.; Knight, R.; Fierer, N. Characterization of
Respir. Med. 2013, 1 (1), 12.
(3) Parrish, D. D.; Zhu, T. Climate change. Clean air for megacities. airborne microbial communities at a high-elevation site and their
Science 2009, 326 (5953), 674−675. potential to act as atmospheric ice nuclei. Appl. Environ. Microbiol.
(4) Zhang, J.; Mauzerall, D. L.; Zhu, T.; Liang, S.; Ezzati, M.; Remais, 2009, 75 (15), 5121−5130.
J. V. Environmental health in China: Progress towards clean air and (21) Sjoling, A.; Wiklund, G.; Savarino, S. J.; Cohen, D. I.;
safe water. Lancet 2010, 375 (9720), 1110−1119. Svennerholm, A. M. Comparative analyses of phenotypic and
(5) Zhang, Q.; He, K.; Huo, H. Policy: Cleaning China’s air. Nature genotypic methods for detection of enterotoxigenic Escherichia coli
2012, 484 (7393), 161−162. toxins and colonization factors. J. Clin. Microbiol. 2007, 45 (10), 3295−
(6) Brook, R. D.; Franklin, B.; Cascio, W.; Hong, Y.; Howard, G.; 3301.
Lipsett, M.; Luepker, R.; Mittleman, M.; Samet, J.; Smith, S. C., Jr.; (22) Qin, J.; Li, R.; Raes, J.; Arumugam, M.; Burgdorf, K. S.;
Tager, I. Air pollution and cardiovascular disease: A statement for Manichanh, C.; Nielsen, T.; Pons, N.; Levenez, F.; Yamada, T.;
healthcare professionals from the expert panel on population and Mende, D. R.; Li, J.; Xu, J.; Li, S.; Li, D.; Cao, J.; Wang, B.; Liang, H.;
prevention science of the American Heart Association. Circulation Zheng, H.; Xie, Y.; Tap, J.; Lepage, P.; Bertalan, M.; Batto, J. M.;
2004, 109 (21), 2655−2671. Hansen, T.; Le Paslier, D.; Linneberg, A.; Nielsen, H. B.; Pelletier, E.;
(7) Hunt, A.; Abraham, J. L.; Judson, B.; Berry, C. L. Toxicologic and Renault, P.; Sicheritz-Ponten, T.; Turner, K.; Zhu, H.; Yu, C.; Jian, M.;
epidemiologic clues from the characterization of the 1952 London Zhou, Y.; Li, Y.; Zhang, X.; Qin, N.; Yang, H.; Wang, J.; Brunak, S.;
smog fine particulate matter in archival autopsy lung tissues. Environ. Dore, J.; Guarner, F.; Kristiansen, K.; Pedersen, O.; Parkhill, J.;
Health Perspect. 2003, 111 (9), 1209−1214. Weissenbach, J.; Bork, P.; Ehrlich, S. D. A human gut microbial gene
1506 dx.doi.org/10.1021/es4048472 | Environ. Sci. Technol. 2014, 48, 1499−1507Environmental Science & Technology Article
catalogue established by metagenomic sequencing. Nature 2010, 464 Jimenez, J.; Keller, N.; Khouri, H.; Kitamoto, K.; Kobayashi, T.;
(7285), 59−65. Konzack, S.; Kulkarni, R.; Kumagai, T.; Lafon, A.; Latge, J. P.; Li, W.;
(23) Qin, J.; Li, Y.; Cai, Z.; Li, S.; Zhu, J.; Zhang, F.; Liang, S.; Zhang, Lord, A.; Lu, C.; Majoros, W. H.; May, G. S.; Miller, B. L.; Mohamoud,
W.; Guan, Y.; Shen, D.; Peng, Y.; Zhang, D.; Jie, Z.; Wu, W.; Qin, Y.; Y.; Molina, M.; Monod, M.; Mouyna, I.; Mulligan, S.; Murphy, L.;
Xue, W.; Li, J.; Han, L.; Lu, D.; Wu, P.; Dai, Y.; Sun, X.; Li, Z.; Tang, O’Neil, S.; Paulsen, I.; Penalva, M. A.; Pertea, M.; Price, C.; Pritchard,
A.; Zhong, S.; Li, X.; Chen, W.; Xu, R.; Wang, M.; Feng, Q.; Gong, M.; B. L.; Quail, M. A.; Rabbinowitsch, E.; Rawlins, N.; Rajandream, M. A.;
Yu, J.; Zhang, Y.; Zhang, M.; Hansen, T.; Sanchez, G.; Raes, J.; Falony, Reichard, U.; Renauld, H.; Robson, G. D.; Rodriguez de Cordoba, S.;
G.; Okuda, S.; Almeida, M.; LeChatelier, E.; Renault, P.; Pons, N.; Rodriguez-Pena, J. M.; Ronning, C. M.; Rutter, S.; Salzberg, S. L.;
Batto, J. M.; Zhang, Z.; Chen, H.; Yang, R.; Zheng, W.; Li, S.; Yang, Sanchez, M.; Sanchez-Ferrero, J. C.; Saunders, D.; Seeger, K.; Squares,
H.; Wang, J.; Ehrlich, S. D.; Nielsen, R.; Pedersen, O.; Kristiansen, K.; R.; Squares, S.; Takeuchi, M.; Tekaia, F.; Turner, G.; Vazquez de
Wang, J. A metagenome-wide association study of gut microbiota in Aldana, C. R.; Weidman, J.; White, O.; Woodward, J.; Yu, J. H.; Fraser,
type 2 diabetes. Nature 2012, 490 (7418), 55−60. C.; Galagan, J. E.; Asai, K.; Machida, M.; Hall, N.; Barrell, B.; Denning,
(24) He, K.; Yang, F.; Ma, Y.; Zhang, Q.; Yao, X.; Chan, C. K.; Cadle, D. W. Genomic sequence of the pathogenic and allergenic filamentous
S.; Chan, T.; Mulawa, P. The characteristics of PM2.5 in Beijing, fungus Aspergillus fumigatus. Nature 2005, 438 (7071), 1151−1156.
China. Atmos. Environ. 2001, 35 (29), 4959−4970. (37) Deacon, L. J.; Pankhurst, L. J.; Drew, G. H.; Hayes, E. T.;
(25) Wang, S.; Zhao, M.; Xing, J.; Wu, Y.; Zhou, Y.; Lei, Y.; He, K.; Jackson, S.; Longhurst, P. J.; Longhurst, J. W. S.; Liu, J.; Pollard, S. J.
Fu, L.; Hao, J. Quantifying the air pollutants emission reduction during T.; Tyrrel, S. F. Particle size distribution of airborne Aspergillus
the 2008 Olympic games in Beijing. Environ. Sci. Technol. 2010, 44 (7), f umigatus spores emitted from compost using membrane filtration.
2490−2496. Atmos. Environ. 2009, 43 (35), 5698−5701.
(26) Yang, F.; Tan, J.; Zhao, Q.; Du, Z.; He, K.; Ma, Y.; Duan, F.; (38) Shike, H.; Shimizu, C.; Kanegaye, J.; Foley, J. L.; Burns, J. C.
Chen, G.; Zhao, Q. Characteristics of PM2.5 speciation in Quantitation of adenovirus genome during acute infection in normal
representative megacities and across China. Atmos. Chem. Phys. children. Pediatr. Infect. Dis. J. 2005, 24 (1), 29−33.
2011, 11 (11), 5207−5219. (39) Stanier, C. O.; Khlystov, A. Y.; Chan, W. R.; Mandiro, M.;
(27) Meyer, F.; Paarmann, D.; D’Souza, M.; Olson, R.; Glass, E. M.; Pandis, S. N. A method for the in situ measurement of fine aerosol
Kubal, M.; Paczian, T.; Rodriguez, A.; Stevens, R.; Wilke, A.; water content of ambient aerosols: The dry-ambient aerosol size
Wilkening, J.; Edwards, R. A. The metagenomics RAST serverA spectrometer (DAASS). Aerosol Sci. Technol. 2004, 38, 215−228.
public resource for the automatic phylogenetic and functional analysis (40) Fowler, D.; Brunekreef, B.; Fuzzi, S.; Monks, P. S.; Sutton, M.
of metagenomes. BMC Bioinform. 2008, 9 (1), 1−8. A.; Brasseur, G. P.; Friedrich, R.; Passante, L. G.; Jimenez Mingo, J. M.
(28) Segata, N.; Waldron, L.; Ballarini, A.; Narasimhan, V.; Jousson, Research Findings in support of the EU Air Quality. 2013. http://
O.; Huttenhower, C. Metagenomic microbial community profiling www.accent-network.org/EuAirQualityReview/docs/PDF%20BASSA.
using unique clade-specific marker genes. Nat. Methods 2012, 9 (8), pdf (accessed Jan 10, 2014)
811−814. (41) Clifton, I. J.; Peckham, D. G. Defining routes of airborne
(29) Li, R.; Yu, C.; Li, Y.; Lam, T. W.; Yiu, S. M.; Kristiansen, K.; transmission of Pseudomonas aeruginosa in people with cystic fibrosis.
Wang, J. SOAP2: An improved ultrafast tool for short read alignment. Exp. Rev. Respir. Med. 2010, 4 (4), 519−529.
Bioinformatics 2009, 25 (15), 1966−1967. (42) Eames, I.; Tang, J. W.; Li, Y.; Wilson, P. Airborne transmission
(30) DeSantis, T. Z.; Hugenholtz, P.; Larsen, N.; Rojas, M.; Brodie, of disease in hospitals. J. R. Soc. Interface 2009, 6, S697−S702.
E. L.; Keller, K.; Huber, T.; Dalevi, D.; Hu, P.; Andersen, G. L. (43) Menzies, D.; Fanning, A.; Yuan, L.; FitzGerald, J. M. Hospital
Greengenes, a chimera-checked 16S rRNA gene database and ventilation and risk for tuberculous infection in Canadian health care
workbench compatible with ARB. Appl. Environ. Microbiol. 2006, 72 workers. Ann. Intern. Med. 2000, 133 (10), 779−789.
(7), 5069−5072. (44) Haddad, S. H.; Arabi, Y. M.; Memish, Z. A.; Al-Shimemeri, A. A.
(31) Lee, S. A.; Liao, C. H. Size-selective assessment of agricultural Nosocomial infective endocarditis in critically ill patients: A report of
workers’ personal exposure to airborne fungi and fungal fragments. Sci. three cases and review of the literature. Int. J. Infect. Dis. 2004, 8 (4),
Total Environ. 2014, 466−467, 725−732. 210−216.
(32) Reponen, T.; Willeke, K.; Ulevicius, V.; Reponen, A.; (45) Ferroni, A.; Werkhauser-Bertrand, A.; Le Bourgeois, M.;
Grinshpun, S. A. Effect of relative humidity on the aerodynamic Beauvais, R.; Vrielynck, S.; Durand, C.; Lenoir, G.; Berche, P.;
diameter and respiratory deposition of fungal spores. Atmos. Environ. Sermet-Gaudelus, I. Bacterial contamination in the environment of
1996, 30 (23), 3967−3974. hospitalised children with cystic fibrosis. J. Cyst. Fibros. 2008, 7 (6),
(33) Brook, R. D.; Franklin, B.; Cascio, W.; Hong, Y. L.; Howard, G.; 477−482.
Lipsett, M.; Luepker, R.; Mittleman, M.; Samet, J.; Smith, S. C.; Tager, (46) Duhaime, M. B.; Deng, L.; Poulos, B. T.; Sullivan, M. B.
I. Air pollution and cardiovascular diseaseA statement for healthcare Towards quantitative metagenomics of wild viruses and other ultra-low
professionals from the expert panel on population and prevention concentration DNA samples: A rigorous assessment and optimization
science of the American Heart Association. Circulation 2004, 109 (21), of the linker amplification method. Environ. Microbiol. 2012, 14 (9),
2526−2537.
2655−2671.
(34) Bowers, R. M.; Sullivan, A. P.; Costello, E. K.; Collett, J. L., Jr.;
Knight, R.; Fierer, N. Sources of bacteria in outdoor air across cities in
the midwestern United States. Appl. Environ. Microbiol. 2011, 77 (18),
6350−6356.
(35) Lim, W. S.; Macfarlane, J. T.; Boswell, T. C.; Harrison, T. G.;
Rose, D.; Leinonen, M.; Saikku, P. Study of community acquired
pneumonia aetiology (SCAPA) in adults admitted to hospital:
implications for management guidelines. Thorax 2001, 56 (4), 296−
301.
(36) Nierman, W. C.; Pain, A.; Anderson, M. J.; Wortman, J. R.; Kim,
H. S.; Arroyo, J.; Berriman, M.; Abe, K.; Archer, D. B.; Bermejo, C.;
Bennett, J.; Bowyer, P.; Chen, D.; Collins, M.; Coulsen, R.; Davies, R.;
Dyer, P. S.; Farman, M.; Fedorova, N.; Fedorova, N.; Feldblyum, T.
V.; Fischer, R.; Fosker, N.; Fraser, A.; Garcia, J. L.; Garcia, M. J.;
Goble, A.; Goldman, G. H.; Gomi, K.; Griffith-Jones, S.; Gwilliam, R.;
Haas, B.; Haas, H.; Harris, D.; Horiuchi, H.; Huang, J.; Humphray, S.;
1507 dx.doi.org/10.1021/es4048472 | Environ. Sci. Technol. 2014, 48, 1499−1507You can also read