Initial Transportation Asset Management Plan - Certified July 2018
←
→
Page content transcription
If your browser does not render page correctly, please read the page content below
Initial Transportation
Asset Management Plan
           Certified July 2018

Table of Contents                                                           Acronym Table

     Introduction .  .  .  .  .  .  .  .  .  .  .  .  .  .  .  .  .  .  1   Act 51     Michigan Public Act 51 of 1951                  PCFS   Pavement Condition Forecasting System

                                                                            BCFS       Bridge Condition Forecasting System             RQFS   Road Quality Forecasting System

                                                                            CFP        Call for Projects                               RSL    Remaining Service Life
     Program Development
                                                                            CNG        Compressed Natural Gas                          RTF    Rural Task Force
     Call For Projects Process .  .  .  .  .  .  .  .  .  .  . 5
                                                                            CPM        Capital Preventive Maintenance                  SOGR   State of Good Repair

                                                                            EDMC       Elemental Decomposition and Multi-Criteria      STC    State Transportation Commission

     Life Cycle Planning .  .  .  .  .  .  .  .  .  .  .  .  .  .  9        FAE        Federal Aid-Eligible                            STF    State Trunkline Fund

                                                                            FAST       Fixing America’s Surface Transportation Act     STIP   Statewide Transportation Improvement Program

                                                                            FHWA       Federal Highway Administration                  STPD   Statewide Transportation Planning Division
     Risk Management Process .  .  .  .  .  .  .  .  .  13                  FY         Fiscal Year                                     TAMC   Transportation Asset Management Council

                                                                            GF         State General Fund                              TAMP   Transportation Asset Management Plan

                                                                            HTF        Federal High Trust Fund                         TIP    Transportation Improvement Program
     Inventory and Condition Analysis .  .  .  .  . 15
                                                                            IRI        International Roughness Index                   TOC    Traffic Operations Center

                                                                            ITS        Intelligent Transportation System               TPM    Transportation Performance Measure

     Financial Plan .  .  .  .  .  .  .  .  .  .  .  .  .  .  .  .  19      MAP-21 Moving Ahead for Progress in the 21st Century Act
                                                                            MDOT       Michigan Department of Transportation

                                                                            MPO        Metropolitan Planning Organization
     Investment Strategies .  .  .  .  .  .  .  .  .  .  .  .  27
                                                                            MTF        Michigan Transportation Fund

                                                                            MTPA       Michigan Transportation Planning Association

                                                                            NBI        National Bridge Inventory
     Performance Gap Analysis .  .  .  .  .  .  .  .  .  37
                                                                            NBIS       National Bridge Inspection Standards

                                                                            NHS        National Highway System
     Conclusion: Closing the Gap.  .  .  .  .  .  .  .  45                  PASER      Pavement Surface and Evaluation Rating

Introduction
In 2012, the Moving Ahead for Progress in the 21st Century Act               to implement asset management practices for federal-aid-eligible
(MAP-21) began a national effort to implement a performance-based            highways across state and local jurisdictions. Working from
approach to transportation investment decision-making. That effort was       MDOT’s example, the group developed tools that local agencies could use,
strengthened in 2015 by the Fixing America’s Surface Transportation          as well as a methodology that all agencies could agree on for data collection
(FAST) Act. The performance goals enumerated in MAP-21 and affirmed          and analysis. As a result, several hundred road agencies work together
by the FAST Act address safety, infrastructure condition, congestion,        each year through their regional planning agencies and MPOs to gather
system reliability, economic vitality, and environmental sustainability.     performance data on almost 37,000 miles of federal-aid-eligible highway
                                                                             pavements and more than 9,000 highway bridges across the state. Of the
Implementing these new federal performance management requirements
                                                                             84 agencies with jurisdiction over the NHS, more than 60% use an asset
nationwide has been no small task. It has been a lengthy process, one
                                                                             management process to select projects and more than 50% use software or
that is still in progress. Data needs to be collected for new federal
                                                                             other tools to prioritize projects and have a separate investment plan for
performance measures such as pavement rutting, cracking and faulting.
                                                                             their higher-level system which includes the NHS.
New tools are still needed to accurately measure and project pavement
performance using the new measures as well as the International              The development of this Initial TAMP is just one step in a federal process
Roughness Index (IRI). Performance targets are still being discussed         that will take several years to be fully implemented. It is intended as a
here in Michigan, as MDOT works cooperatively with its metropolitan          preliminary document, including a description of the processes used
planning organization (MPO) partners to develop targets according to         in Michigan. Once MPO targets are set and new federal performance
federal due dates.                                                           measures begin to be more fully implemented, a final TAMP will be
                                                                             completed by June 2019, as required by law. It is possible, even likely, that
The new federal performance measures may, over time, prompt some
                                                                             as data on the new federal performance measures (IRI, rutting, cracking,
changes to Michigan’s decades-long approach to asset management and
                                                                             faulting) becomes available, it may differ from the data that Michigan has
performance measurement. In 1997, the Michigan State Transportation
                                                                             previously developed since the new data will relate to different aspects of
Commission (STC) approved 10-year aspirational condition goals for
                                                                             road condition.
Michigan’s freeway (95 percent good/fair) and non-freeway (85 percent
good/fair) state trunkline systems, based on pavement distress. A year       The focus of the Initial TAMP, consistent with federal guidance, is on the
later, the STC approved similar goals for Michigan freeway and non-          Interstate and the National Highway Systems (NHS), and the national
freeway bridges.                                                             performance measures for pavements and bridges. Interstate and NHS
                                                                             pavements and bridges, while important from a national perspective, are
In the decade that followed, MDOT worked diligently to achieve those
                                                                             just a subset of the total transportation infrastructure in Michigan.
goals using its asset management process, as well as measurement
and forecasting tools it had developed for pavement distress. In 2007,       Michigan’s history of asset management and performance measurement
the agency successfully achieved its 10-year condition goals for both        helps set the context for the development of this asset management plan.
pavements and bridges. MDOT’s asset management approach linked               The focus of this plan is just on those assets initially required by the
data, goals, investment strategies, programs, and projects in a systematic   federal government, Interstate and NHS pavements and bridges. The asset
process to ensure achievement of desired results.                            management planning process is led by the Bureau of Transportation
                                                                             Planning and Bureau of Development and engages all facets of the
Expanding on MDOT’s demonstrated success with asset management,
                                                                             department to deliver the comprehensive and evolving Five-Year
the Michigan Legislature in 2002 created the Transportation Asset
                                                                             Transportation Program on an annual basis.
Management Council (TAMC). The TAMC’s charge was to develop a
statewide asset management strategy and the processes and tools needed
                                                                                                                              2018 Transportation Asset Management Plan
                                                                                                                              2018 Transportation Asset Management Plan
                                                                                                                                                                          1
                                                                                                                                                                          1
MDOT manages 82 percent of the NHS system in Michigan. The remaining 18 percent of Michigan’s NHS is operated, preserved and maintained by
          84 local road agencies (66 cities and 18 counties or county road commissions). The entire road network in Michigan is comprised of 122,115 miles.
          The TAMP focuses on the most critical portion of the system – the NHS system, which encompasses 6,472 miles. The roadway system components
          addressed in the report are shown in green in Figure 1.

                                                                                   Figure 1: Michigan’s Road Network
                                                                                              122,115 Miles Total1

          1 Total includes roads not under MDOT or local jurisdiction, such as state park, federal, or Indian Tribal roads.

2   Michigan Department of Transportation
This Initial TAMP describes the asset management processes by which MDOT makes its program and project decisions. It also includes inventory
and condition information, a description of investment strategies, and financial and performance gap analyses based on four investment strategies
outlined in federal guidance:
    • Achieve the national goals: No more than 5 percent poor Interstate pavements; no more than 10 percent poor bridges.
    • Preserve the condition of the pavement and bridge assets: Maintain current condition for Interstate and NHS pavements and bridges.
    • Achieve and sustain a desired State of Good Repair (SOGR): SOGR aspirational goals for Interstate and NHS pavements and bridges
      based on MDOT’s current goals for these systems.
    • Constrained Investment: Investment of the funds reasonably expected to be available for Interstate and NHS pavement and bridges.

                                                                                                                           2018 Transportation Asset Management Plan   3
The chapters of this Initial TAMP are based on the most recent available
                                            data and include:
                                                • Program Development Call For Projects (CFP) Process – a
                                                  description of MDOT’s CFP process used to develop a list of
                                                  pavement and bridge projects for the State Transportation
                                                  Improvement Program that is intended to make progress toward
                                                  performance goals, based on the investment strategies, life cycle
                                                  planning, and potential risks.
                                                • Life Cycle Planning – a description of the processes used to
                                                  calculate life cycle impacts of the proposed investment strategies on
                                                  pavements and bridges.
                                                • Risk Management Process – a description of the process used to
                                                  assess risks and develop a Risk Management Plan as required by
                                                  regulations.
                                                • Inventory and Condition Analysis – a summary of the lane and
                                                  route miles of pavement, as well as the deck area and number of
                                                  bridges on the NHS and their current condition.
                                                • Financial Plan – a description of state, federal and local revenues
                                                  anticipated to be available for investment in the NHS over the next
                                                  10 years, including the process used to develop estimates.
                                                • Investment Strategies – a description of investment strategies
                                                  that are analyzed to determine the best investment strategy to help
                                                  achieve progress toward the performance goal and a description of
                                                  the process by which investment strategies guide the allocation of
                                                  capital resources to achieve the goals established.
                                                • Performance Gap Analysis – this chapter will explain what
                                                  performance gaps are currently anticipated based on the identified
                                                  set of goals, including the process used to address the following: 1)
                                                  Targets for asset condition of NHS pavements and bridges; 2) Gaps,
                                                  if any, in the performance of the NHS that affect NHS pavements
                                                  and bridges; and 3) Alternative strategies to close or address the
                                                  identified gaps.

4   Michigan Department of Transportation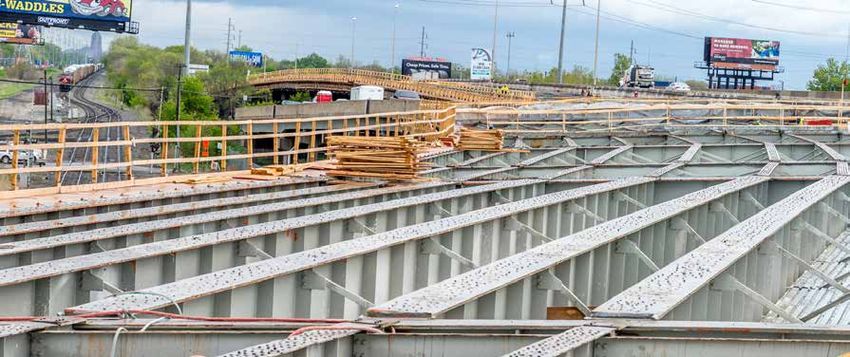
Program Development Call for Projects Process

MDOT takes an asset management approach to managing pavement and
bridge (highway) investments. Asset management is a strategic approach
to linking data, goals, investment strategies, programs, and projects into a
systemic process to ensure achievement of a desired result. This strategic     Figure 2: Balancing Investments
approach can be described in a circular model as shown.                         Asset Management Approach

Steps in the asset management process are:
    1.	Goals and objectives are established.
    2.	System inventory and condition data are collected.
    3.	The condition data are analyzed, and rates of deterioration are
      computed.
    4.	Performance measures and standards are set or reaffirmed.
    5.	Life cycle network analysis is performed using forecasting tools.
    6.	Gaps in funding and performance and risk factors are evaluated.
    7.	Investment strategies are analyzed and selected.
    8.	The selected investment strategies are implemented through
      the development of programs, selection of projects, and use of
      practices that fit into the investment strategies.
    9.	The process and system are monitored and adjusted based on the
      outcome of the projects and programs that were implemented.

MDOT’s highway program development process is a yearlong, multi-
stage process as shown in Figure 2. MDOT continues to emphasize and
strengthen partnering efforts with transportation stakeholders and the
general public throughout this process. MDOT also continues to implement
processes developed at workshops and stakeholder meetings to incorporate
context-sensitive solutions into transportation projects, and seeks public
input from a variety of sources on future Five-Year Transportation programs.
MDOT is committed to improving its process of tracking public engagement
at the regional level to enhance local communication and follow-up with
transportation industry partners and the public.

                                                                                                     2018 Transportation Asset Management Plan   5
Program Development Call for Projects Process

           Figure 3: Five-Year Transportation Program Development Process                    MDOT uses forecasting tools to evaluate the network-level impact of
                                                                                             varying investment strategies on the whole life costs of assets. Risks that
                                                                                             can affect the condition of the transportation assets in Michigan are
                                                                                             evaluated as investment strategies are developed. Gap analysis is considered
                                                                                             when various investment strategies are compared to determine the best
                                                                                             strategy to meet the overall goals and objectives set by the STC.
                                                                                             Issue Call For Projects
                                                                                             MDOT issues an internal call for preservation projects annually for
                                                                                             the Highway Program. A letter and instructions are issued to all seven
                                                                                             MDOT region offices, which are responsible for proposing preservation
                                                                                             projects. Key emphasis areas and strategic objectives are outlined, and
                                                                                             detailed technical instructions are issued. Target funding levels for each
                                                                                             region are calculated from a formula based on weightings relating to
                                                                                             variables such as condition, usage, costs, and eligible assets. For pavement
                                                                                             allocations, each region’s relative share of eligible lane miles are weighted
                                                                                             on several factors. The factors are weighted 50 percent on condition,
           Transportation Program Development Key Steps                                      25 percent on cost factors and 25 percent on usage. Bridge funding is
                                                                                             allocated based on deck area of eligible candidates.
           Develop Revenue Estimates
           The anticipated funding available and cost of future work constrain               Develop Condition Strategies
           program development. State and federal revenue available for the capital          Regional improvement strategies for the road and bridge networks are
           program is forecasted based on historical trends, federal funding acts,           developed by MDOT region staff using the Road Quality Forecasting
           and state legislation. Future funding that will be available for asset            System (RQFS) and Bridge Condition Forecasting System (BCFS) tools,
           management is projected.                                                          as well as input from partners and stakeholders. These strategies guide
                                                                                             project selection and ensure that a mix of fixes is incorporated into
           Develop Investment Strategies                                                     program development. There are a number of repairs or fixes that can be
           MDOT trunkline investment strategies have been driven by its vision and           made to existing facilities that have different impacts on the trunkline
           goals. Within the vision and goals are key components that help enhance           network. Fixes are categorized into three groups: long-term, medium-
           the department’s practices, essentially allowing the department to be better,     term, and short-term. By applying a mix-of-fixes approach that includes
           faster, cheaper, safer, and smarter. The STC establishes these policies, goals,   a combination of long, medium, and short-term fixes, MDOT can
           and objectives that provide the basis for investment strategy decisions.          systematically address system needs in the most cost-effective means
                                                                                             possible. Examples of a mix of fixes include longer-lasting but higher
                                                                                             cost reconstructions and more moderately priced medium-length
                     Highway Goals                          Bridge Goals                     rehabilitation projects, as well as low-cost capital preventive maintenance
                                                                                             (CPM) work and capital scheduled maintenance (CSM) on good and
                  • 90 percent in fair or better     • 95 percent freeway bridges in         fair pavements and bridges. Early maintenance intervention with CPM
                    pavement condition.                fair or better condition.             and CSM extends the life of pavement and bridge assets by preserving
                  • 90 percent rate fair or          • 85 percent non-freeway bridges        the assets at high condition levels prior to incurring more costly repairs
                    better in ride quality.            in fair or better condition.          during later stages of asset deterioration. Once a recommended strategy

6    Michigan Department of Transportation
Program Development Call for Projects
is approved, candidate road and bridge projects are selected that are environmental concerns, and necessary permits, etc. Rough preliminary
consistent with the strategy and funds available. plans are drafted for the project during the scoping stage and these plans
are used as the beginning point for the design stage of the project.
Candidate Project Selection and Submittal
Candidate projects are selected based on a need that meets the A detailed estimate is performed based on estimated contract pay
investment strategy and program criteria. Candidate projects are items and the expected unit prices for these pay items. An inflation
prioritized by analyzing risks, life cycle costs and other factors, such as rate is applied to the estimate so that an accurate cost for the year of
the severity of the distress, the amount of traffic on the roadway, public construction can be determined.
input, maintenance costs, and the context of the roadway. For instance, Final Project Selection
a roadway that serves commercial or industrial businesses may be given When the scoping documents are completed, and a project scope and
preference over a similar roadway that does not. From the prioritized estimate are finalized, project selection can be completed. Projects are
list of projects, a list of projects is selected to proceed with scoping and selected to meet the approved strategies as closely as possible. During
estimating. This list is determined by the funds available for construction. final project selection, consideration is given to providing balance of
Scope and Estimate Candidate Projects work across the regions so that mobility for users can be provided region-
The first step in preparing the scope of a project is to review the project and wide. Other items considered during final selection include risk, life cycle
verify the proposed fix in the field. A group of technical staff is assembled costs and other factors such as the severity of the distress, the amount of
traffic, public input, maintenance costs, and the context of the roadway.
and drives the proposed project from end to end. This van tour identifies
work in addition to the pavement or bridge work; i.e., drainage work, Proposed Program Submission
sidewalk needs, safety work, access issues, etc. In addition, some project Candidate projects are submitted to the CFP subcommittees for review.
issues, such as environmental issues and utility conflicts, can be identified. Feedback is provided to the regions based on analysis of program
Crash data are also compiled and analyzed to look for areas of concern consistency with approved strategies and submittal criteria, condition
during the van tour. Other items of work not originally considered may data, appropriate fix life project estimates, and if proposed project
be added at this point in the process. For example, if a road project is budgets are within established thresholds.
proposed but no bridge work, the van tour may identify some preventive
maintenance work that can be performed on the bridges so that all the CFP Approval
needs in the corridor can be addressed in a single project. The subcommittees then recommend approval of the projects to the CFP
During this time, public input is solicited in several ways. Candidate Approval Committee, which reviews the program and recommends approval
projects are discussed with local road agencies, local governmental to the MDOT chief administrative officer and chief operations officer.
agencies, and MPOs and input is solicited from the general public either The Approval Committee is not only responsible for recommending final
through the public agencies or through project-specific input sessions. approval of the program but is the centerpiece in the MDOT processes
Once the need is verified on the van tour and additional issues are for ensuring statewide consistency and compliance. As such, the
Approval Committee is responsible for the following actions throughout
identified, a scoping document is prepared. The scoping document is
the CFP process:
a thorough analysis of all the aspects of the project and may look at
several types of fixes so the most cost-effective fix can be selected. It also • Approve program approach to Transportation System Management
analyzes several methods of maintaining traffic during construction for consistency throughout the state;
so that customer mobility can be maximized. Other items considered • Approve region and statewide condition strategies;
• Recommend CFP Program (including project list) for final
during scoping are upgrades to the operation of the roadway, complete
executive approval;
streets/context-sensitive solutions, innovative construction methods, • Provide strategic direction;
2018 Transportation Asset Management Plan 7Program Development Call for Projects
• Approve funding;
• Resolve any projects or conflicts in the CFP submittals that do not
comply with the guidelines in the CFP Letter;
• Approve changes to CFP process, tools, data, etc.; and
• Approve adding/deleting programs to the CFP.
Five-Year Transportation Program MICHIGAN DEPARTMENT OF TRANSPORTATION
Assembly of the draft Five-Year Transportation Program begins after
the CFP process is completed for the Highway Program. Each year, the
Five-Year Transportation Program is finalized when it is approved by the
STC. The document is also submitted to the Legislature. The Five-Year
Transportation Program is an integral component of the department’s
input to the Statewide Transportation Improvement Program (STIP). 2018-2022 FIVE-YEAR
The Five-Year Transportation Program schedule has recently been TRANSPORTATION PROGRAM
synchronized with the STIP schedule to allow for seamless STIP updates
by assuring that projects appear in both documents. Throughout the
year, changes to scope, schedule, and budget are submitted to the STIP
for inclusion in the bi-monthly TIP amendments by the Statewide
Transportation Planning Division (STPD).
Public Involvement and Outreach
Outreach and coordination occurs throughout the Five-Year
Transportation Program process, beginning with candidate project
selection and continuing through final project selection and review of the
draft transportation program. Stakeholders include the public, rural task
forces, MPO partners, individual units of government, and the Legislature.
Adjustments Throughout the Process
Within a strategic, proactive asset management approach to system
preservation, it is essential to monitor progress, obtain feedback, and,
when necessary, make adjustments or refinements to improve the project
selection process in future years. Within each annual cycle of the CFP
process, MDOT makes observations about the data, analytical tools,
assumptions made in the analysis, forecast condition, and the overall Approved by the State Transportation Commission on September 21, 2017
program development process, and makes the necessary modifications. Fort Street Bridge (M-85) over Rouge River
Program and project changes are also made over the course of any given
year in response to customer and stakeholder comments and changing
system needs and constraints. STPD provides a bi-weekly monitoring
report to the department to keep projects aligned to investment
categories. Additionally there are quarterly monitoring meetings for
more detailed analysis of progress in the investment categories.
8 Michigan Department of TransportationLife Cycle Planning
MDOT utilizes two pavement condition modeling tools, the Road higher RSL category. Strategies are finalized by MDOT experts
Quality Forecasting System (RQFS) and the Pavement Condition familiar with pavement deterioration and knowledge of what is
Forecasting System (PCFS), which evaluate pavement condition, best for the system. A standard inflation cost is built into RQFS
deterioration and forecasting. While these life cycle tools do not use the for accurate funding forecasting needs. MDOT uses this tool in all phases
new performance measures identified for the target setting required for of asset management, from initial investment strategy development to
the TAMP, they are used to develop and implement strategies to achieve project selection and program monitoring and reporting.
and monitor progress toward internal targets within the department.
Those internal targets help inform the decision-making process of Pavement Condition Forecasting System (PCFS)
developing targets for the TAMP. The PCFS is a spreadsheet-based Markovian model used by the TAMC
to estimate the surface condition of Michigan’s paved roads. The model
MDOT directly manages 82 percent of Michigan’s NHS system located
uses the latest four years of pavement condition ratings to calculate the
on state trunklines. There are asset management systems in place to
probability that a segment of road will deteriorate over the course of the
track condition, deterioration, and investment. The remaining 18
forecast period. In addition to pavement condition, inputs for the model
percent of Michigan’s NHS is located on the local system, which is
include such variables as pavement management strategies, anticipated
managed by 84 jurisdictions (66 cities and 18 counties). Historically,
revenues available for road construction and maintenance, and the cost of
there has been a cooperative data gathering effort through the Michigan
road repairs. PCFS is the forecasting tool that is used to model network-
Transportation Asset Management Council (TAMC) to collect and
level deterioration and forecast future condition for NHS pavements
share condition information on the entire federal-aid system, which
that are owned by county and/or local agencies in Michigan. The reason
fully encompasses the NHS, utilizing the Pavement Surface and
for a separate tool for the local NHS pavements is that RSL data are not
Evaluation Rating (PASER) process.
available on non-trunkline (local) NHS pavements. The metric that is
Road Quality Forecasting System (RQFS) currently available for local NHS is PASER condition data.
The RQFS is a network-level pavement condition model. It utilizes Pavement Surface and Evaluation Rating (PASER) System
remaining service life (RSL) as the pavement performance measure
The PASER system was originally developed by the University of
to forecast future pavement condition of the trunkline system based
Wisconsin-Madison Transportation Information Center to be used
on investment strategies. RSL is a forecasted estimate of time until a
as the state of Wisconsin’s standard road rating system. PASER is a
reconstruction or a major rehabilitation treatment is more cost-effective
“windshield” road rating system that uses a 1 to 10 rating scale, with a
than preventive maintenance. For RQFS, RSL is divided into Categories
value of 10 representing a new road and a value of 1 representing a failed
I-VI, with I being the least amount of remaining pavement life and VI
being the greatest amount of remaining pavement life. It is a tool that road. Condition ratings are assigned by evaluating the type and amount
uses RSL estimations and fix lives based on the data collected from of visual defects along a road segment while driving the segment. The
project-level deterioration curve analysis. PASER system interprets these observations into a condition rating.
There are four inputs to RQFS: the pavement condition file, investment The TAMC adopted and adapted the PASER system as the standard tool
strategies, treatment costs, and inflation. The pavement condition file for gathering information on the condition of all federal-aid-eligible
stores RSL information. The file is updated annually by MDOT staff. roads in Michigan. The information gathered by road-rating teams
The strategies entered into RQFS identify specified percentages, or lane is reported on the TAMC interactive map and dashboards using the
miles, of the pavement network to move from a lower RSL category to a following categories:
2018
2018Transportation
TransportationAsset
AssetManagement
ManagementPlan
Plan 9Life Cycle Planning
Roads with PASER ratings of 8-10 are considered to be in “Good” System (BCFS). BCFS uses the current minimum NBI conditions of the
condition and require only routine maintenance. Routine maintenance inventory as the starting point of the analysis. Anticipated budgets are
is the day-to-day maintenance activities that are scheduled, such as street entered to predict future work that will be performed on the network.
sweeping, drainage clearing, shoulder gravel grading, and sealing cracks BCFS also requires a preservation strategy to be entered that is used
to prevent standing water and water penetration. to dedicate a percentage of the budget to each primary work category.
Roads with PASER ratings of 5-7 are considered to be in “Fair” condition The primary work categories are preventive maintenance, rehabilitation
and require some form of capital preventive maintenance (CPM). CPM is and replacement. Project costs for each primary work category must be
a planned set of cost-effective treatments to an existing roadway system entered so that BCFS can calculate how many projects in each category
and its appurtenances that preserves, impedes future deterioration, and can be performed. The anticipated benefits of each main work category
maintains or improves the functional condition of the system without are entered as an input and are used to determine the impacts of the
significantly increasing structural capacity. The purpose of CPM proposed budgets. Finally, BCFS can account for programmed projects.
fixes is to protect the pavement structure, slow the rate of pavement The cornerstone of BCFS is calculating and applying transition
deterioration and/or correct pavement surface deficiencies. Surface probabilities. Using the changing minimum NBI condition rating over
treatments are targeted at pavement surface defects primarily caused by time, BCFS calculates the likelihood that a structure will change from
the environment and by pavement material deficiencies. one minimum condition rating to another. A matrix is developed from
Roads with PASER ratings of 1-4 are considered to be in “Poor” the historic data and is applied to the entire network of bridges to
condition and require structural improvements. This category includes project condition out each successive year included within the analysis.
work identified as rehabilitation and reconstruction that addresses the This projected network condition is a combination of deteriorating the
structural integrity of a road. calculated percentage of bridges in each condition rating and improving
bridges based on future projects, budgets, preservation strategies, and the
Bridge Management preservation path increasing or maintaining conditions.
MDOT performs network analyses using National Bridge Inventory For bridges, the minimum component condition rating is forecasted
(NBI) minimum condition ratings. Minimum condition ratings are using BCFS at the network level. Deterioration is performed at the bridge
found by taking the lowest condition of either the deck, superstructure, level, or in units of “each.” Average deck areas are then applied to the
substructure, or culvert ratings. MDOT uses a web-based inspection and assumed number of bridges expected to deteriorate. As the required
reporting system called MiBridge. MiBridge allows inspectors to enter measure is in square feet of deck area, there will be an increased level
both NBI and Element Level data. The system then provides inspection of uncertainty as compared to reporting in units of each. MDOT is in
data that is readily accessible by the individuals managing the bridges. the process of incorporating AASHTOWare Bridge Management as
MiBridge also allows the inventory to be viewed quickly on a dashboard, an additional tool to improve deterioration models at the bridge level
providing condition information and sorting functions that directly using a combination of component and element-level condition ratings.
connect to the condition-based goals. This allows the person performing MDOT does not anticipate having the required calibrations done in time
the analysis to evaluate bridge performance at the network level while to incorporate this advanced method for the first performance period but
being able to drill down to the bridge level. will implement the process when complete.
Bridge Condition Forecasting System (BCFS) Network-Level Deterioration Models
MDOT calculates the probability of deterioration of bridges, compares As stated previously, MDOT currently uses two network-level pavement
deterioration to investment in bridge projects, and predicts future models for deterioration and forecasting, and one model for bridges.
network condition levels using an internally developed, spreadsheet- RQFS is the tool that is used for the NHS pavements on MDOT’s state
based Markovian model titled the Bridge Condition Forecasting trunkline system.
10 Michigan Department of TransportationLife Cycle Planning
The collaboration of staffing expertise and data allows RQFS to produce (full replacement of road surface, base, and sub-base, and bridge
network-level strategies and conclusions for program development. replacement).
Reports that can be produced include pavement condition forecasts, RSL
Strategy Development and Evaluation
category information, percent of the network rehabilitated, program cost,
and detailed investment strategy showing category to category shifts for The various investment strategies are developed, analyzed and compared
reconstruction, rehabilitation, and CPM. to determine how they would impact the overall goals and objectives set
by the STC.
MDOT will continue to use NBI ratings to calculate good, fair, and poor,
and will use the BCFS to forecast conditions. Bridge condition data are, The life cycle planning tools are utilized in this process by using the
generally, collected on a biennial basis, with a subset of the population network-level deterioration models available to forecast future asset
inspected more frequently. In alignment with goals set by the STC, conditions, based on investment strategies designed to strive to meet the
most reporting has been on percentage of bridges by count, while the condition targets of each investment scenario. The models can produce
national measure is based on percentage by deck area. The department projected system condition utilizing investment level as a control.
is making the transition to deck area as part of the TAMP process. BCFS Conversely, the models can produce projected investment requirements
will be used to forecast future condition by deck area, and projects in utilizing desired system condition levels as a control. Using these models
the Five-Year Transportation Program will be compared to target dates enables MDOT to develop investment strategies that achieve the desired
to determine improvements. Based on this combination of deterioration outcome, using the most cost-efficient distribution of investments
and improvements, a fiscally constrained NHS bridge condition target between work types.
will be established.
Potential Work Types
MDOT utilizes a variety of work types to implement an asset
management based “mix of fixes” approach on both pavements and
bridges, which are applied throughout the life cycle of each asset.
The goal is to implement the correct fix at the correct time of the life
cycle at the least cost to maximize the life of the asset. The Statewide
Transportation Planning Division maintains a list of these work types.
Requests for new or modification of existing work type codes are
reviewed by MDOT’s Work Type Code Approval Committee to ensure
alignment with MDOT business practices.
MDOT tracks and evaluates pavement condition on a project-by-
project basis and uses that project-level data to develop network-level
assumptions of what sort of life-adding benefits individual fix types
can provide. These network-level assumptions are updated as needed.
As part of this process, MDOT plans to provide up-to-date cost per
lane mile information, and additional life assumptions, for the major
work types with the next submittal. Asset management work types
include initial construction (new construction), maintenance (routine
maintenance), preservation (capital scheduled maintenance of bridges,
CPM of roads), rehabilitation (repair road or bridge), and reconstruction
2018 Transportation Asset Management Plan 11Life Cycle Planning
System Stratification
In 2016, MDOT further stratified the pavement network from two tiers
(Freeway and Non-Freeway) to the following four tiers to provide a
mechanism for focusing investment on the high-volume, economically All tiers are managed by the department’s
significant roads: asset management process, but only the NHS
• Interstate related tiers are documented in the TAMP.
• Non-Interstate Freeway
• Non-Freeway NHS
• Non-NHS
This analysis will be done on a tiered basis with individual analyses for
Interstate and Non-Interstate NHS pavements, although the tools have
the capability to stratify the networks even further into more discrete
tiers. In addition, the tools have the capability to create regional strategies Figure 4
that will influence the overall statewide strategies. All tiers are managed
by the department’s asset management process, but only the NHS-related
tiers are documented in the TAMP.
Long-Term Goal
The long-term goal is to incorporate new or modify existing deterioration
and forecasting models based on the new metrics provided by the
FHWA. However, MDOT is looking for additional guidance from
FHWA on developing such a tool and does not anticipate having a tool,
or the data needed to run such a model, fully implemented for the first
performance period.
12 Michigan Department of TransportationRisk Management Process
MDOT has completed a Vulnerability Assessment of its assets and, as part to the NHS. MDOT has extensive knowledge and experience
of the upcoming Long-Range Plan, MDOT will continue to define what in identifying risks from financial to structural to disruptive
risk means for the department. MDOT has also instituted partnerships events. This effort will bring all the information into one plan
and made direct investments in systems, such as implementation of and matrix. Risk management process, definition, and matrix will be
Intelligent Transportation System (ITS) technologies, that reduce the risk developed in 2018 as one of the first Long-Range Plan deliverables.
of disruptions to the transportation system. Development of the TAMP
Assessing risk on portions of the NHS that are part of county, city,
provides an opportunity to bring those studies together and create a
or village road networks will be accomplished through a cooperative
comprehensive risk management plan.
process working closely with the agencies that have NHS mileage in
Repeatedly Damaged Assets their jurisdictions. MDOT already works with those same cities and
The initial review of the past 20 years, as required by 23 CFR Part 667.5, counties to evaluate the condition of all federal-aid eligible roads in their
has found no instance of the same roadway section or bridge having jurisdiction through a process developed by the TAMC.
been repaired more than once using FHWA Emergency Relief Program MDOT will develop a risk management plan based on the following
Funding. MDOT has reviewed its records and will continue to monitor, principles:
record, and issue reports regarding the use of FHWA Emergency Relief • Identify disruptive events and risks;
Program Funding, as required by the Transportation Asset Management
Plan regulations. • Estimate the likelihood that each of those events might actually
happen;
Creating a Risk Management Plan • Identify options to minimize the likelihood of the negative events
23 CFR 515.7c requires that a state’s asset management plan includes occurring, or reducing the magnitude of the negative impacts; and
both a risk matrix and a risk mitigation plan. • Estimate the costs to implement each of those options; strategies
While MDOT has already incorporated many aspects of risk for recovering from unanticipated events.
management into its planning and operations practices, the TAMP Below is a preliminary set of risks that can affect condition of NHS
will provide an opportunity to develop a comprehensive management pavements and bridges in Michigan.
plan and matrix. The management plan will incorporate existing
• Federal and State Funding for NHS Routes
activities such as emergency bridge repair practices, asset vulnerability
assessments, emergency response practices, the Great Lakes Regional • Recurring Congestion Events
Transportation Operations Coalition, Southeast Michigan Transportation • Non-Recurring Congestion Events
Operations Center (SEMTOC), West Michigan TOC (WMTOC), • Infrastructure Failure Events
Blue Water Bridge TOC, Statewide TOC (STOC), ITS messaging, and
financial planning into one document that will serve the department and • Disruptive and Unpredicted Events
the residents of Michigan. • Extreme Weather and Climate Events
As part of the 2045 Long Range-Plan, MDOT will conduct an internal The risk management plan and matrix will be coordinated within the
workshop to identify all actions related to risk management and to define Bureau of Planning with coordination from the Bureau of Field Services,
what risk means to the department. This information will be used to Bureau of Finance, Bureau of Development and approved by the MDOT
identify how these areas can work together to address and mitigate risks Executive Team.
2018 Transportation Asset Management Plan 1314 Michigan Department of Transportation
Inventory and Condition Analysis
Michigan’s NHS is a vital network of roads that supports the mobility of its              Pavement Condition
citizens, as well as the vitality of the state economy. While MDOT manages                MDOT’s business process utilizes RSL as the primary
most of the state’s NHS, approximately one-fifth of the network is maintained             performance measure for evaluating current and forecasting
by local transportation agencies at the county or municipal level.                        future pavement condition. However, RSL data are not collected by local
                                                                                          agencies. For the NHS roads that are locally owned, pavement condition
Inventory
                                                                                          is evaluated using the PASER performance measure, consistent with the
Figure 5 summarizes the NHS pavement infrastructure maintained in                         data collection practices of the Michigan TAMC.
the state of Michigan. This table indicates the number of lane miles of
Interstate and Non-Interstate NHS pavement in Michigan. In addition,                      This differentiation in performance measure is displayed in Figure 7.
the ownership of those pavements is also identified.                                      MDOT manages the entire Interstate system, and condition data are
                                                                                          shown exclusively using RSL data. Since the Non-Interstate NHS system
Figure 5: Michigan 2016 NHS Pavement Inventory                                            is owned by several agencies including MDOT, both RSL and PASER
                                                                                          information is displayed according to pavement ownership. A combined
 State of Michigan 2016 NHS Pavement Inventory                                            non-Interstate NHS condition is also shown using a blend of the RSL and
                                                                                          PASER data.
              Route Type                            Lane Miles              Route Miles

 Interstate (State-Owned)                             6,326                    1,252      Figure 7: Michigan NHS 2016 Pavement Conditions

 Non-Interstate NHS                                   18,546                   5,173       State of Michigan 2016 NHS Current Pavement Condition
                                                                                                                                    Good                     Fair                    Poor
     State-Owned                                      13,678                   3,974
                                                                                           Route Type                     Percent of          Lane Percent of       Lane    Percent of      Lane
     Locally Owned                                    4,868                    1,198
                                                                                                                          Network             Miles Network         Miles   Network         Miles
Source: MDOT Statewide Systems Management Section

Figure 6 summarizes the deck area of NBI structures carrying the NHS                       Interstate (RSL)                   48%             3,033    37%          2,315       15%          977
system in the state of Michigan. This table shows the breakdown between
                                                                                           Non Interstate
the Interstate and Non-Interstate NHS systems.
                                                                                           NHS                                32%             5,949    45%          8,281       23%         4,316
Figure 6: Michigan 2016 NHS Bridge Inventory                                               (Combined)
 State of Michigan 2016 NHS Current Bridge Condition                                          State-Owned
                                                                                                                              38%             5,170    45%          6,139       17%         2,369
                                                                                              (RSL)
                                                        Deck Area (sq. ft.) Number  of
                           Owner                                             Bridges          Locally Owned
                                                                                                                              16%             779      44%          2,142       40%         1,947
 Interstate                                                    18,970,912        1,226        (PASER)
                                                                                          Source: MDOT Statewide Systems Management Section
 Non-Interstate NHS                                            18,679,349        1,766
     State-Owned                                               14,250,625        1,529
     Bridge Authorities and Local Agencies                     4,428,724          237
Source: MDOT Statewide Systems Management Section                                                                                                       2018
                                                                                                                                                        2018Transportation
                                                                                                                                                             TransportationAsset
                                                                                                                                                                           AssetManagement
                                                                                                                                                                                 ManagementPlan
                                                                                                                                                                                           Plan     15
Inventory and Condition Analysis
Figure 8: Interstate RSL Pavement Condition 2007-2016
For the Interstate system, pavement condition has remained relatively
MDOT Historic Interstate RSL Pavement Condition
2007‐2016 stable for the past decade. However, large amounts of fair pavements have
100%
the potential to fall into poor condition in future years.
90%
80%
70%
60%
50%
40%
30%
20%
10%
0%
2007 2008 2009 2010 2011 2012 2013 2014 2015 2016
Good Fair Poor
Source: MDOT Statewide Systems Management Section
Figure 9: Non-Interstate RSL Pavement Condition 2007-2016
Historic Non‐Interstate NHS RSL/PASER Pavement Condition
The Non-Interstate NHS network’s overall condition remained relatively
2007‐2016 stable from 2006 through 2010. However, since 2011 there has been
a steady decline in good pavements that have transitioned to fair and
100%
90%
then poor condition. Like the Interstate system, the high percentage of
80% pavement in fair condition creates a future risk for increased amounts of
70%
Non-Interstate segments falling into poor condition.
60%
50%
40%
30%
20%
10%
0%
2007 2008 2009 2010 2011 2012 2013 2014 2015 2016
Good Fair Poor
Source: MDOT Statewide Systems Management Section
16 Michigan Department of TransportationInventory and Condition Analysis
Figure 10: Historic Pavement Condition 2007-2016
Figure 10: shows both the Interstate and Non-Interstate NHS systems’
historic pavement condition by percent of the system in good or fair
condition. For both the Interstate and Non-Interstate freeway systems,
pavement condition has declined in the past decade.
Source: MDOT Statewide Systems Management Section
Bridge Condition
Jurisdiction of bridges is split between MDOT and local agencies, similar to NHS pavements. Unlike pavements, this split has no impact on
reporting bridge condition. Regardless of ownership, all NHS bridges are evaluated using the NBI scale.
Figure 11: Michigan 2016 NHS NBI Bridge Conditions
State of Michigan 2016 NHS Current NBI Bridge Condition by Deck Area
Good Fair Poor
Owner
Deck Area Percent Deck Area Percent Deck Area Percent
Interstate (Trunkline Only) 6,159,678 32% 10,584,061 56% 2,227,173 12%
Non-Interstate NHS 6,872,776 37% 10,403,484 56% 1,403,089 8%
State-Owned 11,145,968 34% 18,568,765 56% 3,221,383 10%
Bridge Authorities and Local Agencies 782,324 32% 1,197,624 49% 446,003 18%
Total 13,032,454 35% 20,987,545 56% 3,630,262 12%
Source: MDOT Statewide Systems Management Section
2018 Transportation Asset Management Plan 17Inventory and Condition Analysis
In the past decade, investments in Interstate bridges have decreased the Figure 14 shows the percent of deck area in good or fair condition based
amount of poor deck area on bridges in that network. However, large on historic NBI data. Both Interstate and Non-Interstate NHS bridge
amounts of bridge deck area in fair condition do exist. conditions have dramatically improved over the past two decades;
however, in recent years they have leveled out.
Figure 12: Historic Interstate NBI Bridge Conditions 2007 - 2016 Figure 14: NBI Bridge Condition 2007-2016
Michigan Historic Interstate NBI Bridge Condition By Deck Area 2007-2016
100.0%
90.0%
80.0%
70.0%
60.0%
50.0%
40.0%
30.0%
20.0%
10.0%
0.0%
2007 2008 2009 2010 2011 2012 2013 2014 2015 2016
Good Fair Poor
Source: MDOT Statewide Systems Management Section
The same trend can also be seen for Non-Interstate NHS bridges. Poor
bridge deck area has decreased, but the large number of fair deck area
remains a potential concern for the future.
Source: MDOT Statewide Systems Management Section
Figure 13: Non-Interstate NHS NBI Bridge Conditions 2007-2016
Michigan Historic Non-Interstate NBI Bridge Condition By Deck Area 2007-2016
100%
90%
80% Poor bridge deck area has
70%
60%
decreased, but the large
50% number of fair deck area
40%
30% remains a potential concern
20%
10%
for the future.
0%
1 2 3 4 5 6 7 8 9 10
Good Fair Poor
Source: MDOT Statewide Systems Management Section
18 Michigan Department of TransportationFinancial Plan
This Financial Plan chapter describes the sources of funding available freight. MAP-21 also transformed federal highway and transit
for Interstate and NHS pavement and bridge investment, how future programs through the establishment of a performance-based
revenues available for capital improvements are estimated as part of approach to decision-making. The FAST Act supports this
the financial plan development process, how the value of capital assets initiative by funding efforts to collect and manage data for performance
is determined, and how the cost of work to sustain those assets is analysis, and to improve the capacity of transportation agencies to better
calculated. It also provides 10-year projections of revenue available for link investments with outcomes.
capital investment in Interstate and NHS pavements and bridges based Reliance on non-transportation revenue to support investments in
on the best available data. surface transportation is continued in the FAST Act. It transfers $70
Identifying Funding Sources and Estimating Funding Levels billion from the federal General Fund into the federal Highway Trust
Fund (HTF) to ensure that all the investments in highways and transit
Funding for the NHS system is comprised of federal aid, state revenue
during its five-year duration are fully paid for. Federal revenue beyond
and local revenue. The Statewide Transportation Planning Division
2020 is estimated to grow at the rate assumed throughout the FAST Act.
(STPD) develops funding estimates.
Federal aid accounts for about 65 percent of the MDOT’s Highway
Funding Sources Capital Program, on average. In Michigan, PA 51 of 1951 (Act 51)
Federal Transportation Funding prescribes the amount of federal aid to be utilized by the MDOT system
Federal-aid revenue is based on Fixing America’s Surface Transportation and the local system. Act 51 states MDOT’s share of federal aid is 75
(FAST) Act funding available for Michigan. Revenue estimates for the percent of the federal apportionment and the local share is 25 percent, to
FAST Act are provided by the Federal Highway Administration (FHWA) be used on federal-aid-eligible roads.
on their website, and by apportionment and obligation authority notices State Transportation Funding
that are provided by FHWA Michigan Division.
State revenue estimates are based on MDOT’s share of the Michigan
On Dec. 4, 2015, the FAST Act was signed into law. This legislation replaces Transportation Fund (MTF), as estimated by consensus with the
the Moving Ahead for Progress in the 21st Century (MAP-21) Act, which Michigan Department of Treasury, Economic and Revenue Forecasting
expired on Sept. 30, 2014. The FAST Act authorizes the investment of Division. Future state revenues are forecasted using a long-range
$305 billion in federal funding in the nation’s surface transportation forecasting model managed by MDOT’s STPD. New state transportation
system for five years, through fiscal year (FY) 2020. The legislation breaks revenues from legislation passed in November 2015 are included. The
the cycle of short-term funding authorizations that characterized the state forecast assumes an annual “dedicated income tax revenue” transfer
federal program in the recent past. In covering nearly five full fiscal years, at the FY 2021 level to continue. Estimated annual amounts are in year of
it represents the longest surface transportation authorization bill enacted expenditure dollars.
since 1998.
The state has experienced challenges in providing adequate
The FAST Act builds on the reforms included in MAP-21, which transportation funding. For many years, Michigan had difficulty finding
was put in place in 2012. MAP-21 increased the emphasis on freight state and local funds to match federal aid. State General Fund dollars
by encouraging agencies to have greater interaction with freight were used in 2014 - 2016 to assure that MDOT did not lose available
stakeholders and engage in specific freight planning efforts. The FAST federal aid.
Act continues this focus on freight by creating two new programs to
better target investments to projects that promote efficient movement of
2018 Transportation Asset Management Plan 19Financial Plan
per year for the MTF. Starting in FY 2019, $150 million in income tax
revenues will be appropriated for roads, increasing to $325 million in FY
2020, and then $600 million in FY 2021. The forecasted revenue from
FY 2022 to 2025 assumes that $600 million will be transferred from
the income tax revenues every year to the MTF. These revenues will be
distributed to road agencies only, under the current Act 51 formula.
Before transportation revenue is available for trunkline road and bridge
projects, non-capital uses must be deducted from the fund. These
non-capital uses include debt service, administration, grants to other
departments, routine maintenance, and buildings and facilities. The
estimated revenue available for the NHS portion of the Trunkline Capital
Program is based on MDOT’s historic capital investment on the NHS.
Of this revenue, only a portion will be available for asset management
of pavements and bridges on the NHS. STPD and the Bureau of Bridges
generate the cost to implement investment strategies for pavements and
bridges, respectively. Department leadership approves investment levels,
which can be annually adjusted to maintain asset value.
On Nov. 10, 2015, Gov. Rick Snyder signed into law a funding package Local Transportation Revenue Sources
that provides more state transportation revenue. The nine-bill package Revenues at the local level for roads are generally held by local governing
included registration fee increases, motor fuel tax increases, and bodies. MDOT does not have jurisdiction over local roads and, therefore,
appropriations from the income tax revenue. does not maintain data regarding the revenues associated with these
The new revenue package is expected to generate $1.2 billion for roads. Funding for roads on the local level is generally a mix of federal,
transportation when it takes full effect in FY 2021: $600 million from gas state, and local general funds and/or local property taxes. Most of the
taxes and registration fees, and $600 million from income tax revenues. funding for local roads and bridges, under the jurisdiction of a county
Almost 94 percent of the new revenue will be distributed through the road commission or the jurisdiction of a city or village, comes from
Act 51 formula for road agencies: 39.1 percent for state highways, 39.1 state revenue, which is determined by the Act 51 formula distribution.
percent for Michigan’s 83 county road agencies, and 21.8 percent for 533 Federal funding is passed through from the state level for roads that are
villages and cities. eligible for funding. The Financial Plan in the TAMP estimates state and
federal funding for non-trunkline road and bridges on the NHS. No local
The gasoline tax increased from 19 to 26.3 cents per gallon on Jan. 1, general funds or local property taxes are estimated.
2017, and the diesel fuel tax increased from 15 to 26.3 cents per gallon.
The motor fuel tax was applied to natural gas (CNG) as well. Beginning These revenue estimates are based on FAST Act estimates of federal
in 2022, fuel tax rates will be tied to inflation to help remedy the decline funding to local jurisdictions for use on federal-aid-eligible local roads.
in purchasing power of the fuel tax. The state revenue estimate is based on the share of the MTF for counties,
cities, and villages, including the state revenue package that was enacted
Registration fees for most cars and trucks increased 20 percent on Jan. 1, in November 2015. Revenue for non-trunkline roads and bridges on the
2017. New electric car fees of $100 per year, and $30 per year for plug-in NHS was estimated based on the NHS road lane miles and number of
hybrid cars, equalize road-user fees for vehicles that use little or no taxed fuel. bridges as a proportion of the total Federal-Aid eligible road lane miles
The user fee increases are estimated to generate an additional $600 million and number of bridges on the local system.
20 Michigan Department of TransportationFinancial Plan
Funding Trends New Source of MTF Revenue: Michigan Income Tax Revenues
Federal Transportation Revenues Beginning in FY 2019, $150 million will be appropriated from Michigan
income tax revenues into the MTF for distribution through the Act 51
In the 10 years before passage of the FAST Act, federal funding for Michigan’s
formula for state funding. Income tax revenues will increase to $600
highways fluctuated. Apportioned program funding to Michigan first
million per fiscal year beginning in FY 2021. The forecasted income tax
exceeded $1 billion in 2004. In 2016, apportioned program funding to
revenue of $600 million annually from FY 2022 to 2025 is included based
Michigan still barely exceeded $1 billion. The FAST Act is expected to
on current state law, with this revenue distributed to road agencies under
break this trend of level funding by providing a modest increase through
the current Act 51 formula.
FY 2020. These increases are assumed to continue through FY 2025, as the
plan assumes a 2 percent growth rate through this period. Estimating Funding Levels
State Transportation Revenues Trunkline Capital Program
Act 51 established the MTF as the means of collecting and distributing The FY 2016 - 2025 federal-aid revenues are based on FAST Act
state transportation revenues. For many years, the main sources of MTF estimates of federal funding available for Michigan. Federal funding
funding were motor fuel taxes and vehicle registration fees. As detailed beyond FY 2020 is estimated to grow about 2 percent annually, which
above, state transportation funding in the coming years is shifting is the rate assumed throughout the FAST Act. The intent of Act 51
from two sources to three. In 2019, funds from Michigan income tax regarding federal highway aid is to distribute approximately 25 percent of
revenues will transfer into the MTF to augment the funding available for federal aid to local jurisdictions for use on federal-aid-eligible local roads,
transportation within the state. with the remainder to be used by MDOT.
State Fuel Tax Trends State revenue estimates are based on MDOT’s share of the MTF, as
estimated by consensus with the Michigan Department of Treasury,
Between 2005 and 2014, Michigan’s fuel tax revenues were flat or
Economic and Revenue Forecasting Division.
declining. In 2012, collected gasoline revenues declined to their lowest
point since 1997. In 2013 and 2014, gallons sold remained flat, but in Future state revenues are forecasted using a long-range forecasting model
2015 gasoline revenues increased by about 5 percent, and by 1 percent managed by MDOT’s STPD. The forecasting model is a multi-factor
in 2016. Some of this increase can be attributed to the decrease in driven process which includes vehicle miles of travel, historical revenue
fuel prices, and an uptick in economic activity. Long-term state fuel trends, fuel prices, number of passenger and commercial vehicles,
tax revenues are still forecasted to decline as mile per gallon increases registration fees, fleet MPG, et al. State revenue included $113 million
continue across the vehicle fleet. in one-time General Fund redirection to the State Trunkline Fund (STF)
in FY 2016 in order to match all available federal aid. In addition, it
State Vehicle Registration Tax Trends included $101.8 million in FY 2016, which also is a portion of a one-time
Most of the vehicle registration tax in the state is based on “ad valorum” redirection from the General Fund. Additional revenue was added to the
vehicles. These vehicles include the model year 1983 and newer. Their overall revenue available, based on the new state revenue package. The
tax is calculated on the “base price” of the vehicle; therefore, as long as forecasted revenue from FY 2022 to 2025 assumes that $600 million will
the price of vehicles are increasing steadily, and Michigan drivers are be transferred from income tax revenue every year to the MTF, with these
purchasing new cars, the registration taxes will reflect growth. Vehicle revenues distributed to road agencies under the current Act 51 formula.
registration revenues have been increasing in Michigan annually. The last The state Legislature has recently added $175 million as a supplemental
time they reflected declines was in 2008 and 2009 due to the state and transportation appropriation. These funds were added after this financial
national economic downturn. analysis was completed and were not included in the funding estimate.
2018 Transportation Asset Management Plan 21You can also read