INNERGEX RENEWABLE ENERGY INC. (TSX: INE)
←
→
Page content transcription
If your browser does not render page correctly, please read the page content below
INNERGEX RENEWABLE
ENERGY INC.
(TSX: INE)
MAY 2016
CAUTIONARY STATEMENTS
FORWARD-LOOKING INFORMATION
This document contains forward-looking information within the meaning of securities legislations (“Forward-Looking Information”), which can generally be identified by
the use of words such as “projected”, “potential”, “expect”, “estimate”, or other comparable terminology that states that certain events will or will not occur. It represents
the estimates and expectations of the Corporation relating to future results and developments as of the date of this document. It includes future-oriented financial
information, such as projected Adjusted EBITDA, estimated project costs and expected project financing, Free Cash Flow and Payout Ratio to inform readers of the
potential financial impact of commissioning existing development projects. This information may not be appropriate for other purposes. Forward-Looking Information in
this document is based on certain key assumptions made by the Corporation, including those concerning hydrology, wind regimes and solar irradiation, performance of
operating facilities, financial market conditions, and the Corporation’s success in developing new facilities.
The material risks and uncertainties that may cause actual results and developments to be materially different from current expressed Forward-Looking Information are
referred to in the Corporation's Annual Information Form in the “Risk Factors” section and include, without limitation: the ability of the Corporation to execute its strategy
for building shareholder value; its ability to raise additional capital and the state of capital markets; liquidity risks related to derivative financial instruments; variability in
hydrology, wind regimes and solar irradiation; delays and cost overruns in the design and construction of projects, uncertainty surrounding the development of new
facilities; variability of installation performance and related penalties; and the ability to secure new power purchase agreements or to renew existing ones. The principal
assumptions, risks and uncertainties concerning specific Forward-Looking Information contained in this document are more fully outlined on page 24.
Although the Corporation believes that the expectations and assumptions on which forward-looking information is based are reasonable, readers of this document are
cautioned not to rely unduly on this Forward-Looking Information since no assurance can be given that it will prove to be correct. The Corporation does not undertake
any obligation to update or revise any Forward-Looking Information, whether as a result of events or circumstances occurring after the date of this document, unless
required by legislation.

NON IFRS MEASURES
Adjusted EBITDA, Free Cash Flow and Payout Ratio are not measures recognized by International Financial Reporting Standards (IFRS) and have no meaning
prescribed by it. References to “Adjusted EBITDA” are to revenues less operating expenses, general and administrative expenses and prospective project expenses.
References to “Free Cash Flow” are to cash flows from operating activities before changes in non-cash operating working capital items, less maintenance capital
expenditures net of proceeds from disposals, scheduled debt principal payments, preferred share dividends declared and the portion of Free Cash Flow attributed to
non-controlling interests, plus cash receipts by the Harrison Hydro Limited Partnership for the wheeling services to be provided to other facilities owned by the
Corporation over the course of their power purchase agreement, plus or minus other elements that are not representative of the Corporation’s long-term cash
generating capacity, such as transaction costs related to realized acquisitions (which are financed at the time of the acquisition) and realized losses or gains on
derivative financial instruments used to hedge the interest rate on project-level debt or the exchange rate on equipment purchases. References to “Payout Ratio” are to
dividends declared on common shares divided by Free Cash Flow. Readers are cautioned that Adjusted EBITDA should not be construed as an alternative to net
earnings and Free Cash Flow should not be construed as an alternative to cash flows from operating activities, as determined in accordance with IFRS.
Innergex believes that these indicators are important, as they provide management and the reader with additional information about the Corporation's production and
cash generation capabilities, its ability to sustain current dividends and dividend increases and its ability to fund its growth. These indicators also facilitate comparison
of results over different periods.

ALL AMOUNTS SHOWN ARE IN CANADIAN DOLLARS.

                                                                                                            INVESTOR PRESENTATION                            MAY 2016        2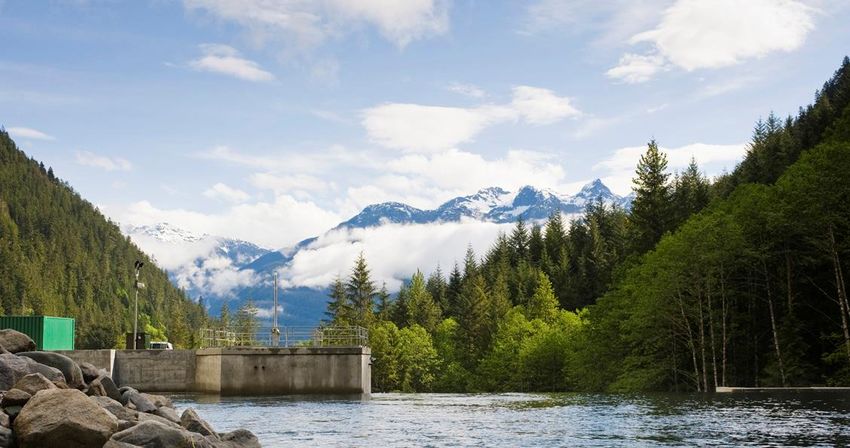
STRATEGY AND           GROWTH
     OVERVIEW              MARKET DYNAMICS      BUSINESS MODEL         PROSPECTS          FINANCIALS         SUMMARY

COMPANY SNAPSHOT
• Innergex is a leading independent renewable power producer based in Canada

                                      FOUNDED                    FIRST IPO          25TH ANNIVERSARY
           HISTORY
                                     1990                       2003                   2015
          SOURCES OF                                   INSTALLED                     MARKETS
                                                       CAPACITY
          RENEWABLE ENERGY                                                           QUEBEC, ONTARIO
                                                       1,318          MW             AND BRITISH COLUMBIA,
                                                                                     CANADA

         HYDRO           WIND    SOLAR
                                                       (803 MW NET)                  IDAHO, USA
                                                                                     FRANCE

          PUBLIC LISTING                     DIVIDEND / YIELD        INVESTMENT GRADE          MARKET CAP*
                                                                     CREDIT RATING

          TSX:INE                             $0.64                  BBB- (S&P)                $1.5 billion
                                                                                               ENTERPRISE VALUE
          PART OF THE S&P/TSX
                                              4.62%
          COMPOSITE INDEX
                                                                                               $3.7 billion
              SERIES A                  SERIES C                4.25% CONVERTIBLE
          PREFERRED SHARES          PREFERRED SHARES                DEBENTURES
             INE.PR.A                    INE.PR.C                INE.DB.A

*As at April 29, 2016.

                                                                                     INVESTOR PRESENTATION             MAY 2016   3
STRATEGY AND     GROWTH
   OVERVIEW      MARKET DYNAMICS    BUSINESS MODEL   PROSPECTS        FINANCIALS         SUMMARY

HIGHLIGHTS
• Consistent and predictable cash flows
  from high quality, long-life contracted assets

• Pure play in renewable energy
  with a focus on hydro assets

• Strong management
  with over 25 years of development and operations experience, engineering expertise,
  and financial acumen

• Growth
  from projects currently under development in Canada and from an international expansion strategy into
  Latin America and Europe (in April 2016, acquisition of seven wind warms in France for a total
  installed capacity of 87 MW)

• Dividend
  that is sustainable and growing

• Low-risk business model with a stable and growing dividend

                                                                 INVESTOR PRESENTATION             MAY 2016   4
STRATEGY AND GROWTH
OVERVIEW MARKET DYNAMICS BUSINESS MODEL PROSPECTS FINANCIALS SUMMARY
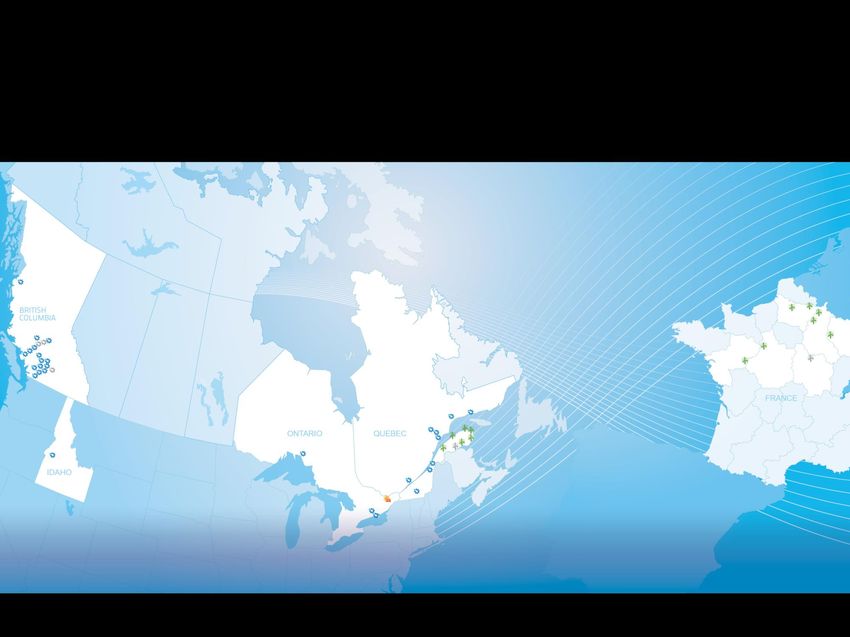
MAP OF OPERATIONS
• Based in Canada, in France and in USA, Innergex is a pure play in renewable energy
with a focus on hydro assets.
IN OPERATION UNDER CONSTRUCTION
NUMBER NUMBER
MW MW
OF SITES OF SITES
NET GROSS NET GROSS
28 447 584 3 112 147
13 323 701 1 75 150
1 33 33 - - -
42 803 1,318 4 187 297
LEGEND
Hydro Under
Wind construction
Solar
INVESTOR PRESENTATION MAY 2016 5
STRATEGY AND                   GROWTH
             OVERVIEW                 MARKET DYNAMICS                BUSINESS MODEL                 PROSPECTS                    FINANCIALS               SUMMARY

       FRANCE PORTFOLIO OVERVIEW
                                                                                                                         Gross                                                     Off-Taker
                                                                                                Project                                 COD           PPA Expiry     Off-Taker
                                                                                                                        Capacity                                                 Credit Rating
                                              Beaumont
                                 Bois des                                                                                 (MW)          (year)          (year)                         (S&P)
                                 Cholletz            Porcien                     Operating
                                         PICARDIE
                                                                                  Porcien                                   10.0         2009            2024          EDF              A+
                                               Longueval
                                                          Vallottes               Longueval                                 10.0         2009            2024          EDF              A+
                                                 CHAMPAGNE- LORRAINE
                                                 ARDENNE                          Antoigné                                   8.0         2010            2025          EDF              A+
                                      Bois                                        Vallottes
                  Antoigné          d’Anchat
                                                                                                                            12.0         2010            2025          EDF              A+
                                                Yonne
                                   CENTRE        BOURGOGNE                        Bois d’Anchat                             10.0         2014            2029          EDF              A+
                   PAYS DE
                   LA LOIRE                                                       Beaumont                                  25.0         2015            2029          EDF              A+
                                                                                  Bois des Cholletz                         11.8         2015            2030       SICAE Oise     Unrated
                                                                                 Total Operating                            86.8
                                           FRANCE
                                                                                 Construction
                                                                                  Yonne                                     44.0         2017            2032          EDF              A+
                                                                                 Total                                     130.8

    Operating                                                                            Breakdown by Project                         Off-Taker                    Turbine Manufacturer
    Under Construction                                                                       (Gross MW)                              (Gross MW)                        (Gross MW)

                                                                                                    6%                               12 MW
                                                                                               8%                                                                    25 MW
•   8 wind projects with a combined gross capacity of 131 MW
•   87 gross MW of installed capacity from seven projects                                8%                     33%

•   44 gross MW of capacity in construction from one project                          8%            131 MW                            131 MW                              131 MW
•   Weighted average remaining term of PPAs of 13 years, mainly
    with A+ rated EDF                                                                     9%
                                                                                                                                                                                  106
                                                                                                9%        19%                                 119                                 MW
                                                                                                                                              MW

                                                                                  Yonne1                     Beaumont
                                                                                  Vallottes                  Bois des Cholletz           EDF                                 Enercon
                                                                                  Porcien                    Longueval                   SICAE Oise                          Nordex
                                                                                  Bois d’Anchat              Antoigné
1Theclosing of the acquisition of this project is anticipated after it reaches
commercial operation.

                                                                                                                      INVESTOR PRESENTATION                           MAY 2016     6      6
STRATEGY AND                   GROWTH
   OVERVIEW              MARKET DYNAMICS          BUSINESS MODEL                 PROSPECTS          FINANCIALS                  SUMMARY

PRODUCTION PROFILE
• Multiple energy sources and regions reduce our exposure to variability in water, wind and solar regimes
  and to any one market

                                                                                                                                 USA     ON
                                                                Solar                                                             1%     2%
      BY SOURCE OF                 ENERGY1                       1%                BY   REGION1
                                                Wind
                                                32%
                                                                                                                           BC                     QC
                                                           2017                                                           49%          2017       42%

                                                                         Hydro
                                                                          67%
                                     Solar                                                         Idaho, USA    Ontario
                                                                                                                                         France
                                     1%                                                                 2% 3%                              6%
                Wind
                25%

                                                                                     British
                                                                                   Columbia                                             Québec
                                   2016                                                                   2016
                                                                                     49%                                                41%

                                                       Hydro
                                                       74%                                                       France
   1 Based   on consolidated long term average production, annualized.                                           5%
• Diversification of revenues is an important risk management tool

                                                                                               INVESTOR PRESENTATION                      MAY 2016      7
STRATEGY AND GROWTH
OVERVIEW MARKET DYNAMICS BUSINESS MODEL PROSPECTS FINANCIALS SUMMARY
2011-2015 FINANCIAL HISTORY
Power generated (GWh) Revenues ($M) Total assets ($M) Share price at
Long-term debt ($M) year-end
247
242
2 987 $11,36 $11,33
2 962
$10,60
198
$10,30 $10,35
177
2 382
2 105
148
3 128
1 905
2 716
2011 2012 2013 2014 2015
2 377
2011 2012 2013 2014 2015
2 296
2 215
Free Cash Flow ($M) $0,62
Adjusted EBITDA ($M) Common share
2 005
dividend ($) $0,60
$0,58 $0,58 $0,58
1 645
74
184
180
68
1 340
59
1 231
149
134
1 026
44
111
39
2011 2012 2013 2014 2015 2011 2012 2013 2014 2015 2011 2012 2013 2014 2015
INVESTOR PRESENTATION MAY 2016 8STRATEGY AND GROWTH
OVERVIEW MARKET DYNAMICS BUSINESS MODEL PROSPECTS FINANCIALS SUMMARY
LEVELIZED COST OF ENERGY (LCOE)
• Renewable energy is cost-competitive with other sources of energy, including natural gas
300,00
250,00
200,00
$/MWH
150,00
100,00
50,00
0,00
Nuclear Solar PV Natural Onshore Coal Large Small
Gas Wind Hydro Hydro
ENERGY SOURCES
Source: Bloomberg, Q2 2015 (Americas datas)
• Costs for wind and solar continue to decline and are increasingly competitive
INVESTOR PRESENTATION MAY 2016 9STRATEGY AND GROWTH
OVERVIEW MARKET DYNAMICS BUSINESS MODEL PROSPECTS FINANCIALS SUMMARY
STRATEGY
Our strategy for building shareholder value is to develop or acquire high-quality facilities that generate
sustainable cash flows and provide an attractive risk-adjusted return on invested capital, and to
distribute a stable dividend.
• Remain exclusively in renewable energy
• Ensure strategic priorities conform to sustainable business practices
• Consolidate leadership position in Canada
• Expand into selected target markets internationally
• Develop partnerships which differentiate us, especially with First Nations and local communities
• Focus on key performance indicators:
Equipment availability, Project IRRs, Adjusted EBITDA, Free Cash Flow, and Payout Ratio
• Distribute a stable and growing dividend to our shareholders
INVESTOR PRESENTATION MAY 2016 10STRATEGY AND GROWTH
OVERVIEW MARKET DYNAMICS BUSINESS MODEL PROSPECTS FINANCIALS SUMMARY
SUSTAINABLE DEVELOPMENT
• Our mission is to increase our production of renewable energy by developing and operating high-
quality facilities while respecting the environment and balancing the best interests of the host
communities, our partners, and our investors
SOCIAL RESPECT FOR CORPORATE
ACCEPTABILITY THE ENVIRONMENT PROFITABILITY
OF PROJECTS AND AVOID, MINIMIZE, MITIGATE STABILITY AND GROWTH
SOCIO-ECONOMIC BENEFITS OR COMPENSATE FOR ANY OF DIVIDENDS TO HOLDERS
FOR THE COMMUNITIES AND IMPACT ON THE SURROUNDING OF COMMON SHARES
OUR PARTNERS ECOSYSTEM
• We believe that the three pillars of sustainability are mutually reinforcing
INVESTOR PRESENTATION MAY 2016 11STRATEGY AND GROWTH
OVERVIEW MARKET DYNAMICS BUSINESS MODEL PROSPECTS FINANCIALS SUMMARY
EXISTING PARTNERSHIPS
• We have the ability and the expertise to create partnerships that work
FIRST NATIONS AND LOCAL COMMUNITIES CORPORATIONS FINANCIAL INSTITUTIONS
23 MW 50 MW 114 MW 150 MW
UMBATA FALLS KWOIEK CREEK CREEK POWER HARRISON LP
ONTARIO BRITISH COLUMBIA BRITISH COLUMBIA BRITISH COLUMBIA
49-51% 50-50% 662/3-331/3% 50-50%
PARTNER: PARTNER: OWNER OF FITZSIMMONS CREEK, BOULDER OWNER OF THE DOUGLAS CREEK,
OJIBWAYS OF THE KANAKA BAR CREEK AND UPPER LILLOOET RIVER HYDRO FIRE CREEK, LAMONT CREEK,
FACILITIES STOKKE CREEK, TIPELLA CREEK, AND
PIC RIVER FIRST NATION INDIAN BAND
UPPER STAVE RIVER FACILITIES
PARTNER:
25 MW PARTNER:
150 MW LEDCOR POWER GROUP LTD
CC&L AND LPF
VIGER-DENONVILLE MESGI’G UGJU’S’N (SURFSIDE) DEVELOPMENT
QUÉBEC QUÉBEC
590 MW
50-50% 50-50% CARTIER WIND ENERGY 31 MW
PARTNER: PARTNER: QUÉBEC
SM-1
RIVIÈRE-DU-LOUP RCM MI’GMAQ FIRST NATIONS 38-62%, 50-50% MANAGEMENT QUÉBEC
OF QUEBEC OWNER OF BAIE-DES-SABLES, L’ANSE-À-
VALLEAU, CARLETON, MONTAGNE SÈCHE AND 50-50%
41 MW 16 MW GROS-MORNE FACILITIES PARTNER:
MAGPIE WALDEN NORTH PARTNER: DESJARDINS PENSION PLAN
QUÉBEC BRITISH COLUMBIA TRANSCANADA CORP.
70-30% VOTING RIGHTS 51-49%
PARTNER: MINGANIE RCM PARTNER: SEKW'EL'WAS
CAYOOSE CREEK BAND
• Our partnerships are a competitive differentiator, especially those with First Nations and local communities
INVESTOR PRESENTATION MAY 2016 12STRATEGY AND GROWTH
OVERVIEW MARKET DYNAMICS BUSINESS MODEL PROSPECTS FINANCIALS SUMMARY
KEY PERFORMANCE INDICATORS
PRODUCTION PREDICTABILITY PAYOUT RATIO (IN %)
120
2015 98% 115
2014
110
2013
2012
2011 100
2010 93
2009 90 88 86
2008
2007 80 TARGET
2006 70-80%
2005 AVERAGE 2003-2015
70
2004 99%
2003
60
GWh
50
Long-term average production Actual production 2012 2013 2014 2015
AVAILABILITY OF EQUIPMENT RISK-RETURN RELATIONSHIP
100 99 TARGET IRR
98 98
97 97 97
96 96
95 95 95 12%
TARGET
95 & UP
95% EV/EBITDA PROSPECTIVE
IS NOT A PROJECT
90 KPI WITHOUT PPA
DEVELOPMENT
PROJECT
85 OPERATING WITH PPA
Hydro
Wind ASSET
N/A
80 Solar RISK
8%
2012 2013 2014 2015
INVESTOR PRESENTATION MAY 2016 13STRATEGY AND GROWTH
OVERVIEW MARKET DYNAMICS BUSINESS MODEL PROSPECTS FINANCIALS SUMMARY
PROJECTS UNDER CONSTRUCTION
• Projects under construction represent a 23% increase in gross installed capacity, currently at 1,318 MW
CHANGE IN
ESTIMATED
GROSS ESTIMATED COSTS AT EXPECTED CONSTRUCTION
CAPACITY CONSTRUCTION MARCH 31, 2016 IN-SERVICE COSTS SINCE
PROJECT NAME LOCATION (MW) COSTS ($M) ($M) DEC. 31, 2014 ($M)
BOULDER CREEK BC 25.3 124.1 79.8 Q2-2017 1
+17.0
UPPER LILLOOET RIVER BC 81.4 327.1 237.7 Q1-2017 1
BIG SILVER CREEK BC 40.6 206.0 191.9 Q3-2016 (10.0)
MESGI’G UGJU’S’N (MU) QC 150.0 305.0 100.6 Q4-2016 (35.0)
TOTAL 297.3 962.2 610.0 (28.0)
• We have obtained non-recourse project-level financing
for each of these projects
• We have no need for additional equity issuance to bring
these projects to commercial operation
1. COD was delayed until the spring of 2017 due to the forest fire that forced the interruption of construction activities in July and August 2015. However the Corporation
expects to be indemnified for such delays by virtue of its insurance coverage.
INVESTOR PRESENTATION MAY 2016 14STRATEGY AND GROWTH
OVERVIEW MARKET DYNAMICS BUSINESS MODEL PROSPECTS FINANCIALS SUMMARY
GROWTH DRIVERS
• Complete the four projects under construction
expected to reach commercial operation between Q3 2016 and Q2 2017, increasing gross installed capacity by 23%
• Submit projects under requests for proposals
according to programs launched by the Canadian provinces
• Advance prospective projects
with local First Nations with a view to obtaining negotiated power purchase agreements (PPAs)
• Source new growth
in target markets internationally, in Latin America and in Europe, where demand for renewable energy is strong, driven
by economic growth or the need to replace fossil fuels, and where declining costs are making renewable energy cost
competitive
• Signed a MOU with the Comisión Federal de Electricidad
to jointly study a number of renewable energy project opportunities in Mexico, with the aim to jointly develop selected
projects
• Seek acquisition opportunities
to gain a foothold in target markets internationally and to consolidate leadership position in Canada, focusing on
acquisitions which are immediately accretive to cash flows
• Targeting an Adjusted EBITDA CAGR of 30% and a Free Cash Flow CAGR of 20% for 2015-2017
INVESTOR PRESENTATION MAY 2016 15STRATEGY AND GROWTH
OVERVIEW MARKET DYNAMICS BUSINESS MODEL PROSPECTS FINANCIALS SUMMARY
FINANCIAL STRUCTURE
• We maintain a balanced capital structure
AT DECEMBER 31, 2015
Project-level debt
Preferred
shares
56%
4%
Revolving term credit facility supported
Convertible debentures by 13 unencumbered assets
Common equity at
market value 3% Saint-Paulin Montmagny Glen Miller
32% Corporate debt Brown Lake Miller Creek Portneuf 1-2-3
4% Batawa Chaudière Baie-des-Sables
Gros-Morne Walden North
• We financed all of our projects with fixed-rate non-recourse project-level debt
INVESTOR PRESENTATION MAY 2016 16STRATEGY AND GROWTH
OVERVIEW MARKET DYNAMICS BUSINESS MODEL PROSPECTS FINANCIALS SUMMARY
INTEREST RATE SENSITIVITY
• We have virtually no exposure to interest rate fluctuations
INTEREST PROJECT VALUE OF
EXPENSES IRR DERIVATIVES
DERIVATIVE DERIVATIVE
FINANCIAL FINANCIAL
INTEREST INSTRUMENTS INSTRUMENTS USED
PAYMENT ON INTEREST USED TO HEDGE TO HEDGE THE
REVOLVING PAYMENT ON THE INTEREST INTEREST RATE ON
TERM CREDIT PROJECT-LEVEL IRR OF DEVELOPMENT IRR OF PROSPECTIVE FREE CASH FLOW RATE ON EXISTING EXISTING AND
FACILITY DEBT PROJECTS PROJECTS (FCF) AND FUTURE DEBT FUTURE DEBT
Interest rate on Project-level debts Base interest rates on project Price of any power Realized gains or losses These are unrealized Offsetting entry to the
majority of are either at fixed financings for development purchase agreement arising from settlement gains and losses, unrealized gains or
revolving term rates or interest projects have been hedged secured for prospective of derivative financial which do not affect losses are recorded in
credit facility has rates have been through use of derivative projects in the future will instruments will have an Free Cash Flow owners' equity
been fixed fixed through use financial instruments. reflect prevailing interest immediate impact on
through use of of derivative When financing was rates at that time and the cash flows, and an
derivative financial secured, forward contracts expected interest rate on offsetting impact on
financial instruments were settled, resulting in a project financing will be future cash flows for
instruments realized loss on derivative hedged through use of duration of debt. These
financial instruments that will derivative financial gains or losses are
be offset by a lower interest instruments around the time excluded from the
rate on debt for its duration; construction begins calculation of the Free
this will not affect the Cash Flow as they are
economic value of project not representative of the
operating results.
NO IMPACT ON UNREALIZED EQUIVALENT
NO IMPACT PV OF FCF GAIN DECREASE IN
interest STREAM LIABILITIES
NO IMPACT ON EQUIVALENT
UNREALIZED
NO IMPACT PV OF FCF INCREASE IN
LOSS
STREAM LIABILITIES
INVESTOR PRESENTATION MAY 2016 17STRATEGY AND GROWTH
OVERVIEW MARKET DYNAMICS BUSINESS MODEL PROSPECTS FINANCIALS SUMMARY
PROJECT-LEVEL DEBT
• We use mainly fixed-rate, non-recourse project-level debt to finance our projects, which provides
added discipline and further reduces our risk profile
PROJECT DISCIPLINED APPROACH OF LENDERS
Use independent engineers to conduct a Require a major
Project debt levels are a thorough due diligence on the project’s maintenance reserve
function of the cash flows construction and operations, including account
Target generated by the project project design, construction scheduling and for the life of the debt, in
debt and essentially determined costs, and hydro/wind/solar regime which funds are invested
service by the “debt service assumptions used in determining the each year to be available
coverage coverage ratio” (EBITDA / expected long-term average production for major maintenance, to
ratio interest + principal estimates on which the project’s financial protect the debt service
in the payments) model is based
order of
Conduct an independent legal review of Require business
1.4x Project is pledged as documents and permits interruption insurance
collateral and property insurance
Repayment is scheduled Require a debt service reserve
over the life of the power Hydrology/wind reserve are set aside to
purchase agreement protect the debt service in years with
below-average hydro/wind conditions
INVESTOR PRESENTATION MAY 2016 18STRATEGY AND GROWTH
OVERVIEW MARKET DYNAMICS BUSINESS MODEL PROSPECTS FINANCIALS SUMMARY
REVOLVING TERM CREDIT FACILITY
• Our revolving term credit facility is a flexible financing tool which allows us to raise equity
and secure project-level debt when market conditions are optimal and to bridge timing
differences between construction outflows and financing inflows
• Borrowing capacity of $425M
• Supported by 13 unencumbered assets
• Maturity in 2020
• Almost 100% fixed interest rate through interest rate swaps
At December 31, 2015:
• Unused and available position of the facility was $180M
• Average all-in interest rate of 5.1%
INVESTOR PRESENTATION MAY 2016 19STRATEGY AND GROWTH
OVERVIEW MARKET DYNAMICS BUSINESS MODEL PROSPECTS FINANCIALS SUMMARY
CAPITAL ALLOCATION
• Reinvest in the business
We invest $8-11 million each year in prospective project expenses for greenfield project
development in preparation for future requests for proposals or negotiated power purchase
agreements.
• Pay a dividend and grow it over time
We intend to grow the dividend as Free Cash Flow grows.
• Make acquisitions
We seek acquisitions to expand internationally and to consolidate our leadership position in
Canada, focusing on acquisitions which are immediately accretive to cash flows.
• Use normal course issuer bid to buy back shares, as approved by the Board of Directors
We purchased for cancellation 1.2 million common shares at an average price of $10.36 in 2015,
and may continue if and when we believe the market price of common shares does not reflect their
inherent value.
• Achieve and maintain a Payout Ratio of approximately 70-80%
INVESTOR PRESENTATION MAY 2016 20STRATEGY AND GROWTH
OVERVIEW MARKET DYNAMICS BUSINESS MODEL PROSPECTS FINANCIALS SUMMARY
GUIDANCE
• In 2017, we will reach an annual run-rate that reflects our four projects currently under construction
ADJUSTED EBITDA FREE CASH FLOW
($M) ($M)
30% 20%
350 120 2015
2017
300 100
312 106 CAGR
250
80 CAGR:
200 Compound Annual
Growth Rate
60 74
150 184
40
100
50 20
0 0
INSTALLED CAPACITY 2017
2015
NET 708 1,216 GROSS NET 990 1,615 GROSS
MW MW MW MW
• Our growth is significant and measurable
INVESTOR PRESENTATION MAY 2016 21STRATEGY AND GROWTH
OVERVIEW MARKET DYNAMICS BUSINESS MODEL PROSPECTS FINANCIALS SUMMARY
INVESTMENT THESIS
• Solid track record of growth
delivering projects on time and on budget
• Strategic plan to replenish sources of long-term growth beyond 2017
by expanding into target markets internationally and consolidating leadership position in Canada
• Low-risk capital structure
balanced and flexible
• Virtually no exposure
to interest rate fluctuations
• Reinvestment and dividend growth
focus of capital allocation
• Clear performance targets
with consistent execution
• Solid growth supported by a sound capital structure
INVESTOR PRESENTATION MAY 2016 22FORWARD-LOOKING INFORMATION CONTAINED IN THIS DOCUMENT
PRINCIPAL ASSUMPTIONS PRINCIPAL RISKS AND UNCERTAINTIES
PROJECTED ADJUSTED EBITDA
For each facility, the Corporation determines an annual long-term average level of electricity production (LTA) over the expected life of the - Improper assessment of water, wind and sun resources and
facility, based on several factors that include, without limitations, historically observed water flows or wind or solar irradiation conditions, associated electricity production
turbine or panel technology, installed capacity, energy losses, operational features and maintenance. Although production will fluctuate - Variability in hydrology, wind regimes and solar irradiation
from year to year, over an extended period it should approach the estimated long-term average. The Corporation then estimates expected - Equipment failure or unexpected operations & maintenance
annual revenues for each facility by multiplying its LTA by a price for electricity stipulated in the power purchase agreement secured with a activity
public utility or other creditworthy counterparty. These agreements stipulate a base price and, in some cases, a price adjustment - Unexpected seasonal variability in the production and
depending on the month, day and hour of delivery. In most cases, power purchase agreements also contain an annual inflation adjustment delivery of electricity
based on a portion of the Consumer Price Index. The Corporation then estimates annual operating earnings by subtracting from the - Variability of facility performance and related penalties
estimated revenues the budgeted annual operating costs, which consist primarily of operators’ salaries, insurance premiums, operations - Changes to water and land rental expenses
and maintenance expenditures, property taxes, and royalties; these are predictable and relatively fixed, varying mainly with inflation except - Unexpected maintenance expenditures
for maintenance expenditures. On a consolidated basis, the Corporation estimates annual Adjusted EBITDA by adding the projected - Lower inflation rate than expected
operating earnings of all the facilities in operation that it consolidates*, from which it subtracts budgeted general and administrative - Natural catastrophe
expenses, comprised essentially of salaries and office expenses, and budgeted prospective project expenses, which are determined
based on the number of prospective projects the Corporation chooses to develop and the resources required to do so.
*Excludes Umbata Falls and Viger-Denonville accounted for using the equity method.
ESTIMATED PROJECT COSTS, EXPECTED OBTAINMENT OF PERMITS, START OF CONSTRUCTION, WORK CONDUCTED
AND START OF COMMERCIAL OPERATION FOR DEVELOPMENT PROJECTS OR PROSPECTIVE PROJECTS
For each development project, the Corporation provides an estimate of project costs based on its extensive experience as a developer, - Performance of counterparties, such as EPC contractors
directly related incremental internal costs, site acquisition costs and financing costs, which are eventually adjusted for projected costs - Delays and cost overruns in project design construction
provided by the engineering, procurement and construction contractor retained for the project. The Corporation provides indications - Obtainment of permits
regarding scheduling and construction (EPC) progress for its development projects and indications regarding its prospective projects, based - Equipment supply
on its extensive experience as a developer. - Relationships with stakeholders
- Regulatory and political risks
- Interest rate fluctuations and financing risk
- Higher inflation rate than expected
- Natural catastrophe
EXPECTED PROJECT FINANCING
The Corporation provides indications of its intention to secure non-recourse project-level debt financing for its development projects, based - Interest rate fluctuations and financing risk
on the expected LTA production and the expected costs of each project, expected power purchase agreement term, a leverage ratio of - Financial leverage and restrictive covenants governing current
approximately 75%-85%, as well as its extensive experience in project financing and its knowledge of the capital markets. and future indebtedness
PROJECTED FREE CASH FLOW AND PAYOUT RATIO
The Corporation estimates Free Cash Flow as projected cash flow from operations before changes in non-cash operating working capital - Adjusted EBITDA below expectations caused mainly by the
items, less estimated maintenance capital expenditures net of proceeds from disposals, scheduled debt principal payments, preferred risks and uncertainties mentioned above and by higher
share dividends and the portion of Free Cash Flow attributed to non-controlling interests, plus cash receipts by the Harrison Hydro L.P. for prospective project expenses
the wheeling services to be provided to other facilities owned by the Corporation over the course of their power purchase agreement. It - Projects costs above expectations caused mainly by the
also adjusts for other elements, which represent cash inflows or outflows that are not representative of the Corporation's long-term cash performance of counterparties and delays and cost overruns in
generating capacity, such as adding back transaction costs related to realized acquisitions (which are financed at the time of the the design and construction of projects
acquisition) and adding back realized losses or subtracting realized gains on derivate financial instruments used to fix the interest rate on - Regulatory and political risk
project-level debt or the exchange rate on equipment purchases. - Interest rate fluctuations and financing risk
- Financial leverage and restrictive covenants governing current
The Corporation estimates the Payout Ratio by dividing the most recent declared annual common share dividend by the projected Free and future indebtedness
Cash Flow. - Unexpected maintenance capital expenditures
- The Corporation may not declare or pay a dividend
INTENTION TO SUBMIT PROJECTS UNDER REQUESTS FOR PROPOSALS AND TO GAIN A FOOTHOLD IN TARGET MARKETS INTERNATIONALLY
The Corporation provides indications of its intention to submit projects under requests for proposals based on the state of readiness of some - Regulatory and political risks
of its prospective projects and their compatibility with the announced terms of these requests for proposals. It provides indications of its - Ability of the Corporation to execute its strategy for building
intention to establish a presence in target markets internationally in the coming years based on its strategic plan. shareholder value
- Ability to secure new PPAs
- Foreign exchange fluctuations
INVESTOR PRESENTATION MAY 2016 23For more information, please contact:
Jean Perron, CPA, CA
Chief Financial Officer
Tel. 450 928-2550, ext. 239
jperron@innergex.com
www.innergex.com
INVESTOR PRESENTATION MAY 2016 24You can also read