Innovative Building Materials - Life-Cycle Energy & Related Impacts of Buildings Webinar Series - Department of Energy
←
→
Page content transcription
If your browser does not render page correctly, please read the page content below

Innovative Building Materials

 Life-Cycle Energy & Related Impacts of Buildings Webinar Series

 November 12, 2020

U.S. DEPARTMENT OF ENERGY OFFICE OF ENERGY EFFICIENCY & RENEWABLE ENERGY 1

Agenda
I. Opening Remarks
 Sven Mumme –Technology Manager, U.S. DOE Building Technologies Office
II. Introduction to Life Cycle Carbon
 Lyla Fadali – AAAS Policy Fellow, U.S. DOE Building Technologies Office
III. Low-Carbon and Carbon-Storing Materials for the Built Environment
 Wil Srubar – Associate Professor, CU Boulder
IV. Reducing the Carbon Footprint of Concrete
 Christie Gamble – Sustainability Director, CarbonCure
V. Advanced, Multifunctional Wood-Based Structural Materials for Green, Energy Efficient Buildings
 Liangbing Hu – Professor, University of Maryland; Co-Founder, Inventwood
VI. Life Cycle Climate Potential of Cooling/Heating Systems for Buildings
 Yunho Hwang – Professor, University of Maryland
VII. Q&A Session
 Carl Shapiro– AAAS Policy Fellow, U.S. DOE Building Technologies Office

U.S. DEPARTMENT OF ENERGY OFFICE OF ENERGY EFFICIENCY & RENEWABLE ENERGY 2

Building Life Cycle Impacts DOE Webinar Series

 Topic Date Time

Overview of life cycle impacts of buildings Oct. 16 12:00pm – 1:00pm ET

Challenges of assessing life cycle impacts of buildings Oct. 29 12:00pm – 1:00pm ET

 Innovative building materials Nov. 12 12:00pm – 1:00pm ET

“Real Life” buildings striving to minimize life cycle
 Dec. 3 12:00pm – 1:00pm ET
impacts

Intersection of life cycle impacts & circular economy
 Dec. 17 12:00pm – 1:00pm ET
potential for the building sector

 U.S. DEPARTMENT OF ENERGY OFFICE OF ENERGY EFFICIENCY & RENEWABLE ENERGY 3

Poll Questions

• What industry are you from?

U.S. DEPARTMENT OF ENERGY OFFICE OF ENERGY EFFICIENCY & RENEWABLE ENERGY 4
Efficiency is key to meeting U.S. energy goals

 Residential & Industrial Transportation
 Commercial
 Source: EIA Monthly Energy Review
 U.S. DEPARTMENT OF ENERGY OFFICE OF ENERGY EFFICIENCY & RENEWABLE ENERGY 5

Building Technologies Office

BTO invests in energy efficiency & related technologies that make homes and buildings more
affordable and comfortable, and make the US more sustainable, secure and prosperous.

Budget ~US$285M/year; activities include:

R&D Integration Codes & Standards
Pre-competitive, early- Technology validation, field & lab Whole building &
stage investment in next- testing, metrics, market integration equipment standards
generation technologies technical analysis, test
 procedures, regulations

U.S. DEPARTMENT OF ENERGY OFFICE OF ENERGY EFFICIENCY & RENEWABLE ENERGY 6

DOE research has saved energy and saved consumers money

FOR EXAMPLE:

 Past Present
 • $1,200 purchase
 Units half the price, almost • $550 purchase
 • $200/year to
 20% bigger, and 75% less • $50/year to
 operate operate
 energy to operate – AND
 18 more
 • have cubic features!
 feet • 22 cubic feet

U.S. DEPARTMENT OF ENERGY OFFICE OF ENERGY EFFICIENCY & RENEWABLE ENERGY 7
Our impact on a national scale

Energy efficiency standards completed through 2016
are expected to save 142 quadrillion Btu
through 2030 — more energy than the entire
nation consumes in one year.

U.S. DEPARTMENT OF ENERGY OFFICE OF ENERGY EFFICIENCY & RENEWABLE ENERGY 8
BTO’s work is making a difference, but
 we’re missing part of the picture.

U.S. DEPARTMENT OF ENERGY OFFICE OF ENERGY EFFICIENCY & RENEWABLE ENERGY 9

Historically, BTO has focused on operating buildings.

 Global energy use in buildings Global emissions from buildings

 Building
 construction
 Commercial 17% Building
 22% Commercial construction
 28% 28%

 Residential
 61%
 Residential
 44%

2018 Global Status Report. United Nations Environment Programme.
International Energy Agency for the Global Alliance for Building and Construction (GlobalABC)
 U.S. DEPARTMENT OF ENERGY OFFICE OF ENERGY EFFICIENCY & RENEWABLE ENERGY 10
Global building stock expected to more than double, making
embodied carbon increasingly important.
 Global building stock through 2060

 600
 500
billion square meters

 400
 300
 200
 100
 0
 Current floor 2017-30 2030-40 2040-50 2050-60
 area (as of
 2017)
 Source data from GlobalABC Status Report in 2017

 U.S. DEPARTMENT OF ENERGY OFFICE OF ENERGY EFFICIENCY & RENEWABLE ENERGY 11
Let’s look at the whole picture:

Lifecycle carbon refers to carbon emissions associated with all stages of a
building’s life
 Equipment
Resource Construction/ Replacement/ Demolition/
extraction Manufacturing Transportation Installation Maintenance End of life

 Operations

Embodied carbon is the carbon associated with all stages of a building’s life cycle not including
operating the building
Operational carbon is the carbon associated with operating the building

U.S. DEPARTMENT OF ENERGY OFFICE OF ENERGY EFFICIENCY & RENEWABLE ENERGY 12
Where are the biggest opportunities? Where is BTO needed?

What types of buildings?
 Residential or commercial?
 New construction or retrofits?

What types of materials in the building?
 Envelope? Lighting? HVAC?

What parts of the life cycle?
 Transportation?
 Material extraction?
 End of life?

U.S. DEPARTMENT OF ENERGY OFFICE OF ENERGY EFFICIENCY & RENEWABLE ENERGY 13
Envelope and appliances account for 70% of lifecycle energy.

Lifecycle energy in superinsulated multifamily residential buildings

 envelope appliances other

 50% 19% 32%

Energy 0 GJ 2 GJ 4 GJ 6 GJ

 Other includes joinery, electrical work, plumbing, foundation, furniture, and site & transport
 Data from N. Mithraratne, B. Vale/Building and Environment 39 (2004) 483-492

 U.S. DEPARTMENT OF ENERGY OFFICE OF ENERGY EFFICIENCY & RENEWABLE ENERGY 14
Reducing the Carbon
Footprint of Concrete
CHRISTIE GAMBLE
Senior Director Sustainability
cgamble@carboncure.com

Simply better concrete.
Did you know?

Embodied carbon is expected to account for
nearly 50% of the total carbon emissions from
new construction over the next 40 years.

 16
Concrete is the most
abundant man-made
material in the world.
As a result, cement production creates
~7% of the world’s CO2 emissions and is
the largest contributor to embodied
carbon in the built environment.

 17
What is CarbonCure?
CO2 Utilization in Concrete

CarbonCure’s technology beneficially repurposes carbon dioxide (CO2) to reduce the
carbon footprint of concrete without compromising concrete performance.

 Reducing the Carbon Footprint of Concrete 18
CarbonCure Concrete Producers
Nearly 300 plants worldwide using the technology.

 Reducing the Carbon Footprint of Concrete 19
CO2 Supply
CO2 is captured and distributed to concrete plants by industrial gas suppliers.

Collection Purification Delivery Storage
CO2 is collected from The gas is purified by The CO2 is delivered to The CO2 is stored at
large emitters industrial suppliers concrete plants by concrete plants in
 industrial gas suppliers pressurized tanks

 Reducing the Carbon Footprint of Concrete 20
How it Works: Technology
Seamless retrofit technology that operates with no disruption to normal batching procedures

Installation Integration Injection

• CarbonCure engineers install the • The CarbonCure software • The equipment injects a precise
 proprietary equipment into integrates seamlessly with the automated dosage of CO2 snow
 existing concrete plans plant’s existing batching into concrete as it mixes
 software

 Reducing the Carbon Footprint of Concrete 21
What Happens When
CO2 is Injected?

 Cement CO2

 H2O H2O

 Ca2+ CO32- CaCO3
 Calcium Carbonate Calcium Carbonate

• Reverse calcination reaction occurs
• CO2 converts into CaCO3 (solid limestone)
 22
Converting CO2 to a Mineral

 Nano-calcium carbonate
 particles act as nucleation sites for
 hydration. Compressive strength benefits
 arise from this interaction of up to 10% at
 28 days.

 Carbonate product formed about
 400 nm dimension

 Reducing the Carbon Footprint of Concrete 23
Compressive Strength Effect

 40 6000
Compressive Strength (MPa)

 35

 Compressive Strength (psi)
 5000
 30
 4000
 25

 20 3000

 15
 2000
 10
 1000
 5

 0 0
 1 Day 3 Day 7 Day 28 Day

Conclusion: The formation of a calcium carbonate nanomaterial improves the compressive strength of ready mix concrete.

 Reducing the Carbon Footprint of Concrete 24
Mix Adjustment Potential

 30 4500 Control
 4000
Compressive Strength (MPa)

 Reduced Cement

 Compressive Strength (psi)
 25
 3500
 Reduced Cement + CO2
 20 3000

 2500
 15
 2000

 10 1500

 1000
 5
 500

 0 0
 7 Day 28 Day

Conclusion: CarbonCure enables concrete producers to reduce cement content without sacrificing strength.

 Reducing the Carbon Footprint of Concrete 25
CO2 has a Neutral
Impact on…
Fresh Properties Hardened Properties
• Setting time • Freeze-thaw
• Workability/slump • pH
• Concrete pumping • Density
• Air content • Durability
• Temperature • Color
• Finishing • Texture

Note: Peer reviewed papers are available to support the above information at carboncure.com.

 26
CarbonCure for Ready Mix

How Much CO2 Can Be Saved?

~25 lbs CO2 saved per yd3

CO2 saved = CO2 mineralized + CO2 avoided by reducing cement

 27
Reference Project:

725 Ponce
360,000 sq ft commercial office in Atlanta, GA

“Uzun+Case, with input from Thomas Concrete, specified the
CarbonCure Technology to reduce the carbon footprint of 725 Ponce.
We’re proud to have saved 1.5 million pounds of CO2 while
maintaining our high-quality standards for concrete.”
 Rob Weilacher
 Engineer of Record, Uzun+Case

Supplier: CO2 Savings:
Thomas Concrete 1.5 million lbs
Concrete Usage: CO2 Savings Equivalent:
48,000 cy of concrete made with 888 acres of forest absorbing
CarbonCure CO2 for a year

 28
Reference Projects

Atlanta, GA – Mixed-Use High-Rise San Francisco, CA – LinkedIn Campus Indianapolis, IN – IUPUI Halifax, NS – RBC Centre
Concrete Producer: Thomas Concrete Concrete Producer: Central Concrete Concrete Producer: Irving Materials Concrete Producer: Quality Concrete
CO2 Saved: 750 tons (1.5M lbs) CO2 Saved: 240,000 lbs CO2 Saved: 180,000 lbs CO2 Saved: 200,000 lbs

Chicago, IL - McDonald’s Flagship Atlanta, GA – Georgia Aquarium Calgary, AB – YYC International Airport Washington DC – The Wharf
Concrete Producer: Ozinga Concrete Producer: Thomas Concrete Concrete Producer: Dufferin Concrete Concrete Producer: Vulcan Materials
CO2 Saved: 30,000 lbs CO2 Saved: 330,000 lbs CO2 Saved: 350,000 lbs

 Reducing the Carbon Footprint of Concrete 29
Early DOT/Municipal Acceptance

CarbonCure is gaining traction for acceptance with various
government procurement agencies, including Chicago
Department of Transportation, Hawaii Department of
Transportation and City of Honolulu.

 Reducing the Carbon Footprint of Concrete 30
How can you help reduce
concrete’s carbon impact?
✔ Communicate your commitment to embodied carbon
 reduction throughout the supply chain early and often
✔ Design strengths for what you need
✔ Use supplementary cementitious materials and/or low-
 carbon cement
✔ Remove unnecessary prescriptive concrete specs
✔ Consider performance-based concrete specs
✔ Specify and/or approve CO2 mineralized concrete

 31
Build for the Future.
 Build with CarbonCure.
 A building or infrastructure project may save as much CO2
 as 100s if not 1000s of acres of trees absorb over a year.

Who knew that building with concrete could be like planting trees?

 Christie Gamble
 Senior Director Sustainability
 Cgamble@carboncure.com

 www.carboncure.com
 @CarbonCure
 CarbonCure-Technologies
 CarbonCure.Technologies Simply better concrete.
Advanced, Multifunctional Wood-Based Structural
 Materials for Green, Energy Efficient Buildings
 Presentation for Alfred P. Sloan Proposal
 Proposal Team:
 Liangbing Hu, University of Maryland, College Park

 Liangbing Hu
 UMD, MSE
Advanced wood 33
Building Energy Use and Materials Total building energy-use ~$220 billion/year (~50% total energy) Heating/cooling ~50-70% of energy used in the average American home ~35% of energy leaks through walls Energy Efficiency Trends in Residential and Commercial Buildings, DOE EERE Future buildings need more sustainable materials that can also improve building energy efficiency. • Non-sustainable materials (plastic foam, glass, steel) are heavily used in buildings. Steel • Energy intensive processes/CO2 emission problem for steel and glass production. • Plastic foam is harmful for the environment. • Wood is used in many buildings, but: • Poor mechanical properties that limit its use (tall buildings, structural components); • Poor energy efficiency (e.g., poor thermal insulation ~0.1 W/mK) 34
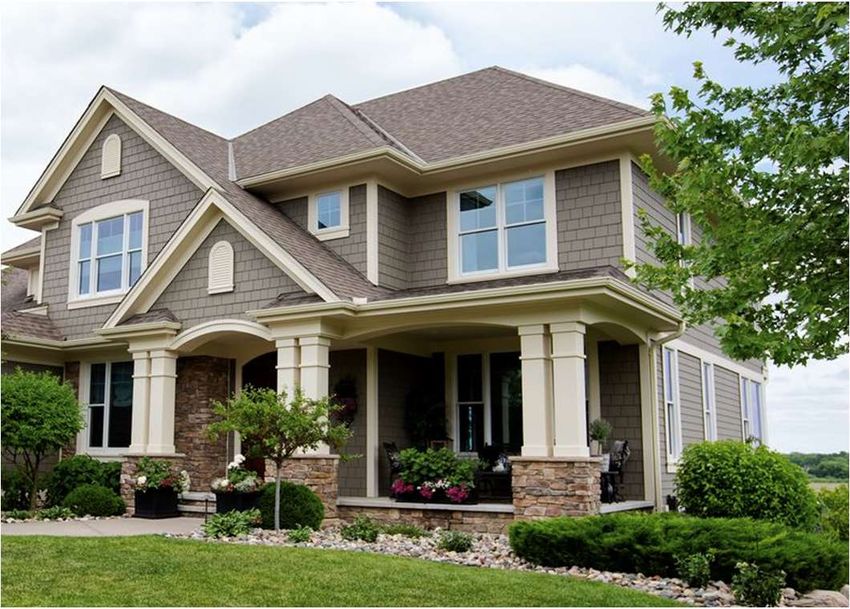
Carbon Cycle in Forests

 www.housebeautiful.com

 Carbon is stored in wood products. The longer, the better.

 Building material, an excellent example of long lived wood

 • U.S. forest is a carbon sink – sequestrates more carbon product, serves as a prolonged carbon storage.
 than it releases.*
* Inventory of U.S. Greenhouse Gas Emissions and Sinks, 1990-2018. U.S.
 35
Environmental Protection Agency. Washington, DC. 2020.
Advanced Wood Technology Through Nanoscience

 Fiber diameter ~50 µm Nanofiber diameter ~5 nm

 ~The
 40% smaller, the better:
 nanocellulose
 • Better mechanical properties;
 • Nanoscale heat transport for better thermal insulation for buildings;
 • Tunable multifunctionalities;
 • Much more …

 200 nm

 Elementary fibrils Nanofibrils Fibril bundles

 Cellulose is the most abundant biomaterial.
 Molecular Chains < 1 nm
 Cellulose (40-50%)
Scientists estimate that plants worldwide synthesize up to one DP: 7000-15000
trillion metric tons of cellulose annually, from MW: 50,000-2500,000 g/mol
www.encyclopedia.com.
 Hu, L. et al. Nature Review Materials, 2020, 5, 642-666. Cellulose nanofiber is the most abundant nanomaterial. 36
Bottom Up vs. Top Down for Cellulose Nanostructures
 • Energy intensive processes;
Traditional Approaches: Bottom up • ~98% is water;
 • Limited scalability (especially for dry product).

 1. Chemical

 2. Mechanical
 Dry paper pulp
 (wood structure is Cellulose nanofiber
 broken) gel (2% by weight)

Our Approaches: Top Down • Much less intensive processes (energy, water use).
 • Scalable nanotechnologies.
 Open up nanofibers;
 Wood structure is maintained
 Cellulose nanofiber
 1. Chemical
 Embedded in wood
 matrix Nanowood
 2. Mechanical.

Patent: 62/559,147 15.09.2017, Hu et al.
 37
Innovations by the PIs: Advanced Wood for Building Energy Efficiency

 Radiative Cooling (roof): Super Wood (beam)
 • “White” in solar spectrum • High tensile strength: ~600 MPa,
 • “Black” in infrared as strong as steel
 • Cooling power ~53 W/m2 • Low density: ~1.3 g/cm3, six-
 • Mechanical strength ~400
 MPa times lighter than steel
 • Science, 2019, 364, 760 • Nature, 554, 224-228, 2018

 Thermal Insulation Wood
Transparent Wood (window) (envelope)
• More light (~92% transmittance; • Low thermal conductivity
 light guiding effect) ~0.03 W/(mK)
• Less heat (6X lower thermal • Anisotropic behavior for
 conductivity) better thermal management
• Advanced Materials, 28, 5181, 2016 • Science Advances, 4,
 eaar3724, 2018

 0.3 mm

 38
1. Engineering Wood for Lightweight (Mechanics)

 Super wood

 Nature, 2018, 554, 224-228
Densified Superwood (with Naturally Aligned Nanofibers)

 Delignification methods:
 • NaOH
 • NaOH + H2O2 Pressure ~5 MPa
 • NaOH + Na2SO3
• Partial lignin removal allows
 complete densification
• Remaining lignin as a “glue”
• Strength is ~600 Mpa (then) and
 1000 Mpa (now)
• Similar strength to steel with 1/6
 density

 Nature, 2018, 554, 224-228
Superb Mechanical Properties of Densified Wood

 Light and Strong

Nature, 2018, 554, 224-228
Superb Mechanical Properties of Densified Wood
 Bending Compression

Nature, 2018, 554, 224-228
A Universal Process for Various Wood Species

 Oak

 Tall, straight southern pine:
 ~ $150/m3
 Poplar

 Cedar

 Pine

Nature, 2018, 554, 224-228
2. Optical and Thermal Engineering with Wood Materials
 (for building energy efficiency)

 Cooling wood

 Science, 2019, 364, 760
Spectrum Engineering: Universe, Sun, Clouds, and Buildings
Universe ~3 K
 8-13 m
 transparency window Sun ~5778 K

 Mid-IR cooling Solar heating
 ~ 1000 W/m2

 Roof ~ 300 K

 building

 Cooling in mid-IR > Heating in solar spectrum
Cooling Wood in Solar Spectrum: Integrated Heating Power

 White in visible range
 Solar radiation
 (~1000 W/m2)

 • Energy density of solar radiation ~1000 W/m2 at the Earth’s
 surface
 • Highly reflective (~96%) in visible region (majority of solar
 energy)
 • Absorption happens mainly in the near infrared of solar
 spectrum (weak solar radiation)
 • Integrated solar adsorption Psolar ~ 53 W/m2.

Science, 2019, 364, 760
Mid-Infrared Spectrum: High Emissivity (Black) 8 µm to 13 µm = 770 cm-1 to 1250 cm-1 Peak absorbance ~ 9 µm Mid-IR “black” • Total outgoing radiative cooling power density: • ௗ is the emitted heat of the surface (mainly at mid-infrared) ௗ గ/ଶ ଶହ ఓ = 2 න න ఒ = 358 .ଷ ఓ • Mid-Infrared wavelengths: 5-25 µm = Temperature 140-740 K. • Building temperature ~ 300 K. Science, 2019, 364, 760 • High absorptivity = High emissivity .
Overall Daytime Radiative Cooling Solar “White” Infrared ”Black” Solar spectrum (W/(m2nm)) 2.0 1.0 Solar, AM1.5 Cooling wood Air 0.8 1.5 Emissivity Outward radiation power (mainly in IR) 0.6 1.0 (cooling) ~358 W/m2 Heating Power ~53 W/m2 0.4 0.5 0.2 0.0 0.0 0.3 1 2.5 5 8 13 20 25 Wavelength (mm) Ambient temperature Difference (oC) Temperature (oC) Power (W/m2) Cooling power 75 10 cm by 20 cm 50 ௧ = 25 గ/ଶ ଶହ ఓ 2 ∫ ∫.ଷ ఓ ௧ ఒ = 227 0 Cooling wood temperature 25 Ambient temperature 20 15 10 5 m 0 ௩ାௗ , = 20W, based on wind speed ~ 2 . Temperature difference s 10 5 ௧ 0 9 PM 1 AM 5 AM 9 AM 1 PM 5 PM = ௗ − ௦ − ௩ାௗ , − ௧ Science, 2019, 364, 760 = 58W
Cooling Wood: A Structural Material for Building

 Specific Strength (Mpa cm /g)
 Cooling wood 400
 400

 3
 Stress (MPa)

 ~8.7 X stronger
 300 ~10 X tougher 300

 200 200

 100 Natural wood 100

 0 el m 0 d
 0.0 0.4 0.8 1.2 1.6 ste esiu oy 4V d
 oo woo
 -C gn all 6Al- l w
 l m g
 Strain (%) n-A Ma min
 u Ti- ra lin
 -M lu Natu Coo
 Fe A

• More effective radiation cooling in dry areas. Modeling:
• Cooling savings of 35% and 22% for buildings built before and after 1980, respectively. • Through collaboration with Prof. Jelena Srebric
 • EnergyPlus version 8
 • Midrise apartment buildings across the United States,
 based on data from old (built before 1980) and new (built
 after 2004) structures provided by the U.S. Department
Science, 2019, 364, 760 of Energy Commercial Reference Buildings
Integration with Existing Wood/Paper Manufacturing Infrastructure

 Re-Think Wood

 Nature Review Materials, 2020, Online
Life Cycle Climate Potential
of Cooling/Heating Systems for Buildings
 November 2020

 Yunho Hwang, Ph.D., FASME, FASHRAE

 Center for Environmental Energy Engineering
 Department of Mechanical Engineering
 University of Maryland
 College Park, MD 20742-3035
 BTO Webinar Series on the Life-Cycle Energy
 Copyright © 2020 Center for Environmental Energy Engineering
Life Cycle Climate Performance
 • Regular emissions
 • Irregular emissions
 • Service emissions
 • End-of-life emission
 • Leakage during production &
 transport

 • Energy consumption of the system
 • Energy to make
 system/components
 • Energy to produce refrigerant
 • Energy to transport
 • Energy for end-of-life,
 recycling/recovery of system and
 refrigerant

52 BTO Webinar Series on the Life-Cycle Energy
 Copyright © 2020 Center for Environmental Energy Engineering
LCCP IIR Excel Tool (2012-2016)
 for Residential Heat Pumps – User Inputs
• Single Speed Compressor,
 Single Speed Fan
• 8 Refrigerants built in
 • HFC-32, HFC-1234yf, HFC-
 134a, R-290, HFC-404A,
 HFC-410A, L-41b, DR-5
• 5 Locations (Miami FL,
 Phoenix AZ, Atlanta GA,
 Chicago IL, Seattle WA)
 • Each location in a different
 climate zone
• Inputs and results in SI
 units

 BTO Webinar Series on the Life-Cycle Energy
 Copyright © 2020 Center for Environmental Energy Engineering
LCCP IIR Excel Tool (2012-2016)
for Residential Heat Pumps – Outputs

 Equipment manuf. Emission < 1%
 BTO Webinar Series on the Life-Cycle Energy
 Copyright © 2020 Center for Environmental Energy Engineering
Sensitivity Study
 Refrigerant Constituent Mass fraction Classification GWP LCCP
 6.5e+4
 7.0e+4 R410A R32/R125 50/50 A1 2,088 100%
 7.5e+4
 8.0e+4 ARM70a R32/R134a/R1234yf 50/10/40 A2L 482 96%
 8.5e+4
 9.0e+4
 D2Y60 R32/R1234yf 40/60 A2L 272 96%
 9.5e+4 DR5 R32/R1234yf 72.5/27.5 A2L 490 95%
 1.0e+5
 100000 L41b R32/R1234ze 73/27 A2L 494 95%
 R32 R32 100 A2L 675 94%
 95000
 (kg CO2e)

 Propane R290 100 A3 3 88%
 90000

 85000
Total Emissions

 80000 • Reducing GWP to around 500 decreases direct emission
 +10% by 71% but total LCCP by 11%
 75000
 -8%2500
 3000
 • Reducing energy consumption by 10% lowers total LCCP
 )
 kg

 70000 2000
 2e /

 near to 10%.
 CO

 65000 1500
 g

 1000
 • The most effective way to reduce equipment emissions is
 (k

 1.05
 -10%
 P
 GW

 Energ 1.00 500
 y Cons
 umpt
 0.95 to increase the energy efficiency of the equipment (or
 ion o 0.90
 f Bas
 eline
 (%) building envelop performance).

 Energy Consumption & GWP
 BTO Webinar Series on the Life-Cycle Energy
 Copyright © 2020 Center for Environmental Energy Engineering
Enhanced & Localized LCCP (2017-2019)
 +48% Dr. Stephen Andersen (IGSD) and expert
 members suggested to consider enhanced and
 localized circumstances
 Additional degradation factors Impact
 Power plant efficiency by Power plant efficiency reduced by 2%
 ambient temperature (from 36% to 34%)
 T&D loss by ambient Loss increases by 0.5% (from 5% to 5.5%)
 temperature
 T&D loss by infrastructure 50% obsolete grids
 Voltage stabilizer Adds additional 5% loss
 Heat island impact Reduces AC COP by 27%
 Stacked condenser impact Reduces AC COP by 20%

 BTO Webinar Series on the Life-Cycle Energy
 Copyright © 2020 Center for Environmental Energy Engineering
Summary
• IIR LCCP Guideline (2016) recommends how to perform the LCCP
 calculation for heat pump systems and provide data sources for the
 individual components.
• Energy consumption is the main contributor to the LCCP followed by
 annual refrigerant leakage.
• EL-LCCP considers practical localized installation factors.
• Low-GWP refrigerant will be applied globally and using low-GWP
 refrigerant (GWP=10) is equivalent to improving energy efficiency by
 8% in Miami, US.
• Improving building material performance directly improves on
 equipment LCCP.

 BTO Webinar Series on the Life-Cycle Energy
 Copyright © 2020 Center for Environmental Energy Engineering
IIR Guideline for LCCP Performance
 • Guideline for Life Cycle Climate
 Performance published in January 2016.
 • Detailed explanation of calculation process
 • Recommended traceable data sources for GWP
 values, leakage rates, manufacturing emissions
 rates, recycling emissions rates
 • Recommended traceable data sources for
 weather data, electricity generation rates
 • Recommended standards for energy
 consumption calculation
 • Comparison to TEWI
 • Available LCCP calculation tools
 • Residential heat pump sample problem

 BTO Webinar Series on the Life-Cycle Energy
 Copyright © 2020 Center for Environmental Energy Engineering
LCCP Publications
 • Published “Harmonization of
 Life Cycle Climate
 Performance” at 16th Int.
 RAC conference at Purdue,
 Paper No. 2382.

 • Published “LCCP evaluation
 on various vapor
 compression cycle options
 and low GWP refrigerants”,
 Int. J. of Refrigeration, 2016,
 V 70, pp. 128-137.

BTO Webinar Series on the Life-Cycle Energy
 Copyright © 2020 Center for Environmental Energy Engineering
Q&A Session

• Use the Q&A feature to ask a question
• Panelists
 – Wil Srubar – Associate Professor, CU Boulder
 – Christie Gamble – Sustainability Director, CarbonCure
 – Liangbing Hu – Professor, University of Maryland; Co-Founder, Inventwood
 – Yunho Hwang – Professor, University of Maryland

U.S. DEPARTMENT OF ENERGY OFFICE OF ENERGY EFFICIENCY & RENEWABLE ENERGY 60
Building Life Cycle Impacts DOE Webinar Series

 Topic Date Time

Overview of life cycle impacts of buildings Oct. 16 12:00pm – 1:00pm ET

Challenges of assessing life cycle impacts of buildings Oct. 29 12:00pm – 1:00pm ET

Innovative building materials Nov. 12 12:00pm – 1:00pm ET

“Real Life” buildings striving to minimize life cycle
 Dec. 3 12:00pm – 1:00pm ET
impacts

Intersection of life cycle impacts & circular economy
 Dec. 17 12:00pm – 1:00pm ET
potential for the building sector

 U.S. DEPARTMENT OF ENERGY OFFICE OF ENERGY EFFICIENCY & RENEWABLE ENERGY 61
You can also read