Insects and recent climate change - PNAS
←
→
Page content transcription
If your browser does not render page correctly, please read the page content below
SPECIAL FEATURE:
SPECIAL FEATURE: PERSPECTIVE
PERSPECTIVE
Insects and recent climate change
Christopher A. Halscha, Arthur M. Shapirob, James A. Fordycec, Chris C. Niced, James H. Thornee,
David P. Waetjene, and Matthew L. Foristera,1
Edited by David L. Wagner, University of Connecticut, Storrs, CT, and accepted by Editorial Board Member May R. Berenbaum October
26, 2020 (received for review March 9, 2020)
Insects have diversified through more than 450 million y of Earth’s changeable climate, yet rapidly shifting
patterns of temperature and precipitation now pose novel challenges as they combine with decades of
other anthropogenic stressors including the conversion and degradation of land. Here, we consider how
insects are responding to recent climate change while summarizing the literature on long-term monitoring
of insect populations in the context of climatic fluctuations. Results to date suggest that climate change
impacts on insects have the potential to be considerable, even when compared with changes in land use.
The importance of climate is illustrated with a case study from the butterflies of Northern California, where
we find that population declines have been severe in high-elevation areas removed from the most imme-
diate effects of habitat loss. These results shed light on the complexity of montane-adapted insects
responding to changing abiotic conditions. We also consider methodological issues that would improve
syntheses of results across long-term insect datasets and highlight directions for future empirical work.
| | |
Anthropocene climate change population decline extinction extreme weather |
From invasive species to habitat loss, pesticides, and Although other sampling designs can of course offer
pollution, the stressors of the Anthropocene are many important insights (9), we focus on long-term monitoring
and multifaceted, but none are as geographically as being uniquely powerful for understanding the influ-
pervasive or as likely to interact with all other factors ence of climatic fluctuations on animal populations be-
as climate change (1, 2). For these reasons, under- cause of the ability to decompose complex temporal
standing the effects of anthropogenic climate change trends into effects driven by different factors (10, 11).
on natural systems could be considered the defining In the sections below, we compare climate change
challenge for the ecological sciences in the 21st cen- with other stressors and examine multifaceted impacts
tury (3). It is of particular interest to ask how insects will in terms of climate means, limits, and extremes. We
respond to contemporary climate change because then discuss the geography of climate change with
they are the most diverse lineage of multicellular or- particular focus on the responses of montane insects,
ganisms on the planet and are of fundamental impor- with a case study from the butterflies of Northern
tance to the functioning of freshwater and terrestrial California that illustrates the value of long-term obser-
ecosystems. The issue also has new urgency in light of vations that span a major gradient of land use inten-
recent and ongoing reports of insect declines from sity. Two areas that we do not cover in detail are the
around the globe (4). Insects and climate change have theoretical foundations of climate change research
been discussed elsewhere (5–8), and our goal here is (12) and community-level consequences, including al-
not to cover all aspects of the problem. Instead, we tered trophic interactions (13). As a qualitative survey
focus on recent discoveries and questions inspired by of the state of the field, we have gathered insect
continuous long-term monitoring of insect populations. monitoring studies that are from relatively undisturbed
a
Department of Biology, Program in Ecology, Evolution and Conservation Biology, University of Nevada, Reno, NV 89557; bCenter for Population
Biology, University of California, Davis, CA 95616; cDepartment of Ecology and Evolutionary Biology, University of Tennessee, Knoxville, TN 37996;
d
Department of Biology, Population and Conservation Biology Program, Texas State University, San Marcos, TX 78666; and eDepartment of
Environmental Science and Policy, University of California, Davis, CA 95616
Author contributions: A.M.S. designed research; A.M.S. performed research; J.H.T. and D.P.W. processed data; C.A.H., J.A.F., C.C.N., and M.L.F.
analyzed data; and C.A.H., J.A.F., C.C.N., J.H.T., D.P.W., and M.L.F. wrote the paper.
The authors declare no competing interest.
This article is a PNAS Direct Submission. D.L.W. is a guest editor invited by the Editorial Board.
Published under the PNAS license.
1
To whom correspondence may be addressed. Email: mforister@unr.edu.
This article contains supporting information online at https://www.pnas.org/lookup/suppl/doi:10.1073/pnas.2002543117/-/DCSupplemental.
Downloaded by guest on May 25, 2021
Published January 11, 2021.
PNAS 2021 Vol. 118 No. 2 e2002543117 https://doi.org/10.1073/pnas.2002543117 | 1 of 9locations or that span a land use gradient. We only include studies could begin to rival the importance of habitat loss as shifting cli-
that encompass at least 10 y of continuous sampling, examine 10 or matic means and extremes stress individuals and populations
more species, and analyze climatic data in some fashion (Table 1 and beyond historical limits (21, 22).
SI Appendix, Table S1). It is important to note that 10 y is a useful An empirical understanding of the effects of climate change in
minimum cutoff, but we acknowledge that it might not be sufficient comparison with other stressors depends in large part on long-
to separate population fluctuations from long-term trends in many term observations from protected areas or from gradients of land
cases (14–16). Table 1 provides a summary of the monitoring pro- use that will let us directly compare the effects of different factors.
grams that met our criteria, while SI Appendix, Table S1 breaks these In Great Britain, both land use and climate change have been
out further by publication and includes an abbreviated summary important for explaining the decline of 260 species of macro-
of findings. moths and an increase of 160 species (of a total of 673 species)
(23). The signal of habitat loss is seen in widespread species,
On the Relative Importance of Climate Change and Other
which have declined in regions with increased intensity of human
Stressors
land use. At the same time, the role of climate can be seen in the
Although anthropogenic stressors must ultimately be understood
decrease of more northern, cold-adapted species and the simul-
as an interacting suite of factors (17, 18), it is useful to start by
taneous increase of more southern, warm-adapted species (23). A
asking: How will the consequences of climate change compare
cross-taxa study including insects and other organisms from
with other stressors? Over the last three centuries, the global central Europe found that temperature was a stronger predictor
percentage of ice-free land in a natural state (not intensively than habitat association for understanding trends in terrestrial
modified by human activity) has shrunk from 95 to less than 50% organisms (24). Less multifaceted signals of global change can be
(19), with consequences that include the extirpation and extinc- found in smaller areas sheltered from direct effects of habitat loss.
tion of plants and animals (20). Although habitat loss (including For example, beetle incidence in a protected forest in New
degradation through pollution and numerous other processes) Hampshire, United States, has decreased by 83% in a resampling
continues, it is possible that we are living through a period of project spanning 45 y, apparently as a function of warmer tem-
transition where the importance of changing climatic conditions peratures and reduced snow pack that insulates the diverse
Table 1. Monitoring studies of at least 10 insect species and at least 10 y from land use gradients or protected areas that have been
used to examine weather in relation to insect populations
Location Source Years Species Taxa Method
Australia Gibb et al. (79) 22 106 Ants Pitfall traps
California, United Shapiro Transect (33, 56–58) 47 163 Butterflies Modified Pollard walk
States
Colorado, United Iler et al. (80) 20 20 Syrphid flies Malaise traps
States
Costa Rica Tritrophic Interaction Monitoring in the Americas 22 1,724 Lepidoptera, Parasitoids Collect and rear
(39)
Ecuador Neotropical fruit-feeding nymphalid trap studies 10 137 Butterflies Fruit traps
(77)
Europe Bowler et al. (24) 19 — Many (includes insects) Standardized surveys
Europe Bowler et al. (34) 19 448 Many (includes insects) Many
Europe Devictor et al. (81) 19 — Butterflies (and birds) Various monitoring schemes
Europe Jourdan et al. (28) 32 — Benthic invertebrates Surface water survey
Finland Finnish Moth Monitoring Scheme (49) 14 334 Moths Light traps
Finland Hunter et al. (26) 32 80 Moths Light traps
Germany Baranov et al. (14) 42 125 Mayflies, stoneflies, and Emergence trap
caddisflies
Germany Krefeld Entomological Society (82) 27 — Flying insects Malaise traps
Germany Voigt et al. (29, 71) 24 1,041 Arthropods Pitfall trap, sweep net
Greenland Greenland Ecosystem Monitoring BioBasis 19 16 Arthropods Pitfall traps
program (36)
The Netherlands Dutch Butterfly Monitoring Scheme (41) 15 39 Butterflies Pollard walk
The Netherlands Hallmann et al. (83) 26 — Many insect orders Pitfall traps, lighted sheet
counts
Russia Chronicles of Nature (84) 40 19 Many (includes insects) Traps
Spain Catalan & Andorran Butterfly Monitoring Schemes 17 169 Butterflies Pollard walk
(30)
Spain Stewart et al. (85) 10 10 Butterflies Pollard walk
United Kingdom Hassall et al. (73) 30 215 Syrphid flies Malaise traps
United Kingdom Rothamsted Insect Survey (15, 35, 40, 68, 72) 51 345 Aphids, moths Suction trap, light trap
United Kingdom UK Butterfly Monitoring Scheme (16, 40, 42, 68, 74) 45 55 Butterflies Pollard walk
United Kingdom UK and Ireland Garden Moth Scheme (86) 11 50 Moths Light trap
For studies with multiple associated publications, only a few are listed here; a more complete list is in SI Appendix, Table S1. Numbers of species and years are
shown based on the literature that met our criteria and may not represent the total numbers of years or species from associated datasets; also, numbers are not shown
Downloaded by guest on May 25, 2021
if, for example, specimens were not identified to species.
2 of 9 | PNAS Halsch et al.
https://doi.org/10.1073/pnas.2002543117 Insects and recent climate changeoverwintering beetle fauna during the coldest months (25). In a observed for surface detritivores (36). On the other side of the
headwater stream in a German nature preserve that has been temperature spectrum is maximum temperature, which has been
isolated from other anthropogenic stressors (other than climate shown to be the variable most associated with local extinctions in
change and possible indirect effects of land use change in the a global survey of insects and other taxa (37).
region), community shifts have been dramatic over 42 y of mon- While our understanding of biotic response to warming means
itoring, with the abundance of common macroinvertebrates de- and limits improves, the greater challenge of changing variance is
clining by 82% and overall species richness increasing (14). It is now upon us. Increased climatic variance is often considered in
important to note that a strong signal of climate driving pop- the context of extreme events; however, changing variance can
ulation trends has not been found in all long-term insect studies, also negatively impact an organism by subjecting it to nonoptimal
even those from protected areas, perhaps as a result of buffering conditions or combinations of conditions, even if mean temper-
of high-quality habitat or other ecological factors. For example, in ature and the number of extreme events remain the same. That
a subarctic forest in Finland, negative associations with a warming said, predictions for many parts of the world do include an in-
climate were detected for subsets of the moth fauna; however, creased frequency of extreme weather events, which might in-
populations were primarily stable or increasing for a majority of clude maximum or minimum temperatures outside of a historical
species (26). It can also be noted that the literature on long-term range, more intense precipitation events or droughts, or combi-
responses of insect populations to climate is neither taxonomically nations of these phenomena (38). We have few studies on this
nor geographically broad, which is an important conclusion from topic from which to draw conclusions; only six studies in Table 1
Table 1, where it can be seen that most studies come from explicitly investigated extreme weather events (refs. 28, 33, and
northern Europe and Lepidoptera are disproportionately repre- 39–42 but also see ref. 43). In the few cases where biotic response
sented, as others have noted (4). to extreme events has been examined, the results are as we might
Beyond the direct effects of climate change, we can ask: How expect: extreme events are extreme population stressors. Large,
will changing climatic conditions interact with habitat loss, inva- synchronized population swings of Lepidoptera in the United
sive species, pesticide toxicity (27), and other factors? This is an Kingdom are associated with extreme climate years, and re-
area that is ripe for experimental work (10), but the number of sponses to these years were negative in five of six cases (40). On a
potentially interacting factors that could be tackled in an experi- continental scale, a recent resurvey of 66 bumblebee species
ment is daunting, which is why experiments will profitably be in- across two continents points to temperatures outside of historical
spired and focused by observational results. Multiple studies from ranges as a major driver reducing occupancy across the landscape
Table 1 have compared the effects of climate in different land use (44). Salcido et al. (39) report an increase in extreme flooding
types, and such studies have discovered higher climate impacts in events as one of the factors contributing to the loss of parasitoids
areas of disturbance (28–30). A notable example of modeling in- and Lepidoptera in a Costa Rican forest, which includes the dis-
teractions in the context of global change comes from a recent appearance of entire genera of moths (minimum temperatures
study of British insects, where researchers found that the most also had strong negative effects, consistent with results discussed
successful model for poleward range shifts included habitat above). The complex and apparently disastrous effects of climate
availability, exposure to climate change, and the interaction be- change at low latitudes, including the drying of cloud forests and
tween the two (31). loss of associated insects in another protected forest in Costa Rica,
are discussed further in another paper (45).
On Changing Maxima, Minima, Means, and Variance
Climate change is of course not one phenomenon, and axes of On the Geography of Biotic Response to Climate Change
change include shifts in limits (maxima and minima), average An important test of our understanding of ectotherm response to
conditions, and variance, which can all be measured at different abiotic conditions is the extent to which we can understand and
temporal and spatial scales. The multifaceted nature of climate predict responses of insects living in different biomes or climatic
change is illustrated by the fact that nighttime temperatures are regions (46). Current warming is not evenly distributed across the
warming faster than daytime conditions (32). The consequences of globe, with regions at higher latitudes and elevations experienc-
this for insects are poorly understood but potentially serious, in- ing the most severe increases, which could be expected to dis-
cluding reduced time for recovery from daytime heat stress and proportionately impact populations (positively or negatively) (47).
indirect effects through plants, which are all areas where addi- In the United Kingdom, for instance, population dynamics at
tional experimental work is needed (32). In the mountains of range margins for many butterflies now more closely resemble
California, rising average daily minimum temperatures had some core populations (48), and in Finland, rising temperature is asso-
of the most dramatic negative effects on insects, especially in ciated with increasing moth multivoltinism (49). It has also been
combination with drier years (33). Rising minimum temperatures in suggested that tropical insects are more sensitive to warming
particular seasons might impact insects through effects on critical conditions because tropical regions have historically experienced
overwintering and diapausing stages. In central Europe, warmer less climatic variability, both within and between years, and thus,
overwintering temperature is associated with increased abun- insects in those regions are already closer to detrimental thermal
dance in the following year for terrestrial organisms in a large- maxima relative to temperate insects (50, 51); however, with rel-
scale study that included insects (34). In the United Kingdom, atively few tropical monitoring datasets, this is a critical area for
the annual population dynamics of moths are affected by over- further investigation (52). A related issue is the effect of climate
wintering temperature and precipitation (35). In this case, winter change along elevational gradients, and at least a few expecta-
precipitation has a negative association with moth abundance, tions align to suggest that montane insects could fare better in
while winter temperature has a positive association (35). In climate change scenarios as compared with insects in less topo-
Greenland, changes in the structure of arthropod communities graphically complex environments (53). First, montane insects
over 18 y have been influenced by warming summers and falls and have the opportunity to track analog climate conditions to buffer
Downloaded by guest on May 25, 2021
fewer freeze–thaw events, with the most negative associations against rapid change, which might include shifts to higher
Halsch et al. PNAS | 3 of 9
Insects and recent climate change https://doi.org/10.1073/pnas.2002543117elevations, into valleys, or to poleward aspects of slopes. Second, niche-tracking model. We have updated (in Fig. 1E) an earlier
montane insects have access to a greater diversity of thermal analysis (58) from before the megadrought years and confirm that
environments, which might differ in mean conditions or rates of butterflies were on average being observed at slightly higher el-
warming and could allow for behavioral thermoregulation even evations in later (2002 to 2010) vs. earlier (1977 to 1985) years; the
without changes in elevational range (54). Third, relative to low- distribution of those elevation changes in Fig. 1E is positive and
lands that are degraded in many parts of the world (because of the upslope. A shift in average elevation of occurrence (or change in
concentration of agriculture or urban areas), insects on mountains central tendency of elevational range) is consistent with vegeta-
will often find a greater diversity of plant resources, which (at least tion dynamics observed in another California mountain range (60).
for herbivorous insects) should provide some buffer against In contrast, when the early vs. late comparisons encompass the
climate-induced changes in the plant community. Are these ex- drought years in a recent (Fig. 1F) or broader span of years
pectations borne out by long-term monitoring of insect pop- (Fig. 1G), it can be seen that the elevational changes are more
ulations? The answer to that question has applied relevance evenly balanced with both upslope and downslope shifts. This is
because it affects how we think about land protections and not unlike the complexity of upslope and downslope responses
whether or not mountains can be climate refugia during the up- observed in other taxa in the same mountain range (61, 62).
heavals of the Anthropocene (55). The severe declines of the drought years in Northern California
Few insect monitoring programs encompass extensive eleva- have in effect cancelled out the earlier upslope signal, which
tional gradients, but one exception is the Shapiro Transect across leaves us with the question of whether or not success (or failure) in
Northern California: 10 sites and 163 species of butterflies over the mountains in recent years can be predicted based on species-
more than 2,500 m of elevation, including a severe gradient in specific traits. We took a constrained ordination approach (re-
land use, from the intensely modified Central Valley to above tree dundancy analysis) to understand montane butterfly populations
line in the Sierra Nevada (Fig. 1 A and B). Observations have been over time in the context of potential predictors that include vol-
taken every 2 wk during the butterfly flight season for between 32 tinism (number of generations per year), habitat association,
and 48 y, depending on the site; details of data collection have overwintering biology, sensitivity to specific weather variables,
been described elsewhere (56–58). and other traits (Fig. 2). Focusing on the west slope locations
Previous modeling work has highlighted the complexity of (relevant to our measure of elevational population dynamics in
population response to weather in this diverse fauna (56) and has Fig. 1 E–G), we see that the most successful montane species can
documented an array of factors impacting populations along the be characterized as mostly resident (reproducing at our sites),
elevational and land use gradients. At lower elevations, the loss of univoltine species with earlier emergence, and also as species
open spaces, warming summers, and pesticide application have with positive responses to precipitation and average minimum
been associated with widespread declines (57, 59), while the im- daily temperatures (Fig. 2). The converse is that declining mon-
pact of climate change and an extreme drought have been more tane species (in the lower half of Fig. 2) have a negative associa-
apparent at higher elevations (33). Here, we revisit the question of tion through time with minimum temperatures, which is consistent
climate change impacts in this system (with an additional 3 y of with a previous analysis, focused on species richness (33), that
data), with an emphasis on understanding species-specific traits hypothesized rising minimum temperatures as a driver of declin-
that predict persistence in the mountains. We also revisit a pre- ing montane butterflies. The association with precipitation sensi-
viously described upslope shift (58) with an additional 13 y of data tivity suggests that a successful subset of the montane fauna not
to ask if elevational dynamics were impacted by the megadrought only persists with warming nights but is able to take advantage of
of 2011 to 2015. the highly variable precipitation of the region (33).
Butterflies in the mountains and the Central Valley have, on Declining populations in the mountains (in the lower half of Fig. 2)
average, followed downward population trajectories (Fig. 1 C and tend to be weedy, multivoltine habitat generalists with broad geo-
D). Populations at low elevations have been trending downward graphic ranges (although they can be locally rare). This result is
for a greater span of years, while montane populations appear to perhaps superficially surprising given the resilience of generalist
have been relatively steady through the 2000s but were severely species in other contexts (63, 64) but was predicted 10 y ago for the
impacted following 2011 (the start of a megadrought). Roughly montane Northern California fauna (58), and it has been seen for
speaking, this comparison is between populations affected by all multivoltine butterflies in another seasonally hot and dry Mediter-
of the major Anthropocene stressors (in the Central Valley) and ranean climate (65). For most species, the warm season at higher
populations affected primarily by a changing climate (in the elevations is not long enough to support true multivoltinism (66);
mountains). The mountains are not without some land conversion thus, species with many generations per year depend on demo-
and incursions of invasive plants along roadways, but for the most graphic contributions from lower elevations, where populations have
part, our sites are in undisturbed natural areas. Thus, it is note- been failing for at least two decades (Fig. 1D). It is also possible that
worthy that the montane declines have reached almost one-half of warming temperature and drought are acting indirectly and inter-
a standard deviation away from the mean (relative to the long- actively, causing late season vegetation to dry earlier in the year,
term average), matching roughly the depth of decline in the which could impact late season butterflies, including multivoltine
Central Valley. species (67). It is interesting to note that having multiple generations
The density plots in Fig. 1 C, Inset and D, Inset reflect the per year, however, conveyed the opposite effect at the lowest ele-
distribution of demographic trends in the two regions: the bulk of vations during an extreme weather event, where we observed that
coefficients (associated with years in regression models) is nega- multivoltinism combined with early springs allowed populations in
tive (reflecting downward population trajectories) in both cases, the Central Valley to reach higher densities during the drought years
but not all species are in decline. With respect to the mountains, it of 2011 to 2015, which can be seen in Fig. 1D (33).
is of interest to ask if species with better performance are species These results, which encompass between 100 and 142 but-
that have been observed with greater frequency at the highest terfly species (depending on the analysis), challenge some of the
Downloaded by guest on May 25, 2021
elevations, which would be consistent with a bioclimatic (upslope) expected patterns of biotic response to climate change. First, the
4 of 9 | PNAS Halsch et al.
https://doi.org/10.1073/pnas.2002543117 Insects and recent climate changeCP
A B Sierra 1977
40
Nevada DP
N 1973
LC SV
39
Coast 1982
Range
1974 2000m
Central WA
Valley 1988
38
GC
150km SM 1976 WS NS RC 1000m
1972 1988 1988 1975
37
-123 -122 -121 -120
C E
1.00 1977-1985
40
2002-2010
0.75
std. pop. index
0.50
20
0.25
0.00
0
-0.25 -500 0 500 1000 1500
-0.50
F
-0.75 2002-2010
2011-2019
40
1990 1995 2000 2005 2010 2015 2020
20
D
1.00
0
0.75
-2000 -1000 0 500 1000
std. pop. index
0.50
0.25
G
1977-1985
40
0.00 2011-2019
-0.25
20
-0.50
-0.75
0
1990 1995 2000 2005 2010 2015 2020 -1000 -500 0 500 1000
Year Elev. change (m)
Fig. 1. Overview of geography and major trends for the Northern California case study. (A) Map of Northern California with focal sites, also shown
in elevational profile in B with two-letter site abbreviations and the year when continuous sampling started at each site (SM, Suisun Marsh; GC,
Gates Canyon; WS, West Sacramento; NS, North Sacramento; RC, Rancho Cordova; WA, Washington; LC, Lang Crossing; DP, Donner Pass; CP,
Castle Peak; SV, Sierra Valley). (C and D) Standardized population indices (means across species by site) for mountain sites (C) and low-elevation
sites (D), with site colors the same as in B and brackets above x axes to indicate major drought years from 2011 to 2015. Density plots in C, Inset
and D, Inset show the distribution of year coefficients across species in the two regions (high and low elevations), with vertical dotted lines
marking zero, such that observations to the left of the line represent species with negative trends across time. (E–G) Histograms summarize
changes in elevation between different 9-y windows of time; for example, E is the change in mean elevation per species between the earliest
years (1977 to 1985) and years immediately before the megadrought (2002 to 2010). Colors in histograms are for visualization, with darker
orange corresponding to more negative (downward) shifts and darker blue being more positive (upslope) shifts (SI Appendix, Fig. S1 shows
additional details). Mean shifts (in meters; with SEs) and results from one-sample t tests (against the null of mean elevational shift being zero) are
as follows: (E) 85.5 (±22.4), t116 = 3.82, P < 0.001; (F) −40.9 (±25.6), t116 = −1.59, P = 0.12; and (G) 38.1 (±23.4), t118 = 1.63, P = 0.11.
ability of montane microclimatic heterogeneity to buffer against both multivoltine species (with demographic connections to lower
climate change might be limited and context dependent, espe- elevations) and resident species with fewer generations per year
cially when considering extreme regional events. Overall, our have suffered in the mountains (SI Appendix, Figs. S3 and S4).
montane locations have tended to show more variation in pop- These results highlight the power of long-term data to quantify
ulation indices among sites (SI Appendix, Fig. S2), which could be climate sensitivities along with natural history when understanding
consistent with montane microclimatic heterogeneity. However, population trajectories under climate change. These results also
declines in the mountains following the megadrought are com- bring into focus the complexities faced by organisms when traits
Downloaded by guest on May 25, 2021
parable with declines in the Central Valley (Fig. 1 C and D), and (such as voltinism) confer different advantages and disadvantages at
Halsch et al. PNAS | 5 of 9
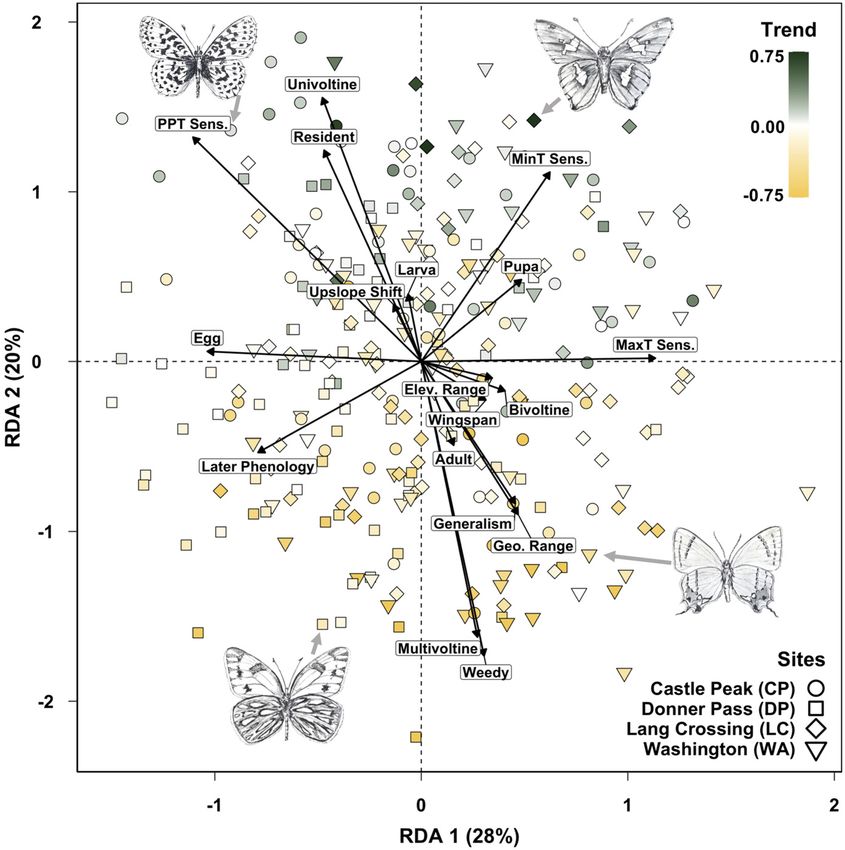
Insects and recent climate change https://doi.org/10.1073/pnas.2002543117Fig. 2. Traits associated with population trends at four montane monitoring sites. Points represent a species at a site (any individual species can have
between one and four points), and those in the top half are generally increasing, while bottom half points are generally declining. Points are colored
according to coefficients associated with years (i.e., “trend” or change through time), and those coefficients as well as climate sensitivities were
estimated in separate Bayesian models. Traits represented include life history traits and sensitivities to climatic variables, specifically precipitation (PPT
Sens.), average daily maximum temperatures (MaxT Sens.), and average daily minimum temperatures (MinT Sens.). Life history traits include
overwintering states, geographic range (Geo. Range), phenology (average date of first flight), elevational range (Elev. Range), elevational shift (as in
Fig. 1 E–G), voltinism, body size (wingspan), breadth of habitat association (generalism), and weedy status (the text and SI Appendix have more
details). Percentage of constrained variation explained is shown in parentheses after each axis label. Four species are illustrated (clockwise from the
upper left): Boloria epithore, Epargyreus clarus, Strymon melinus, and Pontia occidentalis (Illustrations credit: M.L.F.). RDA, redundancy analysis.
locations that are potentially within dispersal distance but separated challenges facing insects in the Anthropocene. Given these de-
by elevational, climatic, and habitat differences. clines and the utility of monitoring studies for parsing different
stressors, it is worth asking: what lessons have we learned so far
Conclusions and Practical Lessons about the impacts of climate change, what are the most pressing
Reports of insect declines from monitoring programs across current questions, and what responses can be expected as we
Downloaded by guest on May 25, 2021
the world have been staggering and reflect the multifaceted progress further into the Anthropocene? Contemporary climate
6 of 9 | PNAS Halsch et al.
https://doi.org/10.1073/pnas.2002543117 Insects and recent climate changechange is having positive effects on some species and negative events, which could be particularly detrimental in diverse
effects on others (68, 69), and in some cases, the balance (of tropical areas (39, 45). Nevertheless, we believe that the
positive and negative effects) can be determined by geo- studies reviewed here offer some tangible hope. In all but the
graphic factors such as latitudinal position (23, 50) or species- most severe cases, there are some species that manage to take
specific traits (6, 7). In previous periods of change, we know advantage of anthropogenically altered conditions (69). Unlike
from the paleontological record that individual beetles have animals with larger home ranges and greater per-individual
relocated across continents (70), and distributional change is a resource requirements, insects are remarkable in the speed
commonly observed response among insects today (47). Some with which they respond to a bit of hedgerow improvement or
of the studies from Table 1 discuss traits that predict positive or even a backyard garden. In our own experience, we have been
negative responses to climate change, including whether an surprised by the resilience of the low elevations of Northern
insect is terrestrial or aquatic (24, 34), its trophic position (14, California (33). Some of these places are far from land that you
28, 29, 68, 71), its functional group (14, 28, 36), and its voltinism might spot as a target for protection: rights-of-way, train
(33, 42, 72–74). Many of these studies find support for greater tracks, levees, or drainage ditches. Yet, it was the butterflies in
climate sensitivity in higher trophic levels and positive re- those places that proved to be the most robust during the
sponses to warming for multivoltine species (relative to uni- megadrought. Of course, the butterflies at low and high ele-
voltine species); however, as can be seen from the case study vations in California still continue on downward population
(Fig. 2), trait effects can vary over relatively short distances. The trajectories, of which climate plays no small part, but if other
impact of extreme weather events or prolonged stretches of stressors could be alleviated, it might be the case that many
weather outside of historical conditions will have more consis- insects, even in close proximity to human development, will
tently negative effects across species (4, 75), although this is an continue to do what insects do best: survive.
area where additional research is urgently needed. Finally, al-
Methods
tered biotic interactions will likely have large impacts on pop-
The literature search was performed on Web of Science in February 2020 using
ulation responses to climate change, given that trophic position the search terms TS (topic) = (insect* OR lepidoptera* OR hymenoptera* OR
and degree of specialization are common predictors of success diptera* OR hemiptera* OR coleoptera*) AND TS = (climate OR weather) AND
or decline (13, 14, 28, 29, 68, 71, 76). TS = (“long term” OR “long-term” OR monitor*), which identified 2,264 studies.
Perhaps the clearest finding is the fact that we found rela- To be included in Table 1, a study had to have examined at least 10 insect
species for at least 10 y and include an analysis of climate. Data had to have
tively few studies that matched our search criteria, which were
been collected continuously (at an annual frequency or better) at one or more
focused on monitoring studies as uniquely useful for revealing sites, which could be part of a larger monitoring network. This excludes studies
impacts of climate change. Even more important, only two of that use museum specimens or resampling efforts, which are of course valuable
those studies are from tropical areas (39, 77), where the majority in their own right but make different assumptions and provide different insights
of insects live, which thus represents a major gap in our un- (especially regarding geographic ranges). Additionally, studies must have either
been restricted to a protected area or span a gradient of land use types (e.g.,
derstanding of terrestrial biodiversity in the Anthropocene. Our from developed to protected), and by “protected,” we mean relatively isolated
reading of the literature also suggests a few methodological from land conversion rather than any legal or political designation. This was
issues that could be better aligned across future studies. Re- determined by reading methods sections and looking for terms such as “pre-
sults from analyses of weather and insect populations should be serve,” “undisturbed,” “natural,” or other similar labels. We supplemented the
Web of Science search with ad hoc searches using Google Scholar focused on
reported as standardized beta coefficients to facilitate com-
individual monitoring schemes.
parisons among studies. Further, population dynamics should Analyses of Northern California butterfly data involved visualization of
be predicted by weather at both seasonal and annual scales population trends averaged at the site level, estimation of population trends at
(although not necessarily in the same model), and finer scales the species level, calculations of changes in mean elevation of occupancy per spe-
may be appropriate for certain questions or datasets. Whenever cies, and ordination of interannual population variation in association with natural
history traits. Full details on all methods are given in SI Appendix, Supplementary
possible, year or time as a variable should be included in Methods, but in brief, our visualization of populations (in Fig. 1 C and D) was based
models with weather explaining insect population or commu- on z-transformed probabilities of observation that we have shown to be indices of
nity data. Conditioning on year strengthens the inference of abundance (78). Estimation of coefficients summarizing population change over time
causation, especially when variables (insects and climate) are (Insets in Fig. 1 C and D and shading of points in Fig. 2) is based on hierarchical
Bayesian binomial models as presented in previous work with these data (56).
known a priori to be characterized by directional change.
Changes in average elevation per species (Fig. 1 E–G) used sample-based (or visit-
When year and weather variables are highly correlated, rather based) rarefaction to impose an equal number of simulated visits to a site in repeated
than simply excluding year from the model, researchers might resampling to calculate differences between time windows. The specifics of time
consider methods of trend decomposition or variance parti- windows were motivated by a desire to understand change before, during, and after
tioning, where unique and shared components of explained a millennium drought (2011 to 2015), which was the single most impactful climate
event (during our study) on the montane populations. Finally, redundancy analysis
variance by years and climatic data can be examined (11). combined many lines of information into one picture of population-specific change
In summary, the relevant scientific literature is of course not over time with respect to population-specific traits (Fig. 2).
perfect but is growing rapidly, and we know enough now to
say that the combination of climatic effects with other an- Data Availability. Butterfly presence/absence data have been deposited in Art
thropogenic stressors will certainly have interacting conse- Shapiro’s Butterfly Site at the University of California, Davis (http://butterfly.
quences (43, 58). The modernization of agriculture has ucdavis.edu/query).
removed natural habitat and increased pesticide exposure,
urbanization has paved previously open lands and introduced Acknowledgments
novel thermal and light pollutants, and tropical deforestation Thanks to David Wagner for organizing the Entomological Society of America
is destroying habitat in the most diverse regions on Earth (4). symposium where much of this paper was originally presented; Trevor Faske for
discussion of the redundancy analysis; the authors of the papers in Table 1 who
The rising threat of climate change will test the resiliency of provided feedback, especially Juha Pöyry; and two anonymous reviewers and
populations already facing such threats, especially in the Toke T. Høye for their feedback and suggestions. M.L.F. was supported by a
Downloaded by guest on May 25, 2021
context of the increasing frequency of extreme weather Trevor James McMinn professorship.
Halsch et al. PNAS | 7 of 9
Insects and recent climate change https://doi.org/10.1073/pnas.20025431171 B. R. Scheffers et al., The broad footprint of climate change from genes to biomes to people. Science 354, aaf7671 (2016).
2 G. T. Pecl et al., Biodiversity redistribution under climate change: Impacts on ecosystems and human well-being. Science 355, eaai9214 (2017).
3 R. A. Garcia, M. Cabeza, C. Rahbek, M. B. Araújo, Multiple dimensions of climate change and their implications for biodiversity. Science 344, 1247579 (2014).
4 D. L. Wagner, Insect declines in the Anthropocene. Annu. Rev. Entomol. 65, 457–480 (2020).
5 C. L. Boggs, The fingerprints of global climate change on insect populations. Curr. Opin. Insect Sci. 17, 69–73 (2016).
6 V. Kellermann, B. van Heerwaarden, Terrestrial insects and climate change: Adaptive responses in key traits. Physiol. Entomol. 44, 99–115 (2019).
7 J. G. Kingsolver et al., Complex life cycles and the responses of insects to climate change. Integr. Comp. Biol. 51, 719–732 (2011).
8 R. J. Wilson, Z. G. Davies, C. D. Thomas, “Insects and climate change: Processes, patterns and implications for conservation” in Insect Conservation Biology.
Proceedings of the Royal Entomological Society’s 22nd Symposium, A. J. A. Stewart, O. T. Lewis, T. R. New, Eds. (CAB International Publishing, Wallingford,
United Kingdom, 2007), pp. 245–279.
9 G. A. Breed, S. Stichter, E. E. Crone, Climate-driven changes in northeastern US butterfly communities. Nat. Clim. Chang. 3, 142–145 (2013).
10 V. Lepetz, M. Massot, D. S. Schmeller, J. Clobert, Biodiversity monitoring: Some proposals to adequately study species’ responses to climate change. Biodivers.
Conserv. 18, 3185 (2009).
11 P. Legendre, L. F. J. Legendre, Numerical Ecology (Elsevier, 2012).
12 L.-M. Chevin, R. Lande, G. M. Mace, Adaptation, plasticity, and extinction in a changing environment: Towards a predictive theory. PLoS Biol. 8, e1000357 (2010).
13 S. S. Renner, C. M. Zohner, Climate change and phenological mismatch in trophic interactions among plants, insects, and vertebrates. Annu. Rev. Ecol. Evol. Syst.
49, 165–182 (2018).
14 V. Baranov, J. Jourdan, F. Pilotto, R. Wagner, P. Haase, Complex and nonlinear climate-driven changes in freshwater insect communities over 42 years. Conserv.
Biol. 34, 1241–1251 (2020).
15 C. J. Macgregor, J. H. Williams, J. R. Bell, C. D. Thomas, Moth biomass increases and decreases over 50 years in Britain. Nat. Ecol. Evol. 3, 1645–1649 (2019).
16 R. L. H. Dennis et al., Turnover and trends in butterfly communities on two British tidal islands: Stochastic influences and deterministic factors. J. Biogeogr. 37,
2291–2304 (2010).
17 B. W. Brook, N. S. Sodhi, C. J. A. Bradshaw, Synergies among extinction drivers under global change. Trends Ecol. Evol. 23, 453–460 (2008).
18 D. L. Wagner, R. Fox, D. M. Salcido, L. A. Dyer, A window to the world of global insect declines: Moth biodiversity trends are complex and heterogeneous. Proc.
Natl. Acad. Sci. U.S.A. 117, 10.1073/pnas.2002549117 (2021).
19 E. C. Ellis, K. Klein Goldewijk, S. Siebert, D. Lightman, N. Ramankutty, Anthropogenic transformation of the biomes, 1700 to 2000. Glob. Ecol. Biogeogr. 19,
589–606 (2010).
20 O. T. Lewis, Climate change, species-area curves and the extinction crisis. Philos. Trans. R. Soc. Lond. B Biol. Sci. 361, 163–171 (2006).
21 M. C. Urban, Climate change. Accelerating extinction risk from climate change. Science 348, 571–573 (2015).
22 C. D. Thomas et al., Extinction risk from climate change. Nature 427, 145–148 (2004).
23 R. Fox et al., Long-term changes to the frequency of occurrence of British moths are consistent with opposing and synergistic effects of climate and land-use
changes. J. Appl. Ecol. 51, 949–957 (2014).
24 D. E. Bowler et al., Cross-realm assessment of climate change impacts on species’ abundance trends. Nat. Ecol. Evol. 1, 67 (2017).
25 J. E. Harris, N. L. Rodenhouse, R. T. Holmes, Decline in beetle abundance and diversity in an intact temperate forest linked to climate warming. Biol. Conserv. 240,
108219 (2019).
26 M. D. Hunter et al., Current temporal trends in moth abundance are counter to predicted effects of climate change in an assemblage of subarctic forest moths.
Glob. Change Biol. 20, 1723–1737 (2014).
27 P. D. Noyes et al., The toxicology of climate change: Environmental contaminants in a warming world. Environ. Int. 35, 971–986 (2009).
28 J. Jourdan et al., Effects of changing climate on European stream invertebrate communities: A long-term data analysis. Sci. Total Environ. 621, 588–599 (2018).
29 W. Voigt, J. Perner, T. Hefin Jones, Using functional groups to investigate community response to environmental changes: Two grassland case studies. Glob.
Change Biol. 13, 1710–1721 (2007).
30 C. Stefanescu, J. Carnicer, J. Pe~ nuelas, Determinants of species richness in generalist and specialist Mediterranean butterflies: The negative synergistic forces of
climate and habitat change. Ecography 34, 353–363 (2011).
31 P. J. Platts et al., Habitat availability explains variation in climate-driven range shifts across multiple taxonomic groups. Sci. Rep. 9, 15039 (2019).
32 C. J. Speights, J. P. Harmon, B. T. Barton, Contrasting the potential effects of daytime versus nighttime warming on insects. Curr. Opin. Insect Sci. 23, 1–6 (2017).
33 M. L. Forister et al., Impacts of a millennium drought on butterfly faunal dynamics. Clim. Change Responses 5, 3 (2018).
34 D. E. Bowler et al., Cross-taxa generalities in the relationship between population abundance and ambient temperatures. Proc. Biol. Sci. 284, 20170870 (2017).
35 C. M. Mutshinda, R. B. O’Hara, I. P. Woiwod, A multispecies perspective on ecological impacts of climatic forcing. J. Anim. Ecol. 80, 101–107 (2011).
36 A. M. Koltz, N. M. Schmidt, T. T. Høye, Differential arthropod responses to warming are altering the structure of Arctic communities. R. Soc. Open Sci. 5, 171503
(2018).
37 C. Román-Palacios, J. J. Wiens, Recent responses to climate change reveal the drivers of species extinction and survival. Proc. Natl. Acad. Sci. U.S.A. 117,
4211–4217 (2020).
38 A. Jentsch, J. Kreyling, C. Beierkuhnlein, A new generation of climate‐change experiments: Events, not trends. Front. Ecol. Environ. 5, 365–374 (2007).
39 D. M. Salcido, M. L. Forister, H. Garcia Lopez, L. A. Dyer, Loss of dominant caterpillar genera in a protected tropical forest. Sci. Rep. 10, 422 (2020).
40 G. Palmer et al., Climate change, climatic variation and extreme biological responses. Philos. Trans. R. Soc. B Biol. Sci. 372, 20160144 (2017).
41 M. F. WallisDeVries, W. Baxter, A. J. Van Vliet, Beyond climate envelopes: Effects of weather on regional population trends in butterflies. Oecologia 167, 559–571
(2011).
42 O. McDermott Long et al., Sensitivity of UK butterflies to local climatic extremes: Which life stages are most at risk? J. Anim. Ecol. 86, 108–116 (2017).
43 T. H. Oliver et al., Interacting effects of climate change and habitat fragmentation on drought-sensitive butterflies. Nat. Clim. Chang. 5, 941–945 (2015).
44 P. Soroye, T. Newbold, J. Kerr, Climate change contributes to widespread declines among bumble bees across continents. Science 367, 685–688 (2020).
45 D. H. Janzen, W. Hallwachs, To us insectometers, it is clear that insect decline in our Costa Rican tropics is real, so let’s be kind to the survivors. Proc. Natl. Acad.
Sci. U.S.A. 117, 10.1073/pnas.2002546117 (2021).
46 C. P. Nadeau, M. C. Urban, J. R. Bridle, Climates past, present, and yet-to-come shape climate change vulnerabilities. Trends Ecol. Evol. 32, 786–800 (2017).
47 J. S. Bale, S. A. L. Hayward, Insect overwintering in a changing climate. J. Exp. Biol. 213, 980–994 (2010).
48 T. H. Oliver, D. B. Roy, T. Brereton, J. A. Thomas, Reduced variability in range-edge butterfly populations over three decades of climate warming. Glob. Change
Biol. 18, 1531–1539 (2012).
49 J. Pöyry et al., Climate-induced increase of moth multivoltinism in boreal regions. Glob. Ecol. Biogeogr. 20, 289–298 (2011).
50 C. A. Deutsch et al., Impacts of climate warming on terrestrial ectotherms across latitude. Proc. Natl. Acad. Sci. U.S.A. 105, 6668–6672 (2008).
51 C. Garcı́a-Robledo, E. K. Kuprewicz, C. L. Staines, T. L. Erwin, W. J. Kress, Limited tolerance by insects to high temperatures across tropical elevational gradients
and the implications of global warming for extinction. Proc. Natl. Acad. Sci. U.S.A. 113, 680–685 (2016).
52 F. Johansson, G. Orizaola, V. Nilsson-Örtman, Temperate insects with narrow seasonal activity periods can be as vulnerable to climate change as tropical insect
species. Sci. Rep. 10, 8822 (2020).
Downloaded by guest on May 25, 2021
53 S. R. Loarie et al., The velocity of climate change. Nature 462, 1052–1055 (2009).
8 of 9 | PNAS Halsch et al.
https://doi.org/10.1073/pnas.2002543117 Insects and recent climate change54 A. J. Suggitt et al., Extinction risk from climate change is reduced by microclimatic buffering. Nat. Clim. Chang. 8, 713–717 (2018).
55 C. Moritz, R. Agudo, The future of species under climate change: Resilience or decline? Science 341, 504–508 (2013).
56 C. C. Nice et al., Extreme heterogeneity of population response to climatic variation and the limits of prediction. Glob. Change Biol. 25, 2127–2136 (2019).
57 K. L. Casner et al., Contribution of urban expansion and a changing climate to decline of a butterfly fauna. Conserv. Biol. 28, 773–782 (2014).
58 M. L. Forister et al., Compounded effects of climate change and habitat alteration shift patterns of butterfly diversity. Proc. Natl. Acad. Sci. U.S.A. 107, 2088–2092
(2010).
59 M. L. Forister et al., Increasing neonicotinoid use and the declining butterfly fauna of lowland California. Biol. Lett. 12, 20160475 (2016).
60 A. E. Kelly, M. L. Goulden, Rapid shifts in plant distribution with recent climate change. Proc. Natl. Acad. Sci. U.S.A. 105, 11823–11826 (2008).
61 J. Lenoir et al., Going against the flow: Potential mechanisms for unexpected downslope range shifts in a warming climate. Ecography 33, 295–303 (2010).
62 M. W. Tingley, M. S. Koo, C. Moritz, A. C. Rush, S. R. Beissinger, The push and pull of climate change causes heterogeneous shifts in avian elevational ranges.
Glob. Change Biol. 18, 3279–3290 (2012).
63 C. van Swaay, M. Warren, G. Lois, Biotope use and trends of European butterflies. J. Insect Conserv. 10, 189–209 (2006).
64 T. Wepprich, J. R. Adrion, L. Ries, J. Wiedmann, N. M. Haddad, Butterfly abundance declines over 20 years of systematic monitoring in Ohio, USA. PLoS One 14,
e0216270 (2019).
65 Y. Melero, C. Stefanescu, J. Pino, General declines in Mediterranean butterflies over the last two decades are modulated by species traits. Biol. Conserv. 201,
336–342 (2016).
66 A. M. Shapiro, “The temporal component of butterfly species diversity” in Ecology and Evolution of Communities, M. L. Cody, J. W. Diamond, Eds. (Belknap,
Harvard University, Cambridge, MA, 1975), pp. 181–195.
67 J. H. Thorne, R. M. Boynton, L. E. Flint, A. L. Flint, The magnitude and spatial patterns of historical and future hydrologic change in California’s watersheds.
Ecosphere 6, 1–30 (2015).
68 B. Martay et al., Impacts of climate change on national biodiversity population trends. Ecography 40, 1139–1151 (2017).
69 M. Dornelas et al., A balance of winners and losers in the Anthropocene. Ecol. Lett. 22, 847–854 (2019).
70 G. R. Coope, Tibetan species of dung beetle from Late Pleistocene deposits in England. Nature 245, 335–336 (1973).
71 W. Voigt et al., Trophic levels are differentially sensitive to climate. Ecology 84, 2444–2453 (2003).
72 C. J. Macgregor et al., Climate-induced phenology shifts linked to range expansions in species with multiple reproductive cycles per year. Nat. Commun. 10, 4455
(2019).
73 C. Hassall, J. Owen, F. Gilbert, Phenological shifts in hoverflies (Diptera: Syrphidae): Linking measurement and mechanism. Ecography 40, 853–863 (2017).
74 D. B. Roy, P. Rothery, D. Moss, E. Pollard, J. A. Thomas, Butterfly numbers and weather: Predicting historical trends in abundance and the future effects of climate
change. J. Anim. Ecol. 70, 201–217 (2001).
75 D. H. Janzen, W. Hallwachs, Perspective: Where might be many tropical insects? Biol. Conserv. 233, 102–108 (2019).
76 M. L. Forister et al., The global distribution of diet breadth in insect herbivores. Proc. Natl. Acad. Sci. U.S.A. 112, 442–447 (2015).
77 V. Grøtan, R. Lande, S. Engen, B. E. Saether, P. J. DeVries, Seasonal cycles of species diversity and similarity in a tropical butterfly community. J. Anim. Ecol. 81,
714–723 (2012).
78 K. Casner, M. L. Forister, K. Ram, A. M. Shapiro, The utility of repeated presence-absence data as a surrogate for counts: A case study using butterflies. J. Insect
Conserv. 18, 13–27 (2014).
79 H. Gibb, B. F. Grossman, C. R. Dickman, O. Decker, G. M. Wardle, Long-term responses of desert ant assemblages to climate. J. Anim. Ecol. 88, 1549–1563
(2019).
80 A. M. Iler et al., Maintenance of temporal synchrony between syrphid flies and floral resources despite differential phenological responses to climate. Glob.
Change Biol. 19, 2348–2359 (2013).
81 V. Devictor et al., Differences in the climatic debts of birds and butterflies at a continental scale. Nat. Clim. Chang. 2, 121–124 (2012).
82 C. A. Hallmann et al., More than 75 percent decline over 27 years in total flying insect biomass in protected areas. PLoS One 12, e0185809 (2017).
83 C. A. Hallmann et al., Declining abundance of beetles, moths and caddisflies in The Netherlands. Insect Conserv. Divers. 13, 127–139 (2019).
84 O. Ovaskainen et al., Community-level phenological response to climate change. Proc. Natl. Acad. Sci. U.S.A. 110, 13434–13439 (2013).
85 J. E. Stewart, J. G. Illán, S. A. Richards, D. Gutiérrez, R. J. Wilson, Linking inter-annual variation in environment, phenology, and abundance for a montane butterfly
community. Ecology 101, e02906 (2020).
86 J. F. Wilson et al., Climate association with fluctuation in annual abundance of fifty widely distributed moths in England and Wales: A citizen-science study.
J. Insect Conserv. 19, 935–946 (2015).
Downloaded by guest on May 25, 2021
Halsch et al. PNAS | 9 of 9
Insects and recent climate change https://doi.org/10.1073/pnas.2002543117You can also read