Institutional Presentation - June / 2015 - Ser Educacional
←
→
Page content transcription
If your browser does not render page correctly, please read the page content below
Institutional Presentation
                June / 2015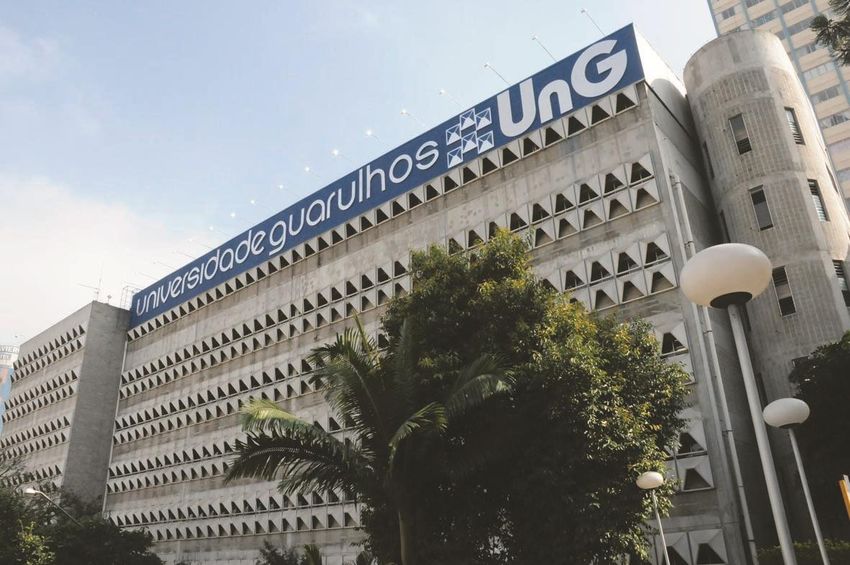
Disclaimer

This material reflects management’s expectations and may contain estimates related to future events. Any information, data, forecasts or future
plans herein refer to estimates, and therefore can not be taken as concrete evidence or a promise to the market. Ser Educacional is not
responsible for investment operations or decisions taken based on the information herein. These estimates are subject to change without prior
notice.

This material has been prepared by Ser Educacional S.A. (“Ser Educacional" or the “Company”) in accordance with the highest national and
international standards, and it includes certain forward-looking statements that are primarily based on Ser Educacional’s current expectations
and projections of future events and financial trends that currently affect or may affect the Company’s business, and therefore they are not
guarantees of future performance. They are based on management’s expectations and involve a number of risks and uncertainties that could
lead the Company’s financial situation and operating results to differ materially from those expressed in Ser Educacional’s forward-looking
statements. Ser Educacional assumes no obligation to publicly update or revise any forward-looking statements.

This material is disclosed solely for informational purposes and should not be construed as a request or an offer to buy or sell any shares or
related financial instruments. Accordingly, this presentation is not a recommendation of investment and should not be considered as such. It is
not related to specific investment objectives, financial situation or particular needs of any recipient, neither does it make a statement or provide
a guarantee, either express or implied, related to the accuracy, completeness or reliability of the information herein. This presentation should not
be regarded as a substitute to the recipients’ judgment. Any opinion expressed herein is subject to change without prior notice and Ser
Educacional does not assume the obligation to update or revise them.

                                                                                                                                                       2
Agenda

Ser Educacional Profile
                                             1
Competitive Advantages
                                             2
Multiple Growth Opportunities
                                             3
Successful Track Record
                                             4
Brazilian Undergraduate Education Industry
                                             5
Attachments
                                             6
                                                 3
Uninassau
Campus Recife, Pernambuco / Brazil

                                     1 Ser Educacional Profile   4
One of Brazil’s Largest Private Education Groups and Leader in the
Northeast and North Regions

                                                                Compounded Average Growth Rate:45%               Net Revenue R$MM
 Leader in number of enrolled students in the NE and NO
 Regions with growth above the Brazilian average

 163,000 enrolled students
 35 Campi in 24 cities and 12 states
                                                                                                                             820
                                                                                                              705
                                                                                                  456
 Leading Brands: UNINASSAU, UNAMA and UnG                           184         283

                                                                    2011        2012             2013         2014         2015(LTM)
 Value Proposition to Students
 Quality education, infrastructure and standardized processes   Above Market Average Operating Margin Adjusted EBITDA R$MM

 Low Financial Leverage
 1Q15: Net Debt of R$246.3mm (0.85x LTM EBITDA)                                                                              289.6
                                                                                                               248

 Track record of success in M&A                                    29.6%       30.9%             33.8%                       35.3%
 20 acquisitions in 12 years                                                                      154
                                                                                 88                         35.1%
                                                                    54
 Listed in IBRX-100
 ADTV 3M > R$10mm | Free float 30%                                  2011        2012             2013         2014         2015(LTM)
                                                                           EBITDA Ajusted R$MM           EBITDA Margin %               5
12 Years of Consistency: Organic Growth + M&A + Strategic and
Financial Discipline
Foundation and first growth Professionalization and Consolidation and
New growth cycle
phase model improvement second growth phase
Inauguration of units in
Fortaleza, Mercês and
Acquisition of FABAC, Acquisition of FASE
Caruaru
ESAMC and CDF College
Accreditation as a university Acquisition of FAL
Cartesian Group investment
center Acquisition of Unama/FIT
Foundation of Implementation of BoD
Acquisition of units in Manaus Acquisition of UNG
Maurício de Inauguration of Joaquim and São Luís
Nassau College Nabuco College in Recife
2003 2007 2008 2011 2012 2013 2014 2015 - 2020
IPO
EAD
Inauguration of João Acquisition of 3 units in Piauí
Pessoa and Campina Acquisition of M&A
Grande units units in Belém Acquisition of
Organic Growth
and Aracaju Decisão College and
Inauguration of Geographical
Vitória da Conquista Unit
Joaquim Nabuco Expansion
College in Paulista Permission to operate in the
Distance Learning market Maintenance in Rio
Local Player Regional Player National Player
6
Maurício de Nassau College
                          Fortaleza / Ceará, Brazil

2   Competitive Advantages
                                                 7
Solid Fundamentals that Allow Growth and Profitability

                      Leader in the North and Northeast - the fastest growing regions in Brazil   1

                      Differentiated value proposition to the student                             2

                      High scalability, reproducibility and standardization                       3

                      Ability to identify and seize opportunities                                 4

                     Solid corporate governance and corporate management                          5

                                                                                                      8
1     Leadership in the Northeast and North | Solid Student Base,
         Strong and Recognized Brands in their Regions

135,600 Undergraduate Students: 35 Units 1 University Centers, 2 Universities in 12 states and 24 cities                 Most Recognized Brands**
                                                                                                                          Cities in operation- 2014
                       North                                                             Northeast

                                                                                                                                     City             Ranking
       Amazonas*               Pará*                        Maranhão                 Piauí             Ceará
                                                                                                                                       Recife             1
       Students: 984           Students: 23.411             Students: 597            Students: 8.576   Students: 6.544
       Units: 1                Units: 6                     Units: 1                 Units: 3          Units: 1
                                                                                                                                     João Pessoa          1
                                                                                                       R. G. do Norte

                                                                                                                         Northeast
                                                                                                       Students: 5.069                Fortaleza           2
                                                                                                       Units: 1

                                                                                                       Paraíba
                                                                                                                                       Maceió             1
                                                                                                       Students:16.548                  Natal             2
                                                                                                       Units: 2
                                                                       Bahia
                                                                                                       Pernambuco                      Teresina           2
          Southeast                                                    Students: 6.678
                         São Paulo**                                                                   Students:39.129
                                                                                                                                                          1

                                                                                                                         NO
                                                                                                                                        Belém
                                                                       Units: 3                        Units: 10
                         Students: 19.675
                                                                                     Sergipe

                                                                                                                         SE
                         Units: 5                                                                      Alagoas                        Guarulhos           1
                                                                                     Students: 1.393   Students: 7.018
                                                                                     Units: 1          Units: 1
                                                                                                                                                                9
North and Northeast | Market Penetration Still Low

2013 Undergraduate Penetration                                           Students by Region x Score > 450 in ENEM
                                                                         thousand
Number of enrollments / Population aged between 18 and 24

                                                                                                           2013 Undergraduate freshmen from Public and Private institutions         ENEM 2013
                                                                                      Region
                                                                                                                Freshmen - Public     Freshmen - Private                      Students >   % of Base >
                                                                                                                                                                   Total
                                                                                                                   Institutions           Institutions                           450           450
                                                        Northeast
                                                         10.6%                         North                          45.8                  157.9                  203.7        238.5           85%
                                                                                    Northeast                         140.5                 373.8                  514.3        812.5           63%
     North                                                                          Southeast                         185.0                 1,129.1               1,314.1      1,166.3          113%
     10.4%                                                                             South                          110.0                 320.6                  430.6        393.7           109%
                                                                                     Midwest                          50.5                  229.7                  280.2        226.7           124%
                          Midwest
                                                                                       Total                          531.8                 2,211.1               2,743.0      2,837.7          97%
                          19.7%
                                                                         Enrollment growth                                                       Undergraduate students in Brazil: 7.3 million - 2014
                                                                         Private On-Campus Undergraduates 2003-2013

                                                                                                                                                  Southeast
                                                                                                                       133%                         45%                         North 5%
                                                   Southeast
                                                    16.1%
                     South                                                                                                          100%                                                           28%
                                                                            88%
                     18.6%                                                                   74%            75%
                                                                                                                                                                                    Northeast
                                                                                                                                                                                      19%

     Number of post-                   People within the                                                                                                                        Midwest 10%
     secondary                         post-secondary age                                                                                                     South 21%
     students                          range                               South           Southeast     Midwest      Northeast     North
         Source: MEC/INEP, IBGE, Hoper, Anuário Valor Econômico, Microdados and McKinsey
                                                                                                                                                                                                         10
2 Differentiated Value Proposition to the Student
Focus on
Great cost-benefit to the
Academic quality Good infrastructure Standardized processes Employability
student
What matters for the sudent?
1- Location: 21.6%
2- Quality: 20.4%
3. Market recognition: 10 %
4 Infrastructure: 8.4%
Source: hoper
Brands Recognized by the Labor Market
112 Quality Teaching
89% of Units with IGC Equal or Above 3 (2013) | includes UNAMA and UnG High Student Satisfaction and Labor Market Recognition (2013/14)
IGC2 IGC4 5%
11%
Are currently employed or intern 66%
believe that the image of the institution in society , very
good or excellent 86%
Are satisfied with their courses 96%
Recognize the qualification of teachers 92%
consider that the knowledge acquired in their courses suit
your professional needs 91%
IGC3 84%
IGC by Brand 95% of all Courses have CPC above 3 (2013) – Including UNAMA and UnG
CPC2
CPC4
8%
10%
7%
80% 100% 100% 100% 100%
13%
Nassau Nabuco Unama FIT UnG
IGC2 IGC3 IGC4 CPC3 82%
123 Well Located Units and Infrastructure Dedicated to Education
Strategic location of Units Infrastructure Focused on Education
Air-conditioned rooms Comprehensive Specialized
Distance Learning
including Multimedia collections laboratories
Wide Spaces Sports Arenas Auditoriums Studios
Benefits of Location
1 Primordial for the student
2- Impact on perception of value
3- Reduction of transportation cost
4 Convenience Clinics Modern Equipment Accessibility Wifi
5- Facilitates marketing actions3 Scalability, Repeatability and Standardization
Learning Center Student Service Business Management
Student Relationship Service Sharing
Unified syllabus
Center (SRA) Center (CSC)
Electronic attendance
Integrated Processes Control by indicators
ledger
Academic auditing Self-service and online access Service Level Agreements
Standard systems,
Standardized tests procedures, and Support for future growth
proceces :ISO 9001
144 Ability to Identify and Seize Opportunities
Knowledge of legislation and regulating agencies
Mercado de trabalho
Founder and controlling shareholder has been presiding the Agility in offering
Brazilian Association of Colleges (Abrafi) for 8 years, and acts Courses offering according to Pronatec`s vocational
as vice president of the Brazilian Association of Sponsors of the demands of the labor courses
Higher Education (Abmes) market : focus on employability
One of the leaders in
vocational course
Strong track record in quickly obtaining authorization for new segment
courses (anticipation of trends)
Standardization and
investments in technology
Periodical market surveys in all cities where the group
allow scalability and fine-tune
operates – allows the Company to anticipate demands
the provision of courses ,
according to each unit needs
Active board of directors with independent members
155 Solid Corporate Governance and Business Management
Valor Econômico Newspaper
Ranking 2014 (based on 9M14)
Education Industry
Recognition in 2014
2 Independent Board Members Minimum dividend distribution of EBITDA Margin 1
25% of net income 1- Company of the year - middle
market, Isto é Dinheiro magazine
Directors with solid business
and 2- Financial performance Net Income /
1
financial markets Proactive and well recognized by Valor Econômico Shareholders` Equity
experience Dividend
aligned newspaper
board of directors Policy
3- Brands I Like - Recife
Net Margin 1
Current ratio 3
Proactive committees 100% tag-along
High level listing
Auditing and Finance and Fiscal Council
ADTV above R$10mm
and listed in IBRX-100
HR and Corporate
Governance Adherent to BM&Fbovespa
Novo Mercado regulation
Fiscal Council
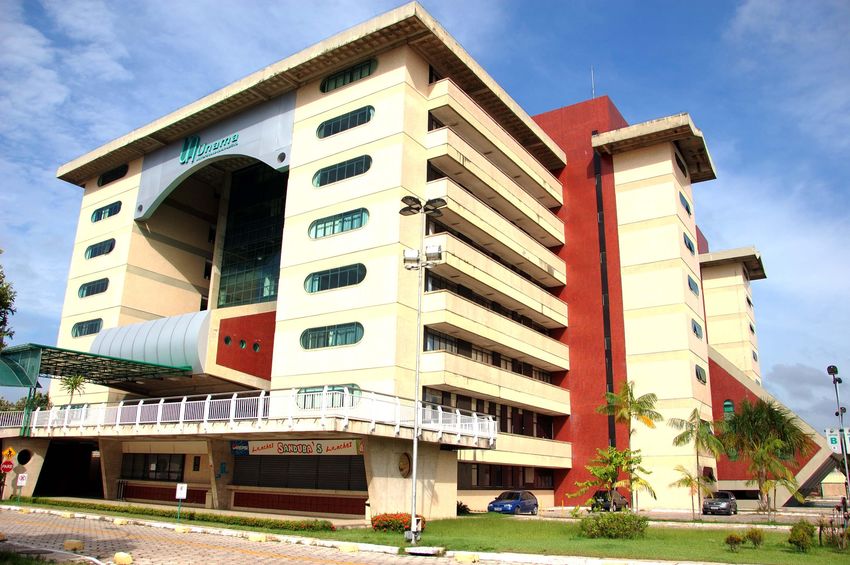
16UNAMA – Universidade da Amazônia
Campus BR– Belém / Pará, Brazil
3 Multiple Growth Opportunities 17Ser Educacional | from Regional to National
Drivers Expansion of Students and Revenue Base Result Maximization Drivers
Recent
Organic Growth Distance Learning Acquisitions Geographical
NO/NE/SE Development Synergies Expansion Academic Quality
Portfolio Increase High profitability Implement SER Expansion of
courses: more potential model in recent existing brands in
attractive acquisitions their operating
Business organic
regions and
25 new units by development Capture cost and
neighboring
2017/18 revenue synergies Technology and
High potential for Standardization
Opportunistic
Two new University profitability Expand student
acquisitions
Centers pending in base
Partnership with
MEC Distance
Pearson fully
learning
Pronatec operational
Financial
Learning Discipline
Proven experience in
Institutions “Profitability
existing courses Leader” 182014: Recent Acquisitions and Organic Growth
+32,000 on-campus students
Faculdade Mauricio
Opening (M&A)
de Nassau
Location Manaus / AM
Location Belém / Santarem (PA)
Units 1 Initiation of enrollment in new
Students 12,200 Purpose Consolidation - North units in 2015
Units 4
Faculdade Mauricio
Price R$151.2 million Opening
de Nassau +2,000 distance learning students
Date October 2014 Location São Luiz / MA
(Dec/14)
Purpose Consolidation - North Units 1
Purpose Consolidation - NE
Opening Distance Learning
Location Northeast Region Total: +34,000 students
Centers 9
Date January 2014
Purpose New businesses
Acquisition FAL / FASE
São Lourenço da Mata
Location
e Olinda (PE) Dilution of CSC/CRA costs
Students 1850
Location Guarulhos (SP) Units 2
Students 17,000 Price R$11.1 million
Purpose Consolidation - NE Expansion of the student base via
Units 5 the SER model
Maintenance Bennett
Price R$199.1 million
Location Rio de Janeiro (RJ)
Purpose Entry to SE / São Paulo Synergies from the acquisitions
Price R$10 million estimated at R$50 million in 5 years
Entry to SE / Rio de
Purpose
On-Campus Janeiro
Distance Learning 19Recent Acquisitions| Strategic Checklist
Strategic
Strategic Checklist Benefits
1 Leadership in its region
2 Brand recognized by students and labor market
Accelerate consolidation
in the North
3 Good academic indicators (igc >3)
4 High potential for generating synergies
Cost Dilution CSC/CRA
5 Low exposure to FIES
1ª Private Dominant in
Solid presence in
University in the Guarulhos, 2nd
Santarem (Pará / Brazil)
6 Individual strategic benefits: North largest city in
the state of SP
Dominant in
Belém/PA 45 years of Kick-off
operations Regional – National Transition
20Integration of Recent Acquisitions will Create a New Wave of “SER
Impact"
Integration Roadmap
Back office
Creation of new
migration Shared
courses and Syllabus Physical structure Geographic
Services and
pricing/vacancy unification improvement Expansion
Student
revaluation
Relationship Centers
Completed Under execution
Benefits Affected After Integration
Intelligent portfolio
Standardization and management courses
Efficient
Value proposition SER Impact
process automation management of
and commercial to the student
physical spaces Student base expansion
excellence
Increase operational margins
Long Distance in the In acquired units
Intensive use of technology Large, multimedia ,
classroom / Pronatec e Course Employability
air-conditioned classrooms Student satisfaction
Mix
Quality improvement Active pricing and Maximize number of Geographical expansion
and cost reduction sales channel management Quality at a fair price
classrooms per unit
21Distance Learning Development - EAD
Strategic location of Units New Initiatives
2.5 thousand students in 9 learning centers Graduation Courses
Distance learning graduation: 15 courses
Intake of 1.6 thousand students in 1Q15
25 Learning centers in the North, Northeast and Southeast regions
100% online model
Expansion to On-Campus Undergraduation
Partnership with
Offering 20% of the workload from 2 to 13 disciplines
Capacity to reach 18,000 students
Strong brand and similar syllabus
22
compared to on-campus model
+ brand awareness and cost synergiesUNG –Guarulhos University
Campus Downtown – Guarulhos/São Paulo, Brazil
4 Successful Track Record
23Student Base & Breakdown
Student Base (thousands) Student Profile
87% of the FIES student base scored more than 450 points
29% of Grupo SER`s student base has FIES financing
35% of Grupo SER`s on-campus undergraduate student base has FIES financing
Student Base 1Q15
Graduation
5%
163
Vocational
128.5 10%
Distance
98.8 Learning 2%
56.7
40.8
32.9
23 24.7
0.5 8.4 13.1
2003 2006 2007 2008 2009 2010 2011 2012 2013 2014 1T15
Undergradu
ation 83%Net Revenue
Annual Net Revenue (R$ million) Quarterly Net Revenue (R$ million)
705
269.5
457
204
176 171
154
283
125
107 114 112
184
141
2010 2011 2012 2013 2014 1Q13 2Q13 3Q13 4Q13 1Q14 2Q14 3Q14 4Q14 1Q15
25Adjusted EBITDA
Adjusted EBITDA (R$ million) – unaudited pro forma Unama and UnG Quarterly Adjusted EBITDA (R$ million)
37.1%
35.1%
33.8%
30.9%
29.6% 104.6
247.8
62.7 65.4 64.9
44.7% 54.8
40.6% 38.8%
154.5 47.8 37.2% 38.0%
33.6% 33.2%
38.2 37.0
31.4
25.2% 26.9%
87.6
52.4 54.2
2010 2011 2012 2013 2014 1Q13 2Q13 3Q13 4Q13 1Q14 2Q14 3Q14 4Q14 1Q15
Adjusted EBITDA EBITDA Margin
26Cost of Services and General and Administrative Expenses
Cost of Services Rendered (ex.depreciation/amortiz.) Annual (R$ million) Cost of Services Rendered (ex depreciation/amortiz.) Quarterly (R$ million)
257.1
173.1
37.5%
34.0% 95.7
37.9% 84.1
34.3% 36.5%
97.3 43.3 42.5 53.3 61.6 59.4
68.8 51.9
42.8% 41.3%
48 38.1% 38.1% 35.1% 34.7% 35.5%
33.6%
2010 2011 2012 2013 2014 2Q13 3Q13 4Q13 1Q14 2Q14 3Q14 4Q14 1Q15
Cost of Services Cost of Services / Net Revenue Cost of Services Cost of Services / Net Revenue
Annual SG&A (ex depreciation/amortiz.) (R$ million) Quarterly SG&A (ex depreciation/amortiz.) (R$ million)
185.9
122.6
90.6 65.1
57.9
58.9 45.4 44.6
38.4 38.0
32.0% 26.8% 26.4% 30.5 29.5
39.0 24.2
26.8% 26.4% 30.6% 28.4%
27.6% 32.1% 22.6% 24.6% 25.9% 26.1% 24.2%
2010 2011 2012 2013 2014 1Q13 2Q13 3Q13 4Q13 1Q14 2Q14 3Q14 4Q14 1Q15
SG&A SG&A / Net Revenue SG&A SG&A / Net Revenue 27Net Income & Net Margin
Annual Net Income (R$ million) Quarterly Net Income (R$ million)
213.9
82.8
116.3
58.7 57.7
53.7
43.8
39.8
64.3
29.1
26.0
37.1% 21.5 38.0%
35.7 31.6 30.6% 33.7% 30.7%
30.3% 25.6%
25.3% 22.7% 25.5% 23.3% 21.5%
17.2% 17.3%
2010 2011 2012 2013 2014 1Q13 2Q13 3Q13 4Q13 1Q14 2Q14 3Q14 4Q14 1Q15
Net Income Net Margin Net Income Net Margin
28Accounts Receivable Turnover
148 151
116 119
109 113 110 135
98 98 93
111
93 81 105
71 86 100
76 80
67
57
1Q13 2Q13 3Q13 4Q13 1Q14 2Q14 3Q14 4Q14 1Q15
Average Term Average Term (FIES) Normalized Average Term
Federal Government payment of R$58.8mm in may/15: R$ 52.8mm FIES (dec/14) and R$6mm PRONATEC (jan/15)
29Cash and Debt (R$MM)
Gross Debt Cash Flow Evolution 4Q14 x 1Q15
Short Term
Long Term
Commitments $108.8
173.7
127.5 65.8 $136.7
19.7 $105.5 104,5*
$38.1
90 74.7 $18.7
$45.7
$62.5 $5.1 $7.4
17.8 33.3
Cash + Operating Accounts Capex Acquisitions Loans and Debt Dividends Cash and
4Q14 1Q15 Investments Activities receivable Financing Amortization paid Equivalents
4Q14 variation 1Q15
Net Debt Debt Amortization Schedule
Net Debt
Debt
Net Debt / EBITDA (LTM)
246.3 Acquisitions
187.5* 105.1
0.65x
0.85
187.5* 70.0 56.3
0.65x
49.2 40.3
37 29.5 31.1
25.3
0.15 23.3
35.1 26.7 21.4 10.0
23.9 17.1 9.7 10.0
4Q14 1Q15
*Federal Government payment of R$58.8mm in may/15: R$ 52.8mm FIES (dec/14) and R$6mm PRONATEC (jan/15) Short Term 2016 2017 2018 2019 after 2020 30Investments (Capex)
Historical Capex (R$ million) 1Q15 Capex BreakdownR$100.5MM
295.6
Software Licenses
2%
Equipment / Library / IT
18%
134.3
142.8
36.4 Acquisitions
119.5 62%
82.1 17.1 64.4
2.1 6.9
Property acquisition /
63.3 2.2 construction /
49.7 124.9 renovations
2.5 95.5
2.7 77.8 78.4 18%
60.8 47.0
2010 2011 2012 2013 2014 Approved for
2015
Fixed Assets Intangíble Assets Acquisition of Subsidiaries
31UNAMA and UnG Pro Forma Results
322015.1 Intake and Ordinances/SISFIES Limitations
Status 2015.1 Intake Measures | Ordinances and SISFIES Limitations
Students (thousands) 1Q15 1Q14** %∆ Measures Impact or Sensitivity Analysis Initiatives
87% of SER Group’s 2014 student base Creation of private student loans as an
had scores of more than 450 points alternative to FIES:
Undergraduate Intake 45.6 37.5 21.8% Limit of 450
Points 4.8% of 2H14 enrollments had scores of
less than 450 points Financing of up to 100% of tuition
(Ordinance 21) (expectation: of 50% on average)
Organic Growth 28.2 28.0 +0.7% 42.7% of undergraduate students have
FIES agreements Tuition divided into two installments
On-Campus 26.6 27.3 -2.5% Change in 2015
and the student begins paying a
Payment Flows smaller amount during the course
Increase in average receivable days
(Ordinance Ser Educacional subsidy: students
Distance Learning 1.6 0.7 119.2% 23/14 and 2/15) will pay only 3.4% p.a.
Unama / FIT 10.9 3.5* 208.9% Price Negotiation of new partnerships with private
Increase Limit Tuition average increase of 7% banks and repositioning of EDUCRED (Ser’s
of 6.41% own financing line)
UnG 6.5 5.9* 10.4%
Dropouts 1Q15
FIES effect in 1Q15 Intake
Graduation 1.1 2.0 -46.5% 12.1%
• 9,700 new FIES students in the quarter 10.8%
Vocational 0 0 0% • FIES funnel still has 600 contracts on
completion status
• Of the 12,800 students who signed contractual
amendments, 5,500 were able to enter the FIES
contract funnel
* Intake made by previous shareholders 1Q14 1Q15
**ProformaKey Messages in this Roadshow
1 Ser Educacional still shows solid fundamentals
2 Recent developments to bring more strength to the Company (Expansion in the Southeast, Fiscal Council and
new Vice President)
3 Low Market penetration is still the main growth driver
4 FIES uncertainties/reductions will require more attention to avoid dropout risks and bad debt in 2015
5 Opportunity to Ser Educacional to be stronger in the long term
34Uninassau Aracaju/Sergipe, Brazil
4 Brazilian Education Industry
35Trends and Demand Drivers in the Brazilian Undergraduation Industry
Trends and Demand Drivers Private Undergraduate Market Share #students - 2013
• Convenience, affordability, and
quality are likely to raise the
number of enrollments in
distance-learning courses
10 largest
• Growth in Fies, 39%
• Higher purchasing Other
Distance learning ProUni, and Pronatec institutions
power and low
student financing 61%
penetration of post-
programs reshaping
secondary education in
Principais the sector in Brazil
Brazil help increase determinantes da
future demand in the demanda
• Demand stimulation
sector
Kroton+Anhanguera, Estácio, Unip, Laureate, Uninove, Unicsul, Ânima,
Ser Educacional, Whitney, Devry e Grupo Tiradentes-Unit
• Capitalized groups should
prevail Undergraduate students evolution
• Increasing importance of 2,391
Tendências 2,378
strong and recognized 2,270
do setor
brands
• Students less sensitive to 1,859
prices
• Market still very widespread
• Changes to decision and with room for
based on quality consolidation 1,097
• Courses designed to meet
the requirements of the
labor market
1999 2003 2006 2010 2013
Source: Valor Econômico Education Yearbook, MEC/INEP Database, Post-secondary education synopsis, 2013: includes Universities, University Centers, Integrated Colleges, Colleges, institutes, Vocational centers and CEFETIFET 36Brazilian Post-Secondary Education Sector
Undergraduate Student Base (million) College Penetration Rate (net)*
Public Private Addressable market: 35mm students 33%
6,9 7,3 - 23.3mm inhabitants between18-24 years
6,6
5,3 old
5,0 5,0
4.9 5.1 5.4 15%
3.8 3.7 3.9 - 12.2 mm inhabitants between 24-35 years
old without full undergraduate course
1.2 1.3 1.4 1.7 1.8 1.9 19.7%
18.6%
16.1%
2008 2009 2010 2011 2012 2013
Rules to access FIES 10.4% 10.6%
Undergraduation Penetration 2013
Institutions
95% Courses must be on-campus
IGC igual or above 3 North Northeast Southeast South Midwest
76% 71%
59% 59% Hold a debt clearance certificate (CND) Rate by region Brazil`s average National education
rate plan target
34% Students
28%
Approval note and minimum frequency
450 points in ENEM (as of apr/15) Average income by education level
R$50/quarter – effective interest rate: 3.5% p.a. Workers as a % of total
USA Russia Argentina United Chile Mexico Brazil
Kingdom
FIES Funding Criteria
FIES Student Base (million) 0% 0%
5%
% of wallet committed % financed 6% 10% 4% 8%
9% 6% 19%
Private Penetration 1,660 Family income below 10 minimum wages 13% 14%
= or greater than 60% 100% 48% 34%
48% 20%
1,150 Between 40% and 60% 75% 35%
Between 20% and 40% 50%
23%
631 Family income between 10 and 15 minimum wages 44% 38%
40% 28%
Higher than 40% 75% 16%
295 9% 16% 9% 8% 7%
217 172 190 Between 20% and 40% 50%
4% 3% 4% 4% Family income between 15 and 20 minimum wages Basic Secondary Undergraduate Master Doctorade
Higher than 20% 50%
2008 2009 2010 2011 2012 2013 2014 up to 1.5 1.51 to 4 4.01 to 10
Source: MEC/INEP, IBGE, Hoper, Anuário Valor Econômico e UNESCO | Special thanks to Bank of America Merrill Lynch research team 10.1 to 15 15.01 to 20 more than 20FIES | Evolution and Comparables
FIES Contracts Evolution Comparable Spending per Student per year
1,712,960
1,131,001
585,503 44.200
74,196 222,871 39.100 38.900
591.959
545.498 32.800
324,200 21.800
362.632 282,107
187,939
4.700
148.675 1.700
263,391 257,759
74.196 102,845 174,693
71,676 45,830 Unicamp USP UnB UFRJ UFSCAR FIES PROUNI
2,520
2010 2011 2012 2013 2014
BB CEF Acumulado
FIES Annual Expense as a % of total investment in education Total FIES student debt as a % of GDP
3,5% em
2029
5% em
2016
Fonte:, Credit Suisse e Itaú 38Contact
Jânyo Diniz
CEO
Nazareno Habib Bichara
CFO
Rodrigo Alves
IR Officer
Geraldo Soares
IR Manager
Tel.: (5511) 2769 3223
E-mail: ri@sereducacional.com
Website: www.sereducacional.com/ir
39e
39Faculdade Joaquim Nabuco
Campus Recife/PE
6 Attachments
40Uninassau marketing materials / Sports Sponsorship
Intake Marketing Campaigns Sports Sponsorship Programs
41Ser Educacional Events and Congresses
42You can also read