Institutional Presentation - June/2019 - Hypera Investor Relations
←
→
Page content transcription
If your browser does not render page correctly, please read the page content below
Institutional Presentation
                   June/2019
Disclaimer

    This release contains forward-looking statements that are exclusively related to the prospects of the business, its operating and
    financial results, and prospects for growth. These data are merely projections and, as such, based exclusively on our management's
    expectations for the future of the business and its continued access to capital to fund its business plan. These forward-looking
    statements substantially depend on the market conditions, government regulations, competitive pressures, the performance of the
    Brazilian economy and the industry, among other factors, as well as the risks shown in our filed disclosure documents, and are
    therefore subject to change without prior notice.

    In addition, unaudited information herein reflects management's interpretation of information taken from its financial statements and
    their respective adjustments, which were prepared in accordance with market practices and for the sole purpose of a more detailed
    and specific analysis of our results. Therefore, these additional considerations and data must also be analyzed and interpreted
    independently by shareholders and market agents, who should carry out their own analysis and draw their own conclusions from the
    information reported herein. No data or interpretative analysis provided by our management should be treated as a guarantee of
    future performance or results and are merely illustrative of our directors' vision of our results.

    Our management is not responsible for compliance or accuracy of the data from this report, which must be considered as for
    informational purposes only, and should not override the analysis of our audited consolidated financial statements for purposes of a
    decision to invest in our stock, or for any other purpose.

2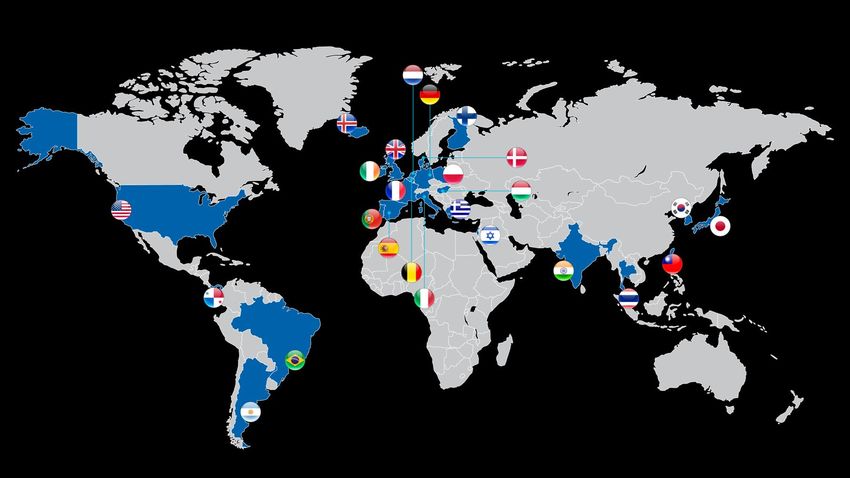
Brazilian Market Overview

    Hypera Pharma at a Glance

    Strategy and Opportunities

    Financials

3
Brazilian Market Overview
    Hypera Pharma at a Glance

    Strategy and Opportunities

    Financials

4
The largest market in Latam, with the highest real growth

            Latin American Market (USD)                                                      Real Growth 2018-2019

                                                                                                                     5.1%
                                        Mexico
                                        10.0 bn
                                                                              Argentina                          3.9%
                                         19%
                                                                               5.0 bn
                   Brazil                                                        13%
                  22.4 bn                                                                                        3.7%
                    44%                                                       Colombia
                                                                               4.7 bn                     1.9%
                                      Other
                                                                                 9%
                                      6.5 bn
                                       13%                         Chile                  -3.6%
                                                                  2.8 bn
                                                                    5%

5   Source: IQVIA World Review Conference (Jun/2019); LATAM Market LTM 1Q19
Fast-growing market, above Emerging Markets average

                                                                  Forecasted 2019-23 CAGR
          India                                                                                          11%
        Russia                                                                                     10%
         Brazil                                                                               8%
               EM                                                                        7%
             USA                                                                         7%
         China                                                                      6%
       Global                                                                  6%
               UK                                                         5%
           RoW                                                            5%

6   Source: IQVIA Market Prognosis, Sep/2018; IQVIA Institute, Dec/2018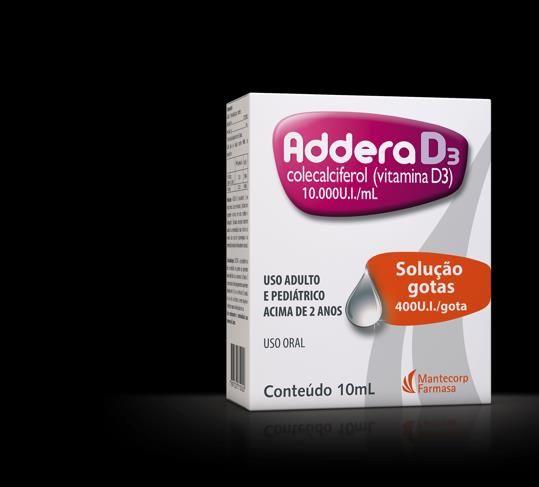
Local players have been gaining market share

                                            Value                                            Volume
                                             (R$)                                            (Units)
    Multinationals

                                                                                29%    28%    26%      25%   25%
                     38%        37%               36%           36%    35%

                                                                                71%    72%    74%      75%   75%
                     62%        63%               64%           64%    65%

                     2015     2016               2017          2018   2019     2015   2016   2017   2018     2019
                                                                      LTM                                    LTM

7    Source: IMS Health 2019 (Retail market); LTM Mai/2019
Retail market with relevant growth perspectives

                                                                     Brazilian Market (BRL)

           Retail Growth                                                                        Non-Retail Growth
          CAGR 2019-2023                                                Retail     Non Retail    CAGR 2019-2023
                                                                       64.3 bn      31.2 bn
                          8%                                             67%          33%             7%

8   Source: IQVIA World Review Conference (Jun/2019); LTM Apr/2019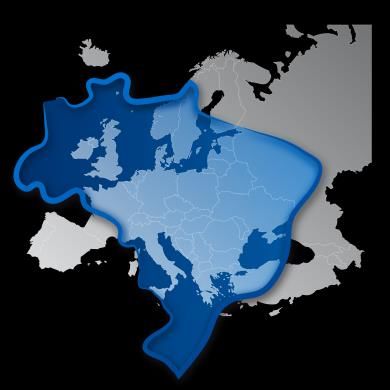
Brazilian Retail Pharma Market

                                          In BRL                                                    In #Units

                                                                                                     Generics
                                                                                                      1.5 bn
                                                               Generics                                34%
                                                                9.1 bn
                           RX1                                   14%
                         41.9 bn
                          66%                                                                    RX1             OTC2
                                                              OTC2                                              1.1 bn
                                                                                                1.7 bn
                                                             12.5 bn                                              26%
                                                                                                 39%
                                                               20%

    Note: 1RX, OTX, Dermocosmetics and Branded Generics; ²OTC and Sweeteners
9
    Source: IQVIA World Review Conference (Jun/2019); LTM Apr/2019, Market Size PPP and Units
Main Brazilian pharmaceutical companies growth
                                                              Sell Out PPP Real¹; R$ bn

     CAGR                                     -0.3%                         7.8%                         7.5%
                                                                                                                                            • Stability in the mature
                                                                              5.6                         21.6                                products sales

                                                 -0.2                                                                                       • Growth from recent
                   16.2
                                                                                                                                              products launched

                           2                              3                              4                        2
                    2014                       MATURE                     LAUNCHES                         2018

     Note: ¹Deflated; ²LTM (Sep/18); ³Mature: Products launched before the last 5 years; 4Launches: Products launched in the last 5 years
10
     Source: IMS Health - PMB Retail (Sep/18)
Fast ageing of population driving sustainable growth
Population 60+
(MM people)
90 35%
80
32%
30%
70
28%
73 25%
60
24% 66 CAGR
2.8%
20%
19% 54
50
40
14%
15%
42
11%
30
30
10%
20
8% 1mm per
21 5%
year
14
10
0 0%
2000 2010 2020 2030 2040 2050 2060
11 Source: IBGE (2010), revised in 2018Population ageing increases the “out of pocket” drug
expenditure
Prescription Drugs Expenditure
(R$ per month / family)
Age
10-19 52.2
20-29 67.4
30-39 82.2
4.4x
40-49 112.1
50-59 150.7
60-69 222.8
70+ 230.7
12 Source: IBGE (2010); Values updated by inflation (IPCA)Brazilian Market Overview
Hypera Pharma at a Glance
Strategy and Opportunities
Financials
13Our history
2007 - 2011 2012 - 2016 2017 - 2021
Industry Business Pharma
Consolidation Restructuring Focus ~4x Total
Return* in 10
Acquisitions of brands Development of the go- Focus on most attractive years since
and companies at to-market platform: pharma sector: IPO
attractive valuations:
• Largest and most productive • Focus on the retail pharma
Brazilian manufacturing site market
• Highest production volume • Higher resilience
• Lowest cost producer • Underpenetrated markets
• Most productive • Untapped demand
376%
sales force at physicians • Diversified portfolio
• Lowest cost media buying • Higher Returns (ROIC/ROE)
• Largest field
force at store level 123%
(>70% direct access)
IBOV HYPE3
* Total return considers
dividends
142018 Portfolio: Strong relevance of branded products
Branded
Products
88% Consumer
RX/OTX2
Health
36% 43%
Consumer
Health1 9%
Dermo
36%
Generics
12%
Net Revenues: R$3.7bn
Gross Margin: 71.6%
Note: 1OTC products and sweeteners; ²Branded Prescription Products and Branded Generics
15
Source: Company financials2018 Revenue breakdown per brand
RX
7.1% Consumer Health
4.7%
RX
4.3%
62.0% 4.1% Dermo
Top 10
3.6% Consumer Health Brands:
3.3% ~38% of
3.2% RX
2.7%
sales
RX
2.6%
2.4% Consumer Health
RX
Consumer Health
16 Source: Company financials2018 Revenue Breakdown by area
RX1 and Dermo
Pain & GP2 &
Fever Pediatrics
22% 23%
Other 3%
GI5 2%
CNS4 2%
Dermo
Women/Men’s Health 4% 17%
Endocrinology 4%
Resp3
4%
Cardiology 10%
9%
Orthopedics
17
Note: 1Branded Prescription and Branded Generics; ²General Practice; ³Respiratory System; 4Central Nervous System; 5Gastrointestinal
Source: Company financials2018 Revenue Breakdown by area
Consumer Health
Vitamins
Flu &
GI Cold
31% 23%
Nutritionals &
Nutraceuticals
18%
Nutritionals
Orthopedics 4%
Pain &
General
12% Fever
Practice
Other 12%
18 Source: Company financials3 Business Units with growth, profitability and innovation
targets
Hypera Pharma is internally divided into 3 Business Units according to demand generation
(POS, Doctors and Media)
Trade/POS Doctors Consumer/Media
192018 Revenue and Market Position per Business Unit
Branded Generics and
2018 Revenue Breakdown Consumer Health1 Prescription² Similars³
Consumer #1 Hypera Aché NC Farma
Branded Health #2 Sanofi Eurofarma Hypera
Ranking
Prescription 30%
40% #3 GSK Sanofi Cimed
#4 Takeda Novartis Sanofi
Generics
#5 Pfizer Hypera Eurofarma
and Similars
30%
Note: 1OTC products and sweeteners; ²Ex-patents products promoted to physicians; ³Pure and Branded Generics promoted in the POS
20
Source: Company financials; IMS Health Dec/17R$100mi+ Power Brands
11 Power Brands
(Brand history)
10 years 18 years 15 years
57 years
49 years 57 years 34 years
18 years
24 years 104 years 19 years
21How we sell: Diversified distribution
Fragmented distribution
Hypera reaches 100% of POS in Brazil
• Continental country
(27 states; ~200mm people)
Direct Transfer Indirect
• 28 larger chains Channel Channel
Order
• ~230 distributors
invoices & delivers
takes the orders
Distributor
Hypera
30% Distributor
Retailer
Warehouse
36% 34%
75,300 Stores
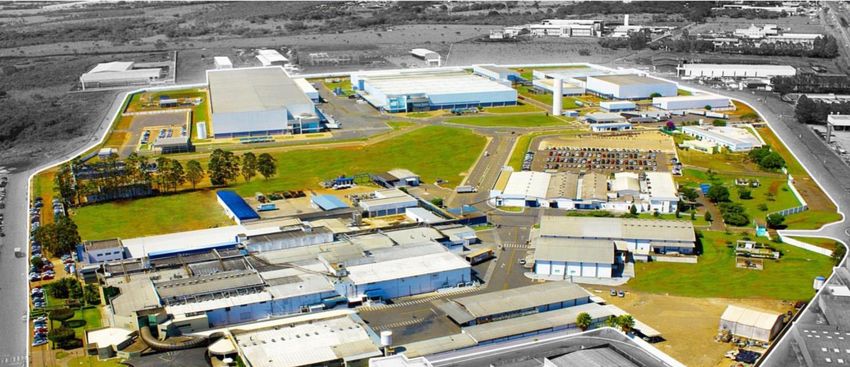
22How we manufacture: Large scale facilities in Anápolis
Solids/ Aerosol
Quality Liquids
Distribution Efervecent
Raw Control Semisolids
Center Dermo
Materials Injectables
R&D
Anápolis
Solids Penicilin
Semisolids
Liquids
R&D
~320,000 m2 land ~120,000 m2 constructed area ~3,700 employees
Production Capacity per year:
+ 17 billion units of solids
+ 40 million units of injectable medicines
+ 330 million units of liquids, creams, oils and lotions
23How we innovate: Unique innovation structure in Brazil
Consumer Insights
R&D - Anápolis R&D - Hynova Pilot plant Center
• Maintenance of existing • Launched in 2017 • Lots in semi-industrial • Evaluation of the
structure size performance of products
• Chemists, pharmacists, and packaging based on
• Focus on improving and and Ph.D professionals consumer acceptance and
adapting the portfolio preference
• Laboratories for
• Laboratories for Pharma, Dermo and
Pharma Nutraceuticals
• State-of-the-art
equipment
Capacity
4x higher
25Innovation in the pharmaceutical industry
New drugs
Biotechnology
New associations
New technologies
New pharmaceutical
forms
Similar & Generics
Specific and
phytotherapeutics
White spaces Incremental Radical
Moderate risk and Global competition
Low hanging fruits High investment and long
development process
process
26How we innovate: R&D KPIs
Largest
Innovation Hub
in Latin
300
people
150 simultaneous
America in R&D Projects
R&D
6
Investments in Capacity of
2018
more than 20
4.9% laboratories pharmaceutical forms
Submissions pear year
of Revenues
60 35
~R$70 million
in infrastructure
Medicines Dermocosmetics
29
Patents
And food
Note: Considers total R&D investments of the year (Expenses and Capitalization), excluding the “Lei do Bem” incentives
27
Source: Company financialsHow we innovate: Increasing the commitment to R&D
4.9%
+3.2pp
4.0%
2.8%
1.7%
2015 2016 2017 2018
R&D / Net Revenues
Note: Considers total R&D investments of the year (Expenses and Capitalization), excluding the “Lei do Bem” incentives
28
Source: Company financialsHow we innovate: Increasing importance of innovation
Innovation Index (% Net Revenue) Target: 35%
30%
28%
24%
23%
19%
16%
2013 2014 2015 2016 2017 2018
29 Source: Company Financials (% of Net Revenues from products launched over the past 5 years)Senior Management Organizational Chart
CEO
VP
Sales & Mkt
Consumer Branded Generics &
R&D Operations CFO
Health Prescription Similars
Strategy &
HR CCO & Legal Fiscal
Planning
30Brazilian Market Overview
Hypera Pharma at a Glance
Strategy and Opportunities
Financials
31Strategic Plan
Key objectives:
• Grow 2-3p.p. above the market in the medium term, boosted by
innovation and excellence in execution
• Maintain profitability
• Finance organic growth with operating cash flow
• Maintain cash distribution to shareholders
• Maintain net debt close to zero
32Performance drivers
• Commercial Execution
productivity increase
• Better return of
marketing
investments
• Better operating • Launches execution
efficiency
• Pipeline increase
• Working capital
• Strengthening
efficiency
partnerships
Innovation
2018 2019 2020 2021+
Growth acceleration from 2020 on
33Pipeline Evolution
# of Projects
130
70
338
278
#Pipeline dec-2017 #Products launched New projects #Pipeline dec-2018
34Pipeline breakdown per Business Unit
% of Gross Revenue in year 5
Branded
Prescription
60%
338
projects
Similars & Consumer
Generics Health
21% 19%
35Pipeline by type of innovation
% of Gross Revenue in year 5
White
New Combination
Spaces
26%
38%
New
Patented
Technologies
9%
28%
53% related to incremental innovation and 47% portfolio expansion
36 Note: Weighted 5-Year Gross Revenue - Launch: 90%, Anvisa: 80% (R&D) and 85% (BD), Development: 65%, Contract: 75%, Waiting Queue and Negotiation 50%Pipeline – Branded Prescription
% of Gross Revenue in 5th year
Pipeline by Therapeutic area
Pain/Analgesics
16% Cardio/Endocrino
13%
60%
Allergy/Resp/
Otorrino
15%
CNS
16% of the pipeline
for treatment
of chronic diseases
Dermo
9% GI
9%
GP
21%
37Products launched in 2018
# of products
70
Brand Extensions
White Spaces
New Categories
High Complexity
Low Complexity
Lançamentos 2018
38Strategic Partnerships and Collaboration
20+
countries
50+
New partners
130+
New Products
39Growth Strategy: Launching extensions of leading brands
Sell-out (R$ million)
CAGR
9.9% 140
CAGR 128
CAGR 11.5% 235 232
111 21 40
23.0% 80
77
69 44 42 96 97
27 19 12
17 17
54 183
40 45 172
32
18 8 23
35 150 191
80 84 88 88
190 79
150 164 159
35 36 37 37 35
2014 2015 2016 2017 2018 2014 2015 2016 2017 2018 2014 2015 2016 2017 2018
Doril Doril Enxaqueca Benegrip Benegrip Multi Liquid Pills Gel Caps
40 Source: IMS Health – PMB Dec/18Growth Strategy: Improving POS distribution/execution
Example: OTC Category Management
41 Source: Dunhhumby Anti-flu + Decongestant - YTD Sep/16 vs. Sep/17Growth Strategy: Launching of innovative treatments,
such as Addera D3
Developing new treatments Sell-out (MM R$)
New pharmaceutical forms/packaging:
– Family 10,000 UI CAGR
– Economic presentations 7,000UI 41.0% 283 284
10 Pills – 10 weeks treatment
30 Pills – 30 weeks treatment
224 80 74
• Strong efforts with Physician and Pharmacies 26
• Exclusive gel caps 151
169 174 179
72 122
36
36 29 29 30 30
2014 2015 2016 2017 2018
Drops Pills Gel Caps Gummies
42 Source: IQVIABrazilian Market Overview
Hypera Pharma at a Glance
Strategy and Opportunities
Financials
43Financial Highlights
Net Revenues EBITDA Net Income
R$ bn R$ mm R$ mm
CAGR CAGR CAGR
7.7% 9.6% 35.4% 1,112 1,135
1,233 1,319
3.7
3.5 1,092
3.2
3.0 912 950
2.8
647
338 346
2014 2015 2016 2017 2018 2014 2015 2016 2017 2018 2014 2015 2016 2017 2018
44 Source: Company Financials2018 Results (R$ million)
|R$3,724.3
NET REVENUES
+6.4%1
|R$2,665.3 |71.6%
GROSS PROFIT GROSS MARGIN
+3.6%1 -190bps1
|R$1,318.7 |35.4%
EBITDA2 EBITDA MARGIN2
+7.0%1 +20bps1
|R$1,135.4 |30.5%
NET INCOME2 NET INCOME2
+2.2%1 -130bps1
|R$1.80
EPS2,3
+1.9%1
Note: ¹2018 vs. 2017; ²Continuing Operations; ³in R$ per share
45
Source: Company FinancialsCash Flow and Debt
+14.4%
vs 2017
+17.6%
vs 2017
(128) (91)
1,067 (88)
848 (633)
(582) 0,8x
EBITDA
1,522 1,647
1,065
Gross Cash Operating Cash CAPEX Intangibles Free Cash Flow Financing Cash Dividends Gross Cash Gross Debt Net Cash 2018
2017 Flow 2018 Flow 2018
Note: Financing Cash Flow net of interest from financial investments
46
Source: Company FinancialsDividends/IOC
R$ per share
CAGR
25% R$0.97
R$0.92
R$0.65
R$0.50
2016 2017 2018 2019
Dividend Yield: 1.9% 2.4% 2.6% 3.4%
47 Note: It considers the dividends paid in the respective periods; Dividend Yield calculated based on the price of June 18, 2019ROE & ROIC
ROE – Return on Equity ROIC – Return on Invested Capital
18.9%
14.0% 15.4%
7.2%
2016 2018 2016 2018
Note: ROE calculation is a result of the division of Continuing Operations Consolidated Net Income by the Consolidated Shareholders' Equity quarterly average of the year. ROIC calculation is
48
a result of the division of Continuing Operations Consolidated NOPAT (Cash Taxes) by the quarterly invested capital average of the year, excluding assets and liabilities for sale.Ownership and listings
Ownership structure Listings
• Sao Paulo Stock Exchange: - HYPE3
- BRHYPEACNOR0
Controlling
• Indexes with Hypera:
Group
Founder 35%
20%
Free Float
Maiorem
65%
15%
• Trade volume¹: 2.0 MM shares/day
• ADR (HYPMY)²: 8.7 MM shares outstanding
• IBOVESPA Index Ranking³: 36/65
• Market Cap³: R$18.2bn (USD4.7bn)
Note: ¹2018 ²May/2019 ³June/2019
49
Source: B3; Company dataYou can also read


