Interim Hazardous Locations in South Africa - July 2017 - South African ...
←
→
Page content transcription
If your browser does not render page correctly, please read the page content below
Interim

Hazardous Locations

  in South Africa
      July 2017
CONTENTS

1.     PURPOSE .......................................................................................................... 2

2.     TARGET AUDIENCE .......................................................................................... 2

3.     ALIGNMENT WITH EXISTING INITIATIVES AND STRATEGIES ...................... 2

     3.1. The National Road Safety Strategy 2016-2030 (NRSS) ............................... 2

     3.2. The United Nations Decade of Action for Road Safety 2011-2020 ............... 3

4.     BACKGROUND .................................................................................................. 5

     4.1    RTMC as Custodian of Road Safety in the Country ...................................... 5

       4.1.1      Legislative mandate ................................................................................ 5

     4.2    Road Safety Situation in South Africa ........................................................... 8

5.     HAZARDOUS LOLATIONS METHODOLOGY ................................................... 9

     4.3    Introduction ................................................................................................... 9

     4.4    HazLocs Methodology ................................................................................. 10

     4.5    Discussion ................................................................................................... 11

       4.5.1      Maps ..................................................................................................... 14

6.     Conclusions ...................................................................................................... 17

7.     REFERENCES.................................................................................................. 17

National Road Safety Research & Development Framework July 2017                                                              1
1. PURPOSE
The Goal of defining Hazardous Locations in South (HazLocs) is to provide an
evidence-based approach of identifying areas where road safety efforts such as traffic
law enforcement, road safety engineering and road safety education should be
focussed to reduce road related trauma due to road crashes on South African Roads.
2. TARGET AUDIENCE
The HazLocs is relevant to all government agencies, national, provincial and local road
authorities and any individual or organisation aspiring to execute road safety related
activities to reduce road related trauma on South African roads.
The HazLocs will be reviewed and updated on an annual basis as and when new road
crash statistics are published by the RTMC.
3. ALIGNMENT WITH EXISTING INITIATIVES AND STRATEGIES
The HazLocs complements and supports existing international and national road
safety initiatives and strategies. These include inter alia:
3.1. The National Road Safety Strategy 2016-2030 (NRSS)
The vision of the NRSS is to ensure “Safe and secure roads”. This will be
achieved by delivering on the strategic mission to attain a reduction in the
number of fatal crashes, promoting responsible road user behaviour and
providing safe road infrastructure on South African roads and delivering quality
road safety management with results focussed approach
The NRSS guides the national strategy towards concentrating road safety
efforts across various functional areas pertaining to hazardous locations inter
alia:
To improve spatial development planning and ensure regular
assessment of roads in hazardous/high risk locations to address road
safety”
National Road Safety Research & Development Framework July 2017 2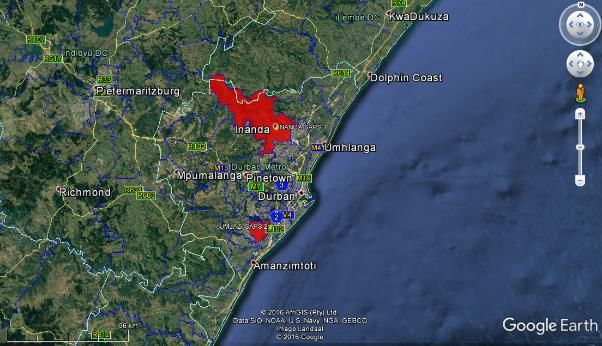
To continuously identify hazardous/high risk road locations and remedy
with focused interventions”
To identify top Vulnerable Road Users (VRU) hazardous/high risk
locations on a continuous basis and address them.
To improve enforcement effectiveness and start regular national traffic
patrols along hazardous/high risk locations.
To develop a list of its highest priority hazardous locations specifically
for VRU’s, for systematic attention
To implement traffic management plans for education institutions and
suggested that the most hazardous locations be identified first and that
the action start there immediately
3.2. The United Nations Decade of Action for Road Safety 2011-2020
The UN Road Safety Collaboration developed a Global Plan for the Decade of
Action for Road Safety 2011-2020 with input from many partners through an
extensive consultation process through meetings and the Internet. The Plan
provides an overall framework for activities which may take place in the context
of the Decade. The categories or "pillars" of activities are: building road safety
management capacity; improving the safety of road infrastructure and broader
transport networks; further developing the safety of vehicles; enhancing the
behaviour of road users; and improving post-crash response. Indicators have
been developed to measure progress in each of these areas. Governments,
international agencies, civil society organizations, the private sector and other
stakeholders are invited to make use of the Plan as a guiding document for the
events and activities they will support as part of the Decade.
In May 2010, the UN General Assembly proclaimed the period 2011–2020 as
the Decade of Action for Road Safety, with a goal to stabilise and then reduce
the forecast level of road traffic fatalities around the world by increasing
activities conducted at the national, regional and global levels. The United
Nations Decade of Action for Road Safety 2011-2020 underpins the National
Road Safety Strategy 2016-2030 (NRSS).
National Road Safety Research & Development Framework July 2017 3
South Africa is an active member of the United Nations and the advent of the
Decade of Action (DoA) initiative necessitated the realignment of the National
Road Safety Strategy so as to allow synchronization of activities, resource
optimization and to eliminate the possibility of running parallel programmes.
The identification of HazLocs is in line with the ‘Safe System’ approach to
achieve a vision of zero road fatalities and serious injuries and requires that the
road system be designed to expect and accommodate human error. Safe
System principles require a holistic view of the road system and the interactions
between roads and roadsides, travel speeds, vehicles and road users.
This is an inclusive approach that caters for all groups using the road system,
including drivers, motorcyclists, passengers, pedestrians, bicycle users,
commercial and heavy vehicle drivers. Consistent with the NRSS long-term
road safety vision, it recognises that people will always make mistakes and may
get involved in road crashes, the system however, should be forgiving and in
the occurrence of a crash, should not result in death or serious injury.
The Safe System approach is consistent with the approaches adopted by the
safest countries in the world, many of whom also adopted principles of the
UNDA plan. There are several guiding assumptions and principles to this
approach:
People make mistakes: Humans will continue to make mistakes, and the
road transport system must accommodate these. The road transport
system should not result in death or serious injury as a consequence of
road error.
Human physical frailty: There are known physical limits to the amount of
force our bodies can take before we are injured.
A ‘forgiving’ road system: A Safe System ensures that the forces in
collisions do not exceed the limits of human tolerance. Speeds must be
managed so that humans are not exposed to impact forces beyond their
physical tolerance. System designers and operators need to take into
account the limits of the human body in designing and maintaining roads,
vehicles and speeds.
National Road Safety Research & Development Framework July 2017 4The UNDA five pillars, together with the Safe Systems Approach, formed the
basis for the situational and problem analysis which was an important precursor
to the development of the NRSS.
4. BACKGROUND
4.1 RTMC as Custodian of Road Safety in the Country
4.1.1 Legislative mandate
4.1.1.1 Constitution of The Republic of South Africa, 1996
The Constitution is the supreme law of the Republic of South Africa The
RTMC abides by the obligations imposed by the Constitution. The table
below reflects the RTMC’s constitutional mandate in relation to other
spheres of government in the execution of its responsibilities.
Section Implication
Sets out the areas of provincial legislative
competence. Schedule 4 Part A lists the functional
areas of concurrent national and provincial
Schedule 4 competence as follows:
• Public Transport
• Road Traffic Regulation
• Vehicle Licensing
Provides for traffic as a schedule 5 functional
area, however the Constitution also provides for
the national legislative authority over schedule 5
Schedule 5 matters under section 44 (2) and the provision of
section 76 (1) legislation, all the legislative
mandates of the RTMC are enacted in terms of
section 76 (5) of the Constitution.
National Road Safety Research & Development Framework July 2017 54.1.1.2 National Road Traffic Act 93 of 1996 (NRTA)
The NRTA provides for road traffic matters that apply uniformly
throughout the republic and for matters connected therewith. It
prescribes national principles, requirements, guidelines, frameworks and
national norms and standards that must be applied uniformly in the
provinces and other matters contemplated in section 146 (2) of the
Constitution; and to consolidate land transport functions and locate them
in the appropriate sphere of government.
The NRTA provides for specific powers in order to execute the functions
of the RTMC. Chapter VII of the NRTA addresses the management of
Road Safety. Powers of the Chief Executive Officer as per section 52 of
the Act are as follows:
The Chief Executive Officer may -
a) Prepare a comprehensive research programme to effect road
safety in the Republic, carry it out systematically and assign
research projects to persons who, in his or her opinion, are best
equipped to carry them out;
b) Give guidance regarding road safety in the Republic by means of
the organising of national congresses, symposiums, summer
schools and study weeks, by means of mass communication media
and in any other manner deemed fit by the Chief Executive Officer.
In order to perform his or her functions properly the Chief Executive
Officer may
a) Finance research in connection with road safety in the Republic;
b) Publish a periodical to promote road safety in the Republic, and pay
fees for matters inserted therein;
c) Give guidance to associations or bodies working towards the
promotion of road safety in the Republic;
d) Organise national congresses, symposiums, summer schools and
study weeks and, if necessary, pay the costs thereof, and
remunerate persons performing thereat;
National Road Safety Research & Development Framework July 2017 6e) With a view to promoting road safety in the national sphere, publish
advertisements in the mass communication media.
The Chief Executive Officer shall exercise his or her powers and perform
his or her functions subject to the control and direction of the Board of
the RTMC, subject to the delegation to the Board by the Shareholders
Committee.
4.1.1.4 Road Traffic Management Corporation Act No 20 Of 1999 (RTMCA)
Parliament approved the RTMCA in 1999 in line with the provisions of
section 44(2) of the Constitution. In terms of the Act, the RTMC was
established to pool powers and resources and to eliminate the
fragmentation of responsibilities for all aspects of road traffic
management across the various levels of government. The Act provides,
in the public interest, for cooperative and coordinated strategic planning,
regulation, facilitation and law enforcement in respect of road traffic
matters by the national, provincial and local spheres of government.
The Act’s Objectives are:
To establish the RTMC as a partnership between national,
provincial and local spheres of government;
To enhance the overall quality of road traffic service provision, in
particular, to ensure safety, security, order, discipline and mobility
on the roads;
To protect road infrastructure and the environment through the
adoption of innovative practices and implementation of innovative
technology;
To phase out, where appropriate, public funding and phase in
private sector investment in road traffic on a competitive basis;
To introduce commercial management principles to inform and
guide road traffic governance and decision-making in the interest
of enhanced service provision;
National Road Safety Research & Development Framework July 2017 7 To optimise the utilisation of public funds by—
o Limiting investment of public funds to road traffic services
which meet a social or non-commercial strategic objective and
which have poor potential to generate a reasonable rate of
return; and
o Securing, where appropriate, full cost recovery on the basis
of the user-pays principle;
To regulate, strengthen and monitor intergovernmental contact and
co-operation in road traffic matters;
To improve the exchange and dissemination of information on road
traffic matters;
To stimulate research in road traffic matters and effectively utilise
the resources of existing institutes and research bodies; and
To develop human resources in the public and private sectors that
are involved in road traffic.
4.2 Road Safety Situation in South Africa
The Global status report on road safety 2015, reflecting information from 180
countries, indicates that worldwide the total number of road traffic deaths has
plateaued at 1.25 million per year, with the highest road traffic fatality rates in
low-income countries (WHO 2015).
South Africa is one of the countries globally with the worst fatality rates recorded
and analysed by the World Health Organisation (WHO) of 180 countries, with
a recorded 11,676 fatal crashes in 2016 with 14,071 fatalities.
Even though the target set under the United Nations Decade of Action initiative
was to halve road related fatalities from 2010 to 2020, road related fatalities in
South Africa has steadily increased over recent years as illustrated in the
following graph:
National Road Safety Research & Development Framework July 2017 8Through a sound National Road Safety Strategy informed by this National Road
Safety Research Framework based on a ‘Result Focus’ approach, concentrating
road safety efforts at HazLocs it is envisaged that road related fatalities and serious
injuries will be decreased dramatically.
5. HAZARDOUS LOLATIONS METHODOLOGY
4.3 Introduction
The RTMC is mandated to manage and report on road crashes in South Africa.
Part of this reporting includes the identification of hazardous roads or road
sections in South Africa for Law Enforcement, Education and Engineering
efforts to be focussed on the most hazardous locations to reduce crashes,
fatalities and injuries due to road related crashes in South Africa.
The RTMC mandate stipulates the coordination of the following key road safety
functions in South Africa:
Traffic Law Enforcement
Road Safety Education
Road Safety Engineering
The conventional method in identifying hazardous locations, entails Personal
Injury Crashes (PIA) per Million Vehicle Kilometres for a specific road section
National Road Safety Research & Development Framework July 2017 9and ranking the calculated ratios to provide a list of high priority road sections
of HazLocs. The PIA formula takes into account various specific variables for
each identified road section and is calculated as follows:
PIA =
With not all variables available for all roads and/or more specifically road
sections on the approximately 154,000 km of surfaced roads in south Africa, a
more effective approach will be to direct the three key road safety functions of
the RTMC, not to specific road locations but, rather to areas in which the
hazardous roads are located to address all road safety needs within such a
defined area.
4.4 HazLocs Methodology
The RTMC developed an Interim Methodology to define hazardous locations in
South Africa. The Methodology was ‘Peer-Reviewed’ with recognized Road
Safety Academics viz.:
Prof. Marion Sinclair (University of Stellenbosch);
Mr. K Labuschagne (ex CSIR/Gauteng Provincial Government)
The methodology of identifying HazLocs is simple but effective in that it
identifies that the most reliable aspect of fatal crash reporting i.e. in which SAPS
Jurisdictional area the crash occurred.
There are 1,143 SAPS Stations or SAPS Jurisdictional Areas in South Africa
where fatal crashes are reported to which provides for the identification of the
SAPS jurisdictions where the most fatal crashes occurred for any given time
period.
National Road Safety Research & Development Framework July 2017 10The base data analysed to determine the HazLocs 2017 methodology is based
on published RTMC statistics for the 2015 and 2016 calendar years whereas
the HazLocs modal provides the user to rank SAPS jurisdictions according to:
Combined Weighted Ratio (2015 & 2016)
Weighted Ratio (2015 or 2016)
Most Fatal Crashes (2015 or 2017)
Most Fatalities (2015 or 2016)
Most Pedestrian Fatalities (2015 or 2016)
The modal also allows the user to rank any of the above parameters on a
provincial level.
In line with the UNDA and NRSS towards prioritising VRUs, the modal allows
the user to, for when the weighted ratio parameters are selected, to add weights
to different parameters to:
Add weight to pedestrian fatalities during the ranking process;
Provide a normal distribution of data in that outliers are not taken into
account during the ranking process.
The user may add different percentage weight for the following parameters:
Fatal Crashes Fatalities Pedestrian Fatalities
15% 15% 70%
During the process of establishing the HazLocs prioritisation modal, various
weight percentages were used during the iteration process and it was found
that the ‘15%/15%/70%’ ratio respectively for ‘Fatal
Crashes/Fatalities/Pedestrian Fatalities’ provided a well-balanced output. The
user may, if so desired, use different percentage ratio’s during the prioritisation
process.
4.5 Discussion
The following is a screenshot of the main output of the HazLocs Modal whereas
the top 10 hazardous locations are ranked on the combined weighted ratio
National Road Safety Research & Development Framework July 2017 11(2015&2016) with a ‘15%/15%/70%’ ratio respectively for ‘Fatal
Crashes/Fatalities/Pedestrian Fatalities’ taking into account all provinces:
Interim Hazardous Locations Ranking (2015 & 2016) All Provinces Top 10
All EC FS GP KZN LIM MP NC NW WC Province|Select|Dates 1 Jan To 31 Dec
0,9% ← % of All SAPS Jurisdictions Top 10 % of Total → 4,6% 4,3% 4,3% 4,3% 5,5% 5,6% ←Ave: 4,8%
1 143 ← All SAPS Jurisdictions Total Year → 10 613 11 676 12 944 14 071 4 870 5 410 37,6% 38,4%
10 ← Sub-Total SAPS Jurisdictions Sub-Total Selected → 486 505 553 603 270 304 48,8% 50,4%
Combined Number of
Province
SAPS Station Weighted % Pedestrian
Ranked Weighted Pedestrian
Jurisdictional Area Ratio Fatal Crashes Fatalities Fatalities
Ratio Fatalities
SA Prov -All Provinces- Weight Rank 2015 2016 2015 2016 2015 2016 2015 2016 2015 2016
Select |●| to Rank according to Parameter 1 1
1 UMLAZI KZN 87,7 1 40,8 46,9 45 52 45 60 39 43 86,7% 71,7%
2 DURBAN CENTRAL KZN 82,7 2 29,2 53,5 32 61 32 62 28 50 87,5% 80,6%
3 INANDA KZN 73,9 3 42,8 31,1 47 36 47 36 41 29 87,2% 80,6%
4 SYDENHAM KZN 73,7 4 35,7 38,0 42 43 42 47 33 35 78,6% 74,5%
5 THOHOYANDOU LIM 73,5 5 29,6 44,0 45 59 54 66 21 36 38,9% 54,5%
6 KWAMHLANGA MP 68,4 6 32,1 36,3 51 53 65 72 21 25 32,3% 34,7%
7 RUSTENBURG NW 67,5 7 34,2 33,4 64 57 75 72 19 20 25,3% 27,8%
8 MIDDELBURG MPUMALANG MP 67,1 8 27,4 39,7 53 63 69 85 13 25 18,8% 29,4%
9 LIBODE EC 64,9 9 35,7 29,3 44 38 49 45 31 24 63,3% 53,3%
10 WITBANK MP 64,6 10 37,5 27,1 63 43 75 58 24 17 32,0% 29,3%
Screenshot 1: Top 10 Hazardous Locations (SAPS Jurisdictions) in SA ranked
by Combined Weighted Ratio for 2015 & 2016
From the screenshot the above, the Umlazi SAPS Jurisdiction is ranked no.1,
Durban Central ranked no. 2 and Inanda ranked no. 3 in South Africa. The
respective number of fatal crashes, number of fatalities, number of pedestrian
fatalities and % pedestrian fatalities are also shown for each of the ranked
SAPS jurisdictional areas for 2015 and 2016.
In addition, the Modal also provides for analysis of the selected parameters of
the totals. From Screenshot 1 above, the Top 10 SAPS Stations constitutes
0,9% of all 1,143 SAPS Stations but an average of 4,8% of main parameters
(No. of Crashes, No. of Fatalities and No. of Pedestrian Fatalities). This is useful
in that if the Top 10 SAPS Stations (or 0,9% of all SAPS Stations) were targeted
with focused road safety activities, 4,8% of the main parameters will be
addressed.
The Top 50 ranked stations can also be selected in the Modal depicted in
Screenshot 2 below:
National Road Safety Research & Development Framework July 2017 12Interim Hazardous Locations Ranking (2015 & 2016) All Provinces Top 50
All EC FS GP KZN LIM MP NC NW WC Province|Select|Dates 1 Jan To 31 Dec
4,4% ← % of All SAPS Jurisdictions Top 50 % of Total → 17,4% 15,9% 16,8% 15,2% 20,4% 20,2% ←Ave: 17,6%
1 143 ← All SAPS Jurisdictions Total Year → 10 613 11 676 12 944 14 071 4 870 5 410 37,6% 38,4%
50 ← Sub-Total SAPS Jurisdictions Sub-Total Selected → 1 843 1 852 2 181 2 145 992 1 092 45,5% 50,9%
Combined Number of
Province
SAPS Station Weighted % Pedestrian
Ranked Weighted Pedestrian
Jurisdictional Area Ratio Fatal Crashes Fatalities Fatalities
Ratio Fatalities
-All Provinces-
SA Prov Weight Rank 2015 2016 2015 2016 2015 2016 2015 2016 2015 2016
Select |●| to Rank according to Parameter 1 1
1 UMLAZI KZN 87,7 1 40,8 46,9 45 52 45 60 39 43 86,7% 71,7%
2 DURBAN CENTRAL KZN 82,7 2 29,2 53,5 32 61 32 62 28 50 87,5% 80,6%
3 INANDA KZN 73,9 3 42,8 31,1 47 36 47 36 41 29 87,2% 80,6%
4 SYDENHAM KZN 73,7 4 35,7 38,0 42 43 42 47 33 35 78,6% 74,5%
5 THOHOYANDOU LIM 73,5 5 29,6 44,0 45 59 54 66 21 36 38,9% 54,5%
6 KWAMHLANGA MP 68,4 6 32,1 36,3 51 53 65 72 21 25 32,3% 34,7%
7 RUSTENBURG NW 67,5 7 34,2 33,4 64 57 75 72 19 20 25,3% 27,8%
8 MIDDELBURG MPUMALANG MP 67,1 8 27,4 39,7 53 63 69 85 13 25 18,8% 29,4%
9 LIBODE EC 64,9 9 35,7 29,3 44 38 49 45 31 24 63,3% 53,3%
10 WITBANK MP 64,6 10 37,5 27,1 63 43 75 58 24 17 32,0% 29,3%
11 MANKWENG LIM 64,5 11 29,8 34,7 46 40 50 42 22 32 44,0% 76,2%
12 MTHATHA EC 62,0 12 34,4 27,7 41 37 62 40 27 23 43,5% 57,5%
13 PORT SHEPSTONE KZN 61,2 13 39,0 22,2 48 28 58 31 33 19 56,9% 61,3%
14 NYANGA WC 58,6 14 22,3 36,3 23 44 23 44 22 33 95,7% 75,0%
15 GREENWOOD PARK KZN 58,2 15 29,8 28,4 39 31 43 32 25 27 58,1% 84,4%
16 NELSPRUIT MP 57,1 16 26,7 30,4 42 48 52 66 18 19 34,6% 28,8%
17 BRITS NW 56,7 17 22,6 34,1 40 55 50 65 13 23 26,0% 35,4%
18 ELDORADO PARK GP 56,3 18 37,7 18,7 52 22 59 23 30 17 50,8% 73,9%
19 VERULAM KZN 55,3 19 27,3 28,0 35 39 35 40 24 23 68,6% 57,5%
20 AKASIA GP 53,8 20 26,7 27,1 41 38 48 40 19 22 39,6% 55,0%
21 UMKOMAAS KZN 51,2 21 31,9 19,3 36 24 41 30 29 16 70,7% 53,3%
22 PLESSISLAER KZN 50,5 22 19,8 30,8 28 38 29 41 16 27 55,2% 65,9%
23 MONDEOR GP 50,3 23 29,6 20,8 42 35 43 38 24 14 55,8% 36,8%
24 TONGA MP 49,8 24 22,3 27,5 34 35 40 41 16 23 40,0% 56,1%
25 POTCHEFSTROOM NW 48,6 25 22,1 26,6 43 35 48 44 12 21 25,0% 47,7%
26 CHATSWORTH KZN 48,4 26 22,4 26,0 28 32 28 34 20 23 71,4% 67,6%
27 HONEYDEW GP 48,2 27 24,0 24,2 35 33 36 35 19 20 52,8% 57,1%
28 VEREENIGING GP 47,5 28 29,9 17,6 49 30 57 36 20 11 35,1% 30,6%
29 CALCUTTA MP 46,9 29 20,4 26,5 28 37 33 37 16 22 48,5% 59,5%
30 PHOKENG NW 46,5 30 20,9 25,7 40 40 57 47 9 18 15,8% 38,3%
31 KWADUKUZA KZN 45,7 31 15,5 30,3 30 40 45 45 6 25 13,3% 55,6%
32 NABOOMSPRUIT LIM 45,4 32 21,1 24,3 33 44 75 85 7 7 9,3% 8,2%
33 VOSMAN MP 45,1 33 25,2 19,9 35 28 44 30 19 16 43,2% 53,3%
34 BENONI GP 44,8 34 19,8 25,1 35 39 36 44 13 18 36,1% 40,9%
35 ERMELO MP 44,7 35 21,7 23,1 39 36 54 43 11 16 20,4% 37,2%
36 TEMBISA GP 44,6 36 33,9 10,8 32 12 35 13 34 10 97,1% 76,9%
37 TEMBA GP 44,0 37 22,1 22,0 30 31 33 36 18 17 54,5% 47,2%
38 KHAYELITSHA WC 44,0 38 22,5 21,5 26 25 26 25 21 20 80,8% 80,0%
39 DOBSONVILLE GP 44,0 39 19,3 24,7 24 29 25 33 17 22 68,0% 66,7%
40 KRAAIFONTEIN WC 43,2 40 17,4 25,8 23 35 23 39 15 21 65,2% 53,8%
41 EMPANGENI KZN 43,2 41 17,5 25,7 31 42 34 50 11 17 32,4% 34,0%
42 DUTYWA EC 42,8 42 22,3 20,6 33 31 50 36 14 15 28,0% 41,7%
43 MOROKA GP 42,8 43 13,6 29,2 18 31 21 33 11 28 52,4% 84,8%
44 IVORY PARK GP 42,5 44 24,9 17,6 31 19 32 19 22 17 68,8% 89,5%
45 MOUNT FRERE EC 42,3 45 24,4 17,9 29 23 31 26 22 15 71,0% 57,7%
46 MECKLENBURG LIM 42,3 46 17,5 24,8 24 32 27 40 14 20 51,9% 50,0%
47 SPRINGS GP 42,0 47 27,8 14,2 45 24 61 24 17 10 27,9% 41,7%
48 PHOENIX KZN 41,8 48 13,6 28,2 19 37 20 39 11 24 55,0% 61,5%
49 SCOTTBURGH KZN 41,2 49 13,6 27,6 19 34 20 38 11 24 55,0% 63,2%
50 LEBOWAKGOMO LIM 41,0 50 21,1 19,9 31 34 44 38 14 13 31,8% 34,2%
Screenshot 1: Top 50 Hazardous Locations (SAPS Jurisdictions) in SA ranked
by Combined Weighted Ratio for 2015 & 2016
National Road Safety Research & Development Framework July 2017 13The Modal also indicates the number of and percentage of SAPS stations per
province that occurs in the top 50 for the selected parameters as shown in the
following screenshot:
Define Weights Fatal Crashes Fatalities Pedestrian Fatalities
for
15% 15% 70%
'Weighted
Ratio' Analysis Σ of Weights = 100% C
NUMBER OF AND % OF SAPS STATIONS PER PROVINCE IN TOP 50
for
Combined Weighted Ratio 2015 & 2016 All Provinces
Top 10 Top 20 Top 30 Top 40 Top 50
Prov
# % # % # % # % # %
EC 1 10,0% 2 10,0% 2 6,7% 2 5,0% 4 8,0%
FS - - - - - - - - - -
GP - - 2 10,0% 5 16,7% 9 22,5% 12 24,0%
KZN 4 40,0% 7 35,0% 10 33,3% 11 27,5% 14 28,0%
LIM 1 10,0% 2 10,0% 2 6,7% 3 7,5% 5 10,0%
MP 3 30,0% 4 20,0% 6 20,0% 8 20,0% 8 16,0%
NC - - - - - - - - - -
NW 1 10,0% 2 10,0% 4 13,3% 4 10,0% 4 8,0%
WC - - 1 5,0% 1 3,3% 3 7,5% 3 6,0%
Tot 10 100% 20 100% 30 100% 40 100% 50 100%
Screenshot 2: Number of and Percentage of SAPS Stations per Province that
Occurs in The Top 50
From Screenshot 2 above it is clear that the province with the most SAPS
Jurisdictions in the Top 50 is KZN with 40% in the top 10; 35% in the top 20;
33% in the top 30; 27,5% in the top 40 and 28% in the top 50.
Thus, based on combined weighted ratio weighted ratio ranking, KZN is the
province with the most hazardous locations in the country where road safety
activities need to be directed.
The same exercise can be done by selecting any of the provinces whereas the
same analysis will be conducted for all parameters in that specific province.
4.5.1 Maps
The following maps provides a visual illustration of SAPS Jurisdictional Areas
as well as two of the top ranked weighted ratio areas or most hazardous areas
in South Africa in 2015 & 2016:
National Road Safety Research & Development Framework July 2017 14Map of all SAPS Jurisdictions / Areas in South Africa
Inanda and Umlazi SAPS Jurisdictional Areas
National Road Safety Research & Development Framework July 2017 15Umlazi SAPS Jurisdictional Area – Ranked No.1 most hazardous Area
Inanda SAPS Jurisdictional Area – Ranked No.3 most hazardous Area
National Road Safety Research & Development Framework July 2017 166. CONCLUSIONS The RTMC developed an Interim Methodology to define hazardous locations in South Africa. A Modal was developed from the methodology to rank the most hazardous SAPS Jurisdictional Areas where the most fatal crashes, fatalities and pedestrian fatalities occur. The methodology defines ranking calculations per combined weighted ratio or weighted ratio from 2015 and 2016 crash data to ultimately rank the top 10 or top 50 most hazardous locations in the country. The aim of the HazLocs Modal is to provide a list of most hazardous areas to direct the efforts of the functional units of the RTMC and to coordinate efforts of the authorities in which the areas fall to put in place measures to reduce the carnage on our roads in the short, medium and long term should enable the RTMC to be more effective in its efforts. Through concentrating on areas rather than roads it is believed that a higher impact can be made, especially through road safety education within the community/ communities within a hazardous area. More direct efforts such as traffic law enforcement and road safety engineering can then also be focussed on not just localized hazardous roads but, applying road safety intervention in the total area towards reducing road trauma. 7. REFERENCES RTMC Calendar Reports 2015 & 2016 National Road Safety Strategy 2016-2030 (NRSS) World Health Organisation (WHO); Global Status Report on Road Safety 2015 National Road Safety Research & Development Framework July 2017 17
You can also read