INTERIM - INFRATIL INTERIM REPORT - REGINFO
←
→
Page content transcription
If your browser does not render page correctly, please read the page content below

2012
Infratil
INTERIM Report

1
                                                      INTERIM

WorldReginfo - 5d4a1824-58b0-4423-b0df-8f1593a9e03e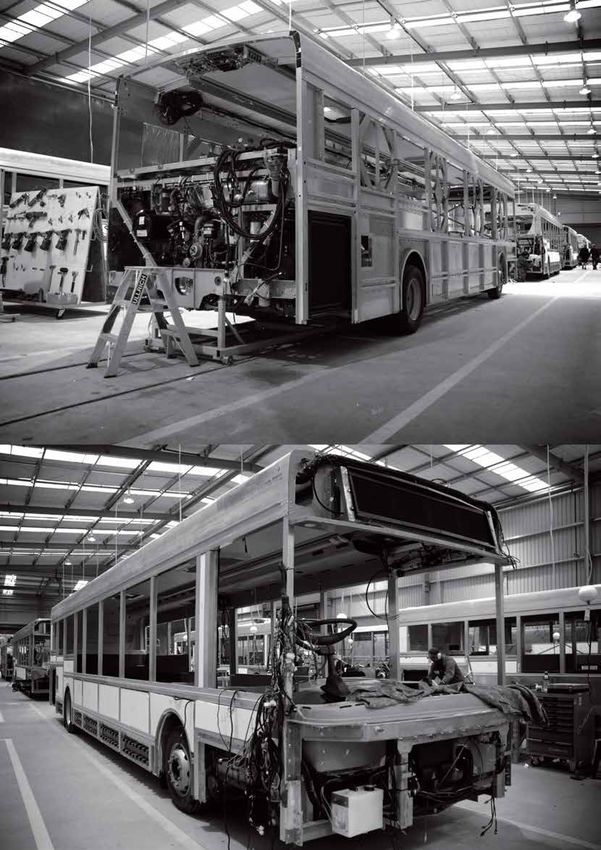
WorldReginfo - 5d4a1824-58b0-4423-b0df-8f1593a9e03e

GOLLUM in the lord of the
rings, was 60 years older than
his youNger self in the hobbit.

2
WELLINGTON AIRPORT
2004

Infratil
INTERIM Report
2012

WELCOME to the new way of accessing
infratil’s reports

                 The 2012 Infratil Interim Report is now available on
                 smartphone and tablet devices. To download please visit
                 the iTunes App Store or, for Android devices, visit the
                 Google Play Store and search for Infratil. Alternatively for a
                 direct link, visit our website www.infratil.com and it is FREE.

                                                                                   WorldReginfo - 5d4a1824-58b0-4423-b0df-8f1593a9e03e

                 Infratil is making its reports available in a format suitable
                 for mobile devices because of their increasing use.
                 Approximately half the population has, or will soon have
                 a smartphone and US studies show that more people get
                 information from the net than from newspapers.

                                                                                   1
Infratil
INTERIM Report
2012

CHAIRMAN AND CHIEF EXECUTIVE REPORT

At the half way point of the financial year Infratil is on track to deliver its full year earnings guidance and has
committed significant investment capital to underpin future earnings growth.
The most notable event for the period was commencement of TrustPower’s $550 million Snowtown II wind farm in
South Australia. This is the largest investment ever undertaken by the Infratil group and is projected to provide an
annual EBITDAF (Earnings Before Interest, Tax, Depreciation, Amortisation and Fair Value Movements) contribution of
$99 million when fully commissioned.
The Snowtown investment is important in its own right and as an indicator of Infratil’s ability to initiate high-quality
investments at a time when local demand for privately provided transport and energy infrastructure is limited. The
investment is also a good fit with Infratil’s strategy:
• Sector. Renewable energy is a growth sector which offers the returns required to attract capital.
• Value. “Buy low” remains a sure way to capture value and TrustPower has executed the transaction at a good price.
• Risk. Funding a $550 million outlay requires a strong financial position and access to long-term capital on suitable
  terms. The investment is also in a sector where the group has considerable expertise.
Other developments for the period were in-line with expectations, albeit some targets were exceeded while others
disappointed. The net outcome was a decision to declare an interim dividend of 3.25 cents per share, an increase of
8.0% over the prior year. Raising dividends to shareholders remains a priority, alongside the delivery of long-term
growth in capital values.
• Last year’s $50 million net parent surplus became a $17 million loss this year care of a $81 million turn-around in
  revaluations (up $11 million last year, down $70 million this year). Consolidated EBITDAF from continuing
  operations were $295 million, up 7% on the $276 million delivered in the same period last year. EBITDAF
  reconciliation to net surplus is shown in the table on page 4.
• Each of TrustPower, Wellington Airport, Infratil Energy Australia and Z Energy (on a current-cost basis) lifted
  EBITDAF from the same period last year. NZ Bus EBITDAF were lower due to a one-off revenue adjustment relating
  to prior years. In an environment of low growth and vigorous competition these were pleasing outcomes and
  reflect good positioning and strong management.
• The group has the support of its banks and access to long-term funding. Z Energy and TrustPower undertook
  well-supported bond issues, as did Infratil after balance date.

                                                                                                                           WorldReginfo - 5d4a1824-58b0-4423-b0df-8f1593a9e03e
• Although smaller than Snowtown II, the group’s other internal capital spending projects also progressed
  satisfactorily, however no acquisition or divestments were concluded during the half year. The sales process for
  Infratil’s remaining European airports has not yet reached the desired conclusion and the Board decided that an
  impairment charge of $44 million was appropriate at 30 September 2012.
In a difficult and uncertain economic environment Infratil’s earnings and investment progress was pleasing, as was
the ability to provide a higher dividend to shareholders.

2
Low economic growth results in two challenges. If the economy isn’t growing the demand for electricity, motor fuel
and even public transport and air travel is constrained. There is also greater focus on “value for money” as people
become more concerned about getting a better deal from their spending.
No business avoids these factors, but Infratil has some insulation from low demand care of its sector and location
diversity. For instance New Zealand has little immediate need for additional power stations, but Australia is seeking to
increase its renewable generation. “Value for money” can be a more difficult challenge. Our objective is to provide
services, whether fuel for a car or a trip home on the bus, which meet expectations and needs and are fairly priced.
However “fairly priced” can be difficult to define because it can be measured in several ways and depends on the time
frame. For instance, the owner of a wind farm may require income of only 1 cent per kwh of output to cover operating
costs, but would need several times that level of income to fund investment into further generation or replace wind
turbines as they wear out.
Over the long run the “fair price” is one which enables the owner of the power station (or airport, or bus or petrol
station) to derive sufficient income to enable its upkeep and fund future expansion.
The “value for money” debate is far from academic. Infratil’s businesses mainly operate in competitive markets but
they all, because of the crucial nature of their services, experience some regulatory oversight.
Although, not all regulation is about prices. Perhaps indicative of the times, Infratil’s businesses are currently
experiencing an unusually high level of regulatory activity of all types. New Zealand’s international treaty obligations
to reduce carbon emissions are being reassessed. Qantas and Emirates are seeking approval for an alliance. New laws
are being drafted to govern bus public transport, and its associated regulation. Airport information disclosures are
being reviewed. The Electricity Authority is consulting about new transmission pricing.
Few things are harder to explain to shareholders than regulation because the process creates such uncertain
outcomes. Regulation tends to have laudable objectives on paper but often complex and contingent consequences.
While low economic growth, competitive markets and heightened regulatory activity may sound like difficulties,
these challenges also provide opportunities for investors with operating capability. This was best demonstrated when
industry and financial markets difficulties led to Infratil’s investment in Z Energy.
We are fortunate that our businesses are meeting the expectations of their customers and communities and will
continue to grow earnings by improving efficiency and by investing in growth.

                                                                                                                       WorldReginfo - 5d4a1824-58b0-4423-b0df-8f1593a9e03e

David Newman                                            Marko Bogoievski
Chairman                                                Chief Executive

                                                                                                                       3
Infratil
INTERIM Report
2012

FINANCIAL RESULTS
Complete Financial Statements are available on www.Infratil.com

The following review of Infratil’s financial results for the period ended 30 September 2012 is set out under four
headings; Earnings, Assets, Funding and Shareholders. We have provided numbers to enable a clear comparison of
changes over the last six and 12 months and graphs to give an indication of the medium term trend over recent years.
Infratil’s financial results are relatively complex and judging them reflects assessment of both the current period
EBITDAF (up), net parent surplus (down), operating cash flow (stable), access to capital (good) and expectations of
future earnings growth (good). It was on the basis of these factors that the directors declared the 8% higher dividend
for the period.

Earnings
Consolidated Results
Period ended                                               30 September 2012                30 September 2011                      31 March 2012             Comment
$Millions                                                          6 months                         6 months                           12 months

Total income                                                                $1,257                           $1,144                         $2,219           Stronger operating earnings
                                                                                                                                                             were offset at the bottom-line
Operating expenditure                                                       ($962)                          ($868)                        ($1,699)           level by revaluations of
EBITDAF 1, 2                                                                 $295                            $276                            $520            currency, interest rate and
                                                                                                                                                             energy hedges (which tend to
Net interest                                                                  ($97)                           ($92)                          ($187)          fluctuate) and the one-off
                                                                                                                                                             downward revaluation of
Depreciation/amortisation                                                     ($73)                           ($64)                          ($134)          Infratil’s European Airports.
Revaluation of derivatives                                                    ($23)                              $11                            $19

Impairments/realisations                                                        ($3)                             $0                              $4

Tax                                                                           ($30)                           ($37)                           ($58)

Discontinued operations                                                       ($47)                             ($5)                          ($37)

Minority interests                                                            ($39)                           ($39)                           ($75)

Net parent surplus                                                            ($17)                            $50                             $52

1.		Consolidated group earnings before interest, tax, depreciation, amortisation and fair value movements. In accordance with accounting standards the figures exclude discontinued operations; that is the two
    UK airports subject to a sale process. Were those businesses included, the EBITDAF figures in the above table would have been $4 million lower in both half year periods and $12 million lower in FY2012.
    EBITDAF reflects Infratil’s share of Z Energy’s net profit after tax rather than earnings because Z is accounted for as an Associate and is not consolidated.

                                                                                                                                                                                                                     WorldReginfo - 5d4a1824-58b0-4423-b0df-8f1593a9e03e
2. EBITDAF is presented to provide further information on the operating performance of the Group. EBITDAF is a non-GAAP financial measure which shows the contribution to earnings prior to non-cash
   items such as depreciation and amortisation, fair value adjustments, and before the cost of financing and taxation. It is calculated by adjusting net surplus for the year from continuing operations for items
   that are non-operating such as interest, taxation, depreciation, amortisation, fair value movements of financial instruments, realisations, revaluations and impairments.

Operating Cash Flow
Period ended                                               30 September 2012                30 September 2011                      31 March 2012             Comment
$Millions                                                          6 months                         6 months                           12 months

EBITDAF                                                                      $295                            $276                            $520            Positive operating earnings
                                                                                                                                                             were balanced by higher tax
Discontinued operations                                                         ($4)                            ($4)                           ($12)         and interest expenses.
Net interest                                                                   ($91)                          ($87)                          ($176)          Guidance for the full year is
                                                                                                                                                             for positive cash flows of
Tax paid                                                                      ($35)                           ($23)                           ($47)          between $250 million and
                                                                                                                                                             $280 million.
Working capital/other                                                         ($59)                           ($54)                           ($97)

Operating cash flow                                                           $106                            $108                            $188

4
EBITDAF Breakdown

Period ended                                               30 September 2012                 30 September 2011                      31 March 2012              Comment
$Millions                                                          6 months                          6 months                           12 months

TrustPower                                                                     $166                             $162                           $300            The stand out result for the
                                                                                                                                                               period was provided by IEA.
Infratil Energy Australia                                                        $71                             $46                             $64           Z’s contribution is IFT’s share
Wellington Airport                                                              $40                              $36                             $76           of net shareholder surplus
                                                                                                                                                               because it is not consolidated.
NZ Bus                                                                           $22                             $24                             $46           Were its results shown on a
                                                                                                                                                               current cost basis1 they would
Z Energy                                                                          $8                              $18                            $52           have been $23 million for
                                                                                                                                                               the current period and
Other                                                                           ($12)                           ($10)                           ($18)
                                                                                                                                                               $22 million for the comparison
EBITDAF                                                                       $295                             $276                            $520            six months last year.

Discontinued Operations                                                          ($4)                            ($4)                            ($12)

1. Z Energy reports its earnings on an historic cost basis taking into account changes in the value of inventory, which may be volatile depending on how much the price of oil fluctuates. Current cost earnings
   are calculated by revaluing the cost of fuel to its cost at the reporting date. The difference between historic cost earnings and current cost earnings is in how the period’s opening and closing fuel inventory
   is valued. Over time the two measurements should be approximately the same, but there will be differences in any one accounting period and generally historic cost earnings will be more volatile. Z’s
   management (and capital providers) focus on current cost earnings as this reflects the underlying business model, as Z constantly sells fuel and buys product to replenish its inventory. By focusing on the
   current cost earnings management are able to protect margin in an industry which is generally high volume and low margin.

The following graph indicates the sources of Infratil’s consolidated EBITDAF over the last five years and the midpoint
of the guidance range for the current year to 31 March 2013.
Sources of Infratil’s Consolidated EBITDAF
                                                          Z Energy             NZ Bus           Wellington Airport                  Infratil Energy Australia                  TrustPower               Other
$ Millions

 600

 500

 400

                                                                                                                                                                                                                  WorldReginfo - 5d4a1824-58b0-4423-b0df-8f1593a9e03e
 300

 200

  100

     0

 -100
    2007                              2008                              2009                             2010                              2011                              2012                             2013

                                                                                                                                                                                                               5
Infratil
INTERIM Report
2012
Assets & Investment
Assets
As at 30 September 2012 31 March 2012 30 September 2011 Comment
$Millions
TrustPower $1,274 $1,154 $1,127 TrustPower’s rise in value
over the six months was due
Infratil Energy Australia $496 $477 $478 to an increase in its share
Wellington Airport 1 $315 $326 $260 price from $7.25 to $8.00.
IAE’s value was written down.
NZ Bus 1 $254 $246 $229 Other value changes reflect
changes in retained earnings
Z Energy $322 $331 $315 or movements in exchange
rates. Holdings of cash are
Infratil Airports Europe $28 $70 $101
excluded from the value of
Other $67 $65 $54 100% subsidiaries.
Total $2,756 $2,669 $2,564
1.
Excluding deferred tax liabilities.
Capital Spend
Period ended 30 September 2012 30 September 2011 31 March 2012 Comment
$Millions 6 months 6 months 12 months
TrustPower $99 $26 $49 The major capital projects
over the period were
Infratil Energy Australia $11 $11 $22 TrustPower’s generation at
Wellington Airport $5 $15 $22 Snowtown and Esk Valley,
NZ Bus’ fleet renewal and
NZ Bus $22 $29 $64 Z’s service station upgrade.
Z Energy 1 $39 $21 $74
Other $11 $5 $15
Total Capital Spend $187 $107 $246
WorldReginfo - 5d4a1824-58b0-4423-b0df-8f1593a9e03e
1.
100% of Z Energy capital spend.
Funding
Capital & Debt
As at 30 September 2012 31 March 2012 30 September 2011 Comment
$Millions
Net debt 100% subsidiaries $397 $363 $352 There were no notable
changes to the amount or
Fixed maturity bonds $623 $623 $563 terms of Infratil’s debt over
Perpetual bonds $235 $236 $237 the six months. Subsequent
to 30 September Infratil
Equity market value $1,268 $1,109 $1,062 repaid $57 million of
maturing bonds and issued
Total capital $2,523 $2,331 $2,214 $111 million of bonds to
mature in 2018.
100% subsidiary debt/capital 16% 15% 16%
Dated debt/capital 40% 42% 41%
6Shareholders
As at 30 September 2012 31 March 2012
Million Shares % Million Shares %
Utilico 83 14% 83 14%
Management 74 13% 74 13%
NZ retail 240 41% 242 41%
NZ institutions 131 22% 128 22%
Australian 15 3% 15 3%
Other 41 7% 45 7%
Total 584 587
Ownership of Infratil was largely unchanged over the six months. The New Zealand domiciled shareholding increased
to slightly over 76%.
4.5 million Infratil shares were repurchased by the Company and 1.8 million shares were issued under the dividend
reinvestment plan. The net outlay was $5 million.
Over the six months Infratil’s share price rose from $1.89 to $2.17 and a fully imputed dividend of 5 cents was paid.
The after tax return to shareholders for the period was 18%. The NZX50 returned 10% between 31 March and
30 September 2012.
WorldReginfo - 5d4a1824-58b0-4423-b0df-8f1593a9e03e
7Infratil
INTERIM Report
2012
community
Infratil announced a three year commitment to provide financial support to the National Youth Choir.
The Infratil group provides sponsorship and other help to a number of community groups. Infratil will only do
well for its shareholders when its communities also do well.
Choral music is popular across New Zealand and Choirs Aotearoa (the governing body of the National Youth
Choir) helps young singers take the step-up after school; to perform with an excellent choir and to learn.
Music in New Zealand is a huge beneficiary. We all have the opportunity to hear a brilliant choir. It is an
aspirational goal for young singers. Many of its alumni go on to scale further musical highs and many become
the teachers and supporters of tomorrow.
WorldReginfo - 5d4a1824-58b0-4423-b0df-8f1593a9e03e
the national youth choir
sings in parliament’s
Legislative chamber for
an audience of MPs and
invited guests.
89 WorldReginfo - 5d4a1824-58b0-4423-b0df-8f1593a9e03e
Infratil
INTERIM Report
2012

TRUSTPOWER

It is now regarded as normal for TrustPower to deliver good earnings, but in this case the outcome was notable as it
was against a backdrop of very difficult market and climatic conditions. The annual PwC energy sector report
highlighted that inflows to the South Island hydro lakes in the autumn and early winter months were the lowest ever
recorded and at the same time retail competition reached new highs. An unfortunate combination of factors
coincidentally driving wholesale prices higher and retail prices lower, with a consequent impact on margins.
TrustPower’s New Zealand generation production was reduced as were its sales to retail and commercial customers,
however earnings were maintained by the use of hedges and by utilising hydro storage to maximise generation at
peak price times. Higher wind generation in Australia also helped.
The PwC report also reaffirmed that TrustPower is the best managed of New Zealand’s power companies on the
criteria of earnings and returns.
In the context of New Zealand’s lack of electricity demand growth, and postponement of power station construction,
TrustPower’s development of opportunities across the Tasman was prescient. However, locally, TrustPower was also
active, albeit in a different field, as it was granted amendments to the Rakaia River Water Conservation Order which
will allow irrigation of the Canterbury Plains using water stored at Lake Coleridge.
Starting work on the Snowtown II wind farm was the period’s major event. This project has been several years in
development and its excellent value characteristics reflect well on the expertise of TrustPower’s management and the
disciplined approach taken to each element of the transaction. Australia requires more wind farms if it is to meet the
policy goal of 20% renewable generation by 2020 and TrustPower has more consented sites.

Operations AND Results                                      EARNINGS AND GENERATION
                          30 Sep      30 Sep       31 Mar    Year ended 31 March                                     Generation GWh
Period ended                2012        2011        2012
                                                            EBITDAF $M                                                      Generation GWh

Electricity customers   206,000      218,000     209,000    350                                                                    3,000

NZ generation           1,292GWh    1,414GWh    2,581GWh    300

Australian generation    186GWh      177GWh      376GWh     250
                                                                                                 EBITDAF
Av. NZ generation                                           200
spot price              9.7c/kwh     6.1c/kwh    7.2c/kwh                                                                          2,000
                                                            150

                                                                                                                                             WorldReginfo - 5d4a1824-58b0-4423-b0df-8f1593a9e03e
EBITDAF                   $166m       $162m       $300m
                                                            100
Capital spending           $99m        $26m        $49m
                                                             50
Infratil cash income       $32m        $32m        $64m
                                                              0                                                                  1,000
                                                                  2001      2003         2005         2007    2009   2011   2013*
                                                               * 2013 EBITDAF full year guidance projection

10
Coleridge power station was
the New Zealand Government’s
first major generation project.
Construction started in 1911 and
stage one was completed in 1914.
WorldReginfo - 5d4a1824-58b0-4423-b0df-8f1593a9e03e
COLERIDGE power station
CANTERBURY
11Infratil
INTERIM Report
2012
INFRATIL ENERGY AUSTRALIA GROUP
IEA had an excellent six months, delivering increased customer numbers and earnings.
The increase in earnings is attributable to the Lumo retail business where margins on electricity and gas sales
increased, customer numbers were higher, it was a cool winter in Victoria which encouraged residential gas use, and
operating costs were well controlled.
Both generation and Perth Energy produced results slightly down on the prior period. Wholesale electricity prices
remain weak and Perth Energy also experienced maintenance and availability costs with its generation. Work on
expanding IEA’s generation is on hold at present.
As would be evident from any review of the Australian energy market, it is complicated. It has direct state and federal
regulation and is indirectly affected by state and federal efforts to reduce carbon emissions. It is also an industry
which is slowly progressing from largely state ownership to largely private ownership.
This complexity and the ownership evolution was what originally attracted Infratil to start up IEA. The last six months
is further testament to the success of Infratil’s original vision of a business based on strong risk control and a focus on
market segments where a nimble new-entrant could benefit. This is most obviously paying dividends at Lumo which
this financial year is expected to reach the milestone of 500,000 customers.
IEA’s generation has experienced the flip-side of some of the market features which have benefitted Lumo. IEA’s
peaking facilities are only used in periods with high prices, which tend to be either when temperatures soar and air
conditioning use jumps or when there is suddenly a shortage of electricity because of a grid failure or power station
outage. Recently neither event has occurred with any frequency.
Perth Energy also had a disappointing half year due to additional market costs which could not be immediately
passed on to retail customers and problems with its generation availability. A better second half is anticipated.
Operations AND Results EARNINGS AND CUSTOMERS
Period ended 30 Sep 30 Sep 31 Mar Year ended 31 March
(A$ millions) 2012 2011 2012
EBITDAF A$M Customers
Lumo customers 471,953 414,400 441,788 80 450,000
Generation capacity 285 MW 277 MW 285 MW 70 400,000
EBITDAF contribution 60 350,000
WorldReginfo - 5d4a1824-58b0-4423-b0df-8f1593a9e03e
Lumo $54 $36 $44 50 300,000
IEA generation $0 $2 $11 40 250,000
Perth Energy $4 $5 $12
30 200,000
NGAC/overheads ($2) ($7) ($17) EBITDAF
20 150,000
EBITDAF $56 $36 $50
10 100,000
Hedge revaluations $5 $25 $31
0 50,000
Depreciation/amortisation ($14) ($10) ($24) 2005 2007 2009 2011 2013*
External net interest ($4) ($4) ($9) NSW South Australia Queensland Victoria
Tax ($11) ($13) ($11)
* 2013 EBITDAF full year guidance projection.
IEA/Lumo net external debt ($13) ($20) ($27)
Perth Energy external debt ($56) ($63) ($65)
Infratil value of IEA/Lumo NZ$412 NZ$391 NZ$392
Infratil value Perth Energy NZ$83 NZ$86 NZ$85
12Lumo has 350,000 customer
accounts in Victoria and is the
State’s 4th largest retailer (by
customer numbers). Lumo’s fastest
rate of growth is in NSW which has
only recently deregulated.
WorldReginfo - 5d4a1824-58b0-4423-b0df-8f1593a9e03e
FLINDERS STREET STATION
MELBOURNE
AUSTRALIA
13Infratil
INTERIM Report
2012
Z ENERGY
Z Energy delivered increased EBITDAF and shareholder returns when measured on a current cost basis (which
excludes inventory value adjustments).
Z Energy continues the transition to local, stand alone, operation and identity. The “Z” brand now covers all points of
sale and the upgrade of Z’s approximately 100 tier one service stations should be concluded this year.
Behind the scenes good progress is occurring to lower operating costs and improve productivity and reliability. This
included contracting a new supplier of imported refined product which is forecast to save $5 million per annum.
Additional storage and terminal facilities are being planned for Lyttelton and Mt Maunganui to add resilience to Z’s
supply lines and to lower shipping costs by allowing the receipt of larger cargoes.
The other efficiency measure progressed over the period related to being willing to reduce throughput if it is not
profitable. Z lost two major commercial contracts which produced a combined contribution to annual earnings of
approximately $1 million, but required an investment in supply infrastructure and inventory which meant a negative
bottom line.
Retail competition was aggressive and competitors launched a number of initiatives to maintain or boost market
share in the current no-growth market. Because work occurring at service stations meant a number have been closed
for periods it is hard to draw conclusions about Z’s relative performance, but surveys show that Z is New Zealand’s
most preferred and recommended fuel retailer.
Operations AND Results EARNINGS AND FUEL VOLUMES
Period ended 30 Sep 30 Sep 31 Mar Sales Million Litres
2012 2011 2012
EBITDAF $M Million Litres
Sales (million litres) 1,248 1,301 2,647 200
2,800
Sourced from refinery 77% 71% 71% EBITDAF (ex-NZR)
Distributed to retail 47% 49% 47% 160
2,600
Inventory (million litres) 427 521 605
120
Revenue (ex tax) $1,492m $1,546m $3,179m 2,400
Gross margin $231m $209m $422m 80
Operating costs ($134m) ($126m) ($250m) 2,200
40
WorldReginfo - 5d4a1824-58b0-4423-b0df-8f1593a9e03e
Current cost EBITDAF $97m $83m $172m
NZRC contribution $4m $6m $4m 0 2,000
Stock value adjustment ($43m) ($12m) $30m 2004 2005 2006 2007 2008 2009 2011 2012 2013*
* 2013 EBITDAF full year guidance projection.
Historic cost EBITDAF $58m $77m $206m (Prior to 2011 the periods are calendar years. Infratil and NZ Super acquired Z Energy on 1
April 2010 and the subsequent periods are years ended 31 March)
External interest ($23m) ($21m) ($38m)
Z Energy reports its earnings on an historic cost basis taking into account changes in the
Depreciation/revaluations ($18m) ($10m) ($32m) value of inventory, which may be volatile depending on how much the price of oil fluctuates.
Current cost earnings are calculated by revaluing the cost of fuel to its cost at the reporting
Tax ($1m) ($9m) ($31m) date. The difference between historic cost earnings and current cost earnings is in how the
period’s opening and closing fuel inventory is valued. Over time the two measurements
Shareholder surplus $16m $37m $105m should be approximately the same, but there will be differences in any one accounting period
and generally historic cost earnings will be more volatile. Z’s management (and capital
Shareholder cash income $35m $30m $59m providers) focus on current cost earnings as this reflects the underlying business model, as Z
constantly sells fuel and buys product to replenish its inventory. By focusing on the current
cost earnings management are able to protect margin in an industry which is generally high
Margin* 3.2c/litre 2.5c/litre 2.5c/litre
volume and low margin.
Capital spending $39m $21m $74m
Net financial debt $433m $244m $420m
Shareholders’ capital $634m $620m $653m
* Per litre Current Cost EBITDAF less interest, normalised tax, depreciation and amortisations.
14Rebranding of the Z Energy
distribution network has been
completed, the facilities and
services upgrade is continuing.
WorldReginfo - 5d4a1824-58b0-4423-b0df-8f1593a9e03e
15Infratil
INTERIM Report
2012
WELLINGTON AIRPORT
Wellington experienced modest throughput growth and progressed plans for the facilities upgrades required to meet
increasing demand.
Domestic growth was largely due to Jetstar’s provision of well-priced jet services to Queenstown, they are also adding
a further jet to the trunk, equivalent to 500,000 seats per annum. Tasman traffic has been stable but the intended
alliance between Emirates and Qantas is being watched closely. Although Wellington has no Emirates services it has
been that airline and Virgin Blue which have dominated capacity increases between New Zealand and Australia over
the last decade. Virgin Blue is approximately 20% owned by its alliance partner Air New Zealand.
Wellington now accommodates about 15,000 passengers on an average week day (about 1,300 an hour at peak
times), up from about 10,000 a day a decade ago (900 passengers an hour at peak). It has delivered this increased
productivity with an enhanced passenger experience. To ensure it can maintain capability and passenger experience
Wellington Airport is forecast to spend approximately $80 million on its aeronautical facilities over the next five years.
In March the Airport concluded consultation with its major airline customers over aeronautical charges for the period
out to 2017. The charges are set from forecasts of passenger throughput, airport operating costs and additional
investment, tax and interest rates, and the amount by which the Airport’s assets change in value (forecast changes in
value are treated as income and credited to the airlines reducing their charges). Under Commerce Act changes from
2008 Wellington is now required to provide a special disclosure on the new charges which the Commerce
Commission had to review.
The Commerce Commission review process requires the regulator to review the effectiveness of the new information
disclosure regime and measure progress in the areas of innovation, quality, pricing and investment. The draft report
was mainly positive although it indicated an interim conclusion that the new regime was ineffective at limiting
excessive profits. At this stage the complexity of the analysis and the nature of the process, with ongoing involvement
by courts, government officials and ministers, makes long-term conclusions uncertain.
Operations AND Results EARNINGS AND PASSENGERS
Period ended 30 Sep 30 Sep 31 Mar Year ended 31 March Passengers
2012 2011 2012 EBITDAF $M Passengers millions
Passengers domestic 2,235,500 2,205,293 4,473,544 80 6
Passengers international 333,088 319,607 718,185 70
WorldReginfo - 5d4a1824-58b0-4423-b0df-8f1593a9e03e
EBITDAF
Aeronautical income $31m $29m $61m 60 5
Passenger services income $16m $16m $32m 50
Property/other $5m $4m $7m 40 4
Operating costs ($12m) ($13m) ($24m) 30
EBITDAF $40m $36m $76m 20 3
Capital spending $5m $15m $22m 10
Infratil cash income $30m $57m $57m 0 2
2001 2003 2005 2007 2009 2011 2013*
* 2013 EBITDAF full year guidance projection.
16The stars of The Hobbit an
Unexpected Journey arrive
at Wellington Airport for the
world premiere.
WorldReginfo - 5d4a1824-58b0-4423-b0df-8f1593a9e03e
17Infratil
INTERIM Report
2012
NZ BUS
Passenger numbers were slightly ahead of last year, but after adjusting the figures for this year’s fewer number of
working days and last year’s RWC, trend growth remains around 5%. EBITDAF would have been almost the same as
last year, but NZ Bus was required to take a one-off revenue adjustment relating to a prior year of $2 million.
Behind the flat performance NZ Bus continues to make excellent progress in meeting its goal of providing world-
leading reliability and service quality with tightly controlled costs.
Infratil acquired NZ Bus seven years ago and the company is now almost unrecognisable from the one purchased.
An important signal of the culture change was the agreement recently reached between NZ Bus and its Auckland
staff over employment terms for the next two and a half years.
NZ Bus is investing in the health, safety and on-going training of its staff, and is also upgrading fleet and depots for
the benefit of both customers and its people.
NZ Bus’s longer-term growth and returns depends on how public transport is managed and funded in Auckland and
Wellington and changes to the industry’s regulatory and management regime continues to inch forward. Parliament’s
Transport Select Committee is reviewing legislation and the Auckland and Wellington transport authorities are
developing long-term incentive-based contracts for implementation once the legislation is enacted. In both regions
new public transport network plans are in the final stages of development. NZ Bus is continuing to invest in
anticipation of the changes, promoting the opportunity for growth and satisfactory returns.
The need for Auckland to have a significantly better bus public transport network was clearly signalled by Treasury’s
recent National State of Infrastructure Report. This identified that expanding Auckland’s road and rail networks over
the next 30 years to meet projected demand will cost $700 million a year, which equates to a 50% rise in the city’s
rates. Buses remain by far the most cost–efficient way to improve urban mobility in New Zealand.
Operations AND Results EARNINGS AND PATRONAGE
Period ended 30 Sep 30 Sep 31 Mar Year ended 31 March Passenger trips
2012 2011 2012
EBITDAF $M Passenger trips millions
Patronage north 20,170,859 19,705,387 38,713,136 60 60
EBITDAF
Patronage south 10,669,866 10,639,249 20,341,102 50
Bus distance (kilometres) 24.2m 22.6m 46.4m 40 50
WorldReginfo - 5d4a1824-58b0-4423-b0df-8f1593a9e03e
Passenger income $65m* $64m $127m 30
Contract income $44m $42m $84m 20 40
Other income $3m $4m $9m 10
Operating costs ($90m) ($86m) ($174m) 0 30
2006 2007 2008 2009 2010 2011 2012 2013*
EBITDAF $22m $24m $46m * 2013 EBITDAF full year guidance projection.
Capital spending $22m $29m $64m
* Including $2 million prior period adjustment
18NZ Bus has ordered 276 new ADL
buses which are built in Tauranga.
156 buses are also undergoing
engine refurbishment.
WorldReginfo - 5d4a1824-58b0-4423-b0df-8f1593a9e03e
19Infratil
INTERIM Report
2012
OTHER INVESTMENTS
Snapper suffered a set-back with the decision by Auckland Transport to appoint an overseas supplier for its long-term
bus ticketing system. Given that Snapper is proven on over 1,000 buses and 3,000 taxis this is disappointing.
Infratil Infrastructure Property is progressing completion of the New Lynn Centre in partnership with the
Auckland Council.
The European Airports are operating on a cost minimisation basis. The sales process for both Glasgow Prestwick and
Kent has been unsuccessful to date and as a result Infratil took an impairment charge of
$44 million at the half year to write-down the value of both assets. As at 30 September the revised asset value of
Glasgow was £14.3 million and Kent £7.6 million. Infratil continues to seek buyers for the airports while also working
with local stakeholders to review alternatives.
No acquisitions were concluded over the period despite a high level of activity. Management actively reviewed a
number of potential opportunities without a transaction arising. As noted in the recent Infratil Update, Infratil has the
advantage of being able to compare internal investments, such as Snowtown II, against external acquisitions. Investors
without choices and facing an extremely low interest rate environment are more willing to “pay up”, even if it means
being locked into low returns.
WorldReginfo - 5d4a1824-58b0-4423-b0df-8f1593a9e03e
20DIRECTORY
Directors CALENDAR
D A R Newman (Chairman)
Final dividend paid 15 June 2012
M Bogoievski Annual meeting 13 August 2012
H J D Rolleston Infratil Update publication September 2012
D P Saville Half year end 30 September 2012
M Tume Interim result release 13 November 2012
A Y Muh (alternate to D P Saville) Interim dividend paid 14 December 2012
P Gough (appointed 4 December 2012) Infratil Update publication March 2013
Company Secretary Financial year end 31 March 2013
Kevin Baker
UPDATES/INFORMATION
Registered Office - New Zealand
Each year Infratil provides Annual and Interim Reports, two
5 Market Lane Update newsletters on matters of relevance to Infratil, a series
PO Box 320, Wellington
of Operational Reports on each of its businesses, and occasional
Telephone: 04 473 3663
presentations and announcements. All are available on Infratil’s
Internet address: www.infratil.com
website and will soon be available via Infratil’s app. The two
Registered Office - Australia Updates put out in 2012 covered:
C/- H.R.L. Morrison & Co Private Markets September 2012: Over the last decade the Infratil group invested
Suite 40C, Level 40, Governor Phillip Tower $3,060 million and its consolidated annual EBITDAF rose from
1 Farrer Place $35 million to $520 million. Over the same period Infratil’s compound
Sydney, NSW 2000 after-tax return to shareholders was 13.7% per annum. The
Telephone: +61 2 8098 7500 Update explains the strategy behind Infratil’s investment activity.
Manager March 2012: In March Infratil held its annual Investor Day and
Morrison & Co Infrastructure Management the Update summarises the presentations, including by the
5 Market Lane Minister for the Environment and Prof. Tim Flannery Chair of the
PO Box 1395, Wellington Copenhagen Climate Council. It also explains the differences
Telephone: 04 473 2399 between a New Zealand and Australian residential electricity bill
Facsimile: 04 473 2388 and why smart energy meters have not been so smart.
Internet address: www.hrlmorrison.com Infratil on Facebook.
Share Registrar
Link Market Services CORPORATE AWARDS
138 Tancred Street
PO Box 384, Ashburton
Wellington Chamber of Commerce Achievement Award for
contribution to the development of Wellington.
Telephone: 03 308 8887
Institute of Financial Professionals New Zealand (INFINZ) Finalist:
E-mail: lmsenquiries@linkmarketservices.com
Best Corporate Communication 2003, 2004, 2005, 2006, 2008,
WorldReginfo - 5d4a1824-58b0-4423-b0df-8f1593a9e03e
Share Registrar - Australia 2010 and 2011.
Link Market Services Best Debt Deal 2007. Best Corporate Treasury 2007, 2008, 2011.
Level 12, 680 George Street New Zealand Shareholders’ Association Best and Fairest Award.
Sydney, NSW 2000 Finance Asia Best New Zealand Deal 2007.
Telephone: +61 2 8280 7111 Deloitte / Management Magazine Company of the Year 2007.
E-mail: registrars@linkmarketservices.com.au
Auditor
KPMG
10 Customhouse Quay
PO Box 996
Wellington
Bankers
ANZ National Bank, 215-229 Lambton Quay, Wellington
Bank of New Zealand, 80 Queen Street, Auckland
Commonwealth Bank of Australia, 135 Albert Street, Auckland
Hong Kong and Shanghai Banking Corporation,
HSBC Tower, 195 Lambton Quay, Wellington
Industrial and Commercial Bank of China, 220 George Street, Sydney
Kiwibank, 155 The Terrace, Wellington
Westpac Banking Corporation, 188 Quay Street, Auckland
2122 WorldReginfo - 5d4a1824-58b0-4423-b0df-8f1593a9e03e
You can also read