Interim Result 2021 Goodman Property Trust - Amazon AWS
←
→
Page content transcription
If your browser does not render page correctly, please read the page content below

Goodman Property Trust

Interim
Result
2021

                         1
Goodman Property Trust Interim Result 2021

Contents
                 03 Overview
                 05 Financial result
                 12 Capital management
                 15 Investment portfolio
                 23 Development programme
                 27 Outlook
                 31 Appendix

    Presented by:
    John Dakin Chief Executive Officer + James Spence Director - Investment Management + Andy Eakin Chief Financial Officer

Waiouru Road, Highbrook Business Park         Unless otherwise indicated, all numerical data provided in this presentation is stated as at 30 September 2020. All dollar values are NZD unless otherwise stated. All figures are rounded. Non-GAAP financial measures may not be consistent with their calculation by other similar entities.   2
Goodman Property Trust Interim Result 2021

Overview

Gateway warehouses, Highbrook Business Park    3
Goodman Property Trust Interim Result 2021
Overview
Portfolio metrics remain strong following 94,393 sqm of leasing
Occupancy of 99.7%, retention rate of 76%1, WALE of 5.4 years
$108 million of investment commitments in line with strategy to invest in the Auckland industrial market
Acquisition of properties neighbouring Savill Link and Mt Wellington Estate with a total purchase price of $83 million and a total site area of 14.5 ha
Recommencement of previously paused 9,000 sqm build-to-lease development at M20
Financial position provides significant financial flexibility to continue accretive investment programme
Interim revaluation of $140.2 million (4.4%), largely driven by cap rate compression (20 bps)
Gearing of 21.5% (22.3% on a fully committed basis)
Refinancing of GMT’s bank facility completed, increasing weighted average debt term to 5.1 years2 and providing $400 million of available funding capacity
Increase in NTA by 9.7 cpu (5.6%) to 182.4 cpu
Guidance
Based on the current economic outlook and our expectations of its portfolio impact, FY21 cash earnings are expected to be at least 6.3 cpu
Distributions for FY21 to be not less than 5.3 cents per unit, around the midpoint of the 80% - 90% FY21 cash earnings’ guidance
1 Retention rate measured over a 12 month period
2 Calculated on drawn debt assuming any bank debt outstanding is drawn from the longest term facility
4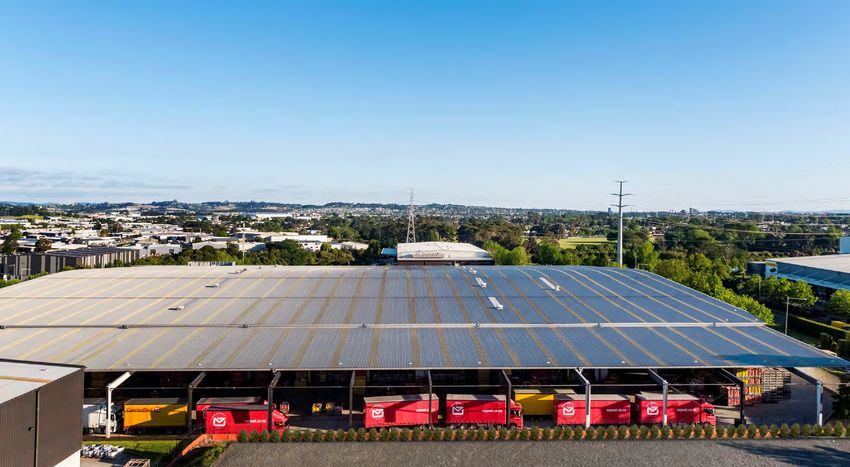
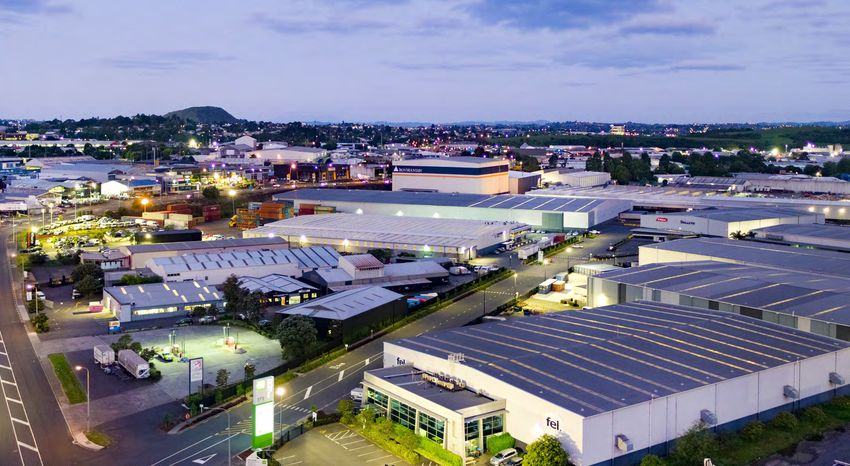
Goodman Property Trust Interim Result 2021

Financial
results

The Gate Industry Park, Penrose                5
Goodman Property
  Goodman PropertyTrust
                   TrustInterim Result
                          Interim      2021
                                  Result  2021

Financial highlights

         $186.4m $140.2m 182.4cpu 21.5%
         Profit before tax                                                       Portfolio revaluation                                                    Net tangible asset backing                                                  Loan-to-value ratio1

         4.2%
         Net property income growth2
                                                                                 3.11cpu
                                                                                  Cash earnings3
                                                                                                                                                           2.65cpu
                                                                                                                                                            1H FY21 distributions
                                                                                                                                                                                                                                     5.1 years
                                                                                                                                                                                                                                      Weighted average debt term4

  1 LVR is a non-GAAP financial measure used to assess the strength of GMT’s balance sheet, details of its calculation can be found in note 2.6 to GMT’s Interim Financial Statements
  2 Net Property Income for the 6 months to 30 September 2020 compared to Net Property Income for the 6 months to 30 September 2019
  3 Cash earnings is a non-GAAP financial measure that assesses underlying cash flows, on a per unit basis, after adjusting for borrowing costs and Manager’s base fee capitalised to land and expenditure related to building maintenance, as detailed on slide 8

  4 Calculated on drawn debt assuming any drawn bank debt utilises the longest dated facility

Highbrook Business Park, East Tamaki                                                                                                                                                                                                                                 6
Goodman Property Trust Interim Result 2021
Net property income
Net property income bridge
($m)
Net property income up $3.0 million or 4.2% for
78.0 1H (~7% excluding the impact of rental
77.0
abatements)
76.0
+0.1
$2.2 million of rental abatement impact1, with
+1.5
-2.2 rental relief focussed on retail and hospitality
75.0
customers
74.0 +2.2 74.3
+ Additional support given by way of rental
73.0 deferrals and mutually beneficial leasing
72.0
outcomes
+2.4
71.0 71.3
Underlying like-for-like rental growth of 3.7% for
-1.0
the period2
70.0
69.0
68.0
67.0
FY20 Disposals Acquisitions Developments Underlying Additional Abatements1 FY21
portfolio income
1 Total impact of abatements on first half NPI, includes rent abatements and lower rent received as a result of rent reviews delayed or waived
2 Net rental income on underlying portfolio, adjusted to remove abatements, straight-lined income and fitout rents
7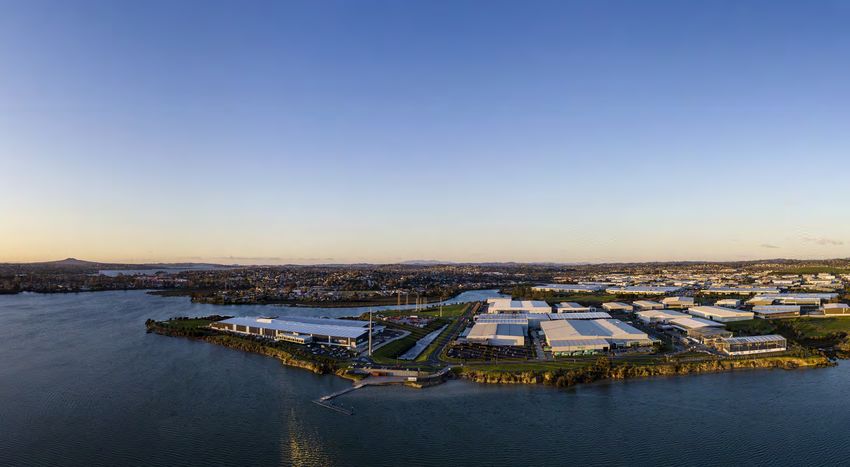
Goodman Property Trust Interim Result 2021
Cash earnings
Cash earnings summary ($m)
1H21 1H20 1H FY21 cash earnings of 3.11 cents per unit
Operating earnings before tax1 56.0 53.7
Distributions of 2.65 cents per unit for the period
Tax on operating earnings (9.6) (9.0) represents 85.2% of cash earnings
Operating earnings after tax 46.4 44.7
$3.6 million of total capex spent on stabilised
Capitalised borrowing costs – land (1.2) (2.1)
portfolio in 1H, of which $1.9 million is maintenance
Capitalised management fees – land (0.1) (0.1) capex
Maintenance capex (1.9) (1.4)
FY21 cash earnings are now expected to be at least
Cash earnings2 43.2 41.1
6.3 cpu as a result of a more favourable economic
outlook than had previously been expected
Cash earnings per unit (cpu) 3.11 3.15
Distributions per unit (cpu) 2.65 3.325
Distributions % of cash earnings 85.2% 105.6%
1 Operating earnings is a non-GAAP financial measure used to provide an assessment of the performance of GMT’s principal operating activities. Refer to GMT’s interim Profit or Loss statement in the Trust’s Interim Financial Statements for further information.
2 Cash earnings is a non-GAAP financial measure that assesses underlying operating cashflows, after adjusting for borrowing costs and Manager’s base fee capitalised to land and expenditure related to building maintenance.
8
Goodman Property Trust Interim Result 2021
Capital growth
Net tangible assets
(cents per unit)
NTA increased 9.7 cents per unit (5.6%) in the first
190.0
six months of FY21 to 182.4 cents per unit
4.4% increase in portfolio value main contributor
185.0
$7.4 million revaluation gains on developments
+0.7 -0.7 +0.4 182.4
reflects an average margin of 23%1
180.0
+9.3
175.0
172.7
170.0
165.0
160.0
31-Mar-20 Revaluation - Revaluation - Movement in fair Other 30-Sep-20
stabilised developments and value of financial
land instruments
1 Margin reflects completed developments only and includes any revaluation relating to those developments recorded in prior periods
9Goodman Property Trust Interim Result 2021
Investment property
Investment property
($m)
Total investment property increased by
3,400
$268.3 million to $3.3 billion
3,342.3
+2.9 +9.8 54.5 Acquisitions and developments adding
3,300
$125.7 million
+129.9
69.7
3,200
Interests in leasehold land valued at $65.6 million
+42.7 under IFRS16 (corresponding lease liability of
$62.4 million)
+83.0
3,100 3,074.0
47.3
3,000 3,218.1
74.9
2,900
2,951.8
2,800
31-Mar-20 Acquisitions Developments Stabilised Land Other 1 30-Sep-20
revaluation revaluation
Stabilised Development Land
1 Includes capitalised costs (capital expenditure, capitalised holding costs and deferred costs on stabilised and land) and IFRS 16 adjustment
10Goodman Property Trust Interim Result 2021
Gearing
Loan to value ratio1 (LVR)
GMT continues to be conservatively
23%
leveraged, providing significant
resilience and capacity for both
22% 22.3%
+0.8% acquisitions and investment in its
+0.8% -0.9%
+0.5% 21.5% development pipeline
21%
LVR of 21.5% at 30 September 2020
20% +2.2% with fully committed LVR at 22.3%
19% Medium term preferred LVR range
18.9%
remains 25% - 35%
18%
17%
16%
15%
31-Mar-20 Acquisitions Developments Stabilised Other 30-Sep-20 Committed Committed LVR
revaluation developments2
1 LVR is a non-GAAP financial measure used to assess the strength of GMT’s balance sheet; details of its calculation can be found in note 2.6 to GMT’s Interim Financial Statements
2 Includes M20 9,000 sqm development which has been recommitted to, but excludes Highbrook 10,000 sqm development which remains paused
11Goodman Property Trust Interim Result 2021 Capital management Highbrook Business Park 12
Goodman Property Trust Interim Result 2021
Managing funding risk
Maturity profile1
($m)
Funding diversity extended through issuance of two
250
tranches of wholesale bonds:
+ $50 million of 8 year 2.262% fixed rate bonds
200 + $150 million of 10 year 2.559% fixed rate bonds
100 100
100
FY22 bank maturity extended to FY25 with existing
syndicate banks
150
150 $400 million of available bank funding
100
30-Sep-20 31-Mar-20
135 135 Drawn debt from non-bank sources 100% 96%
130
50 100 Available funding capacity $400m $375m
56 52 52
50 Weighted average debt term (drawn)2 5.1y 4.0y
Gearing covenant measure (Goodman Property Trust Interim Result 2021
Managing interest rate risk
Hedging profile
Effective hedging levels increased through issuance of 8 and 10 year
100%
wholesale bonds at underlying rates of ~40 bps and ~56 bps
90%
Following wholesale bond issuance, hedge levels managed through
80%
close-out of shorter term fixed rate swaps
70% Interest rate swaps and cross currency interest rate swaps, less the
USPP foreign exchange impact, are net ITM $17.7 million
60%
Normalised interest cover ratio (ICR) excluding one-off cash cost of
50% swap close-outs is 4.8x (31 March 2020: 4.3x)
40%
30-Sep-20 31-Mar-20
30% 12 month forward hedging level 88% 68%
20% Weighted average debt cost 4.0% 5.0%
ICR covenant measure (>2.0x) 3.5x 3.9x
10%
ICR normalised1 4.8x 4.3x
0%
Y1 Y2 Y3 Y4 Y5
1 Adjusted to exclude the cash cost of swap terminations
14Goodman Property Trust Interim Result 2021 Investment portfolio Courier Post, Highbrook Business Park 15
Goodman Property Trust Interim Result 2021

GMT’s property portfolio
  $3.3bn
   Property portfolio

  1.1m sqm
  Net lettable area

  11
   Estates

                                             16
Goodman Property Trust Interim Result 2021
Portfolio metrics
99.7%
Occupancy
100%
Auckland warehouse and logistics weighting
5.4 years
Weighted average lease term
$46.3m
Development completions1
1.6%
Land weighting
1 Valuation upon completion
MetroBox, Savill Link 17Goodman Property Trust Interim Result 2021
Portfolio leasing
Lease expiry profile (% of portfolio income)
Occupancy of 99.7% following leasing for the year 25%
across 94,393 sqm (8.8% of portfolio):
20%
+ 90,547 sqm with existing customers
+ 9.7% rental increase achieved2 with incentives 15%
averaging 4.4%
10%
+ Retention rate of 76%3
5%
0%
Vacant FY21 FY22 FY23 FY24 FY25 FY26 FY27 FY28 FY29 >FY29
Value Add 1
1
Core Leased since March 20
Occupancy (% of portfolio income)
100%
99%
98%
97%
96%
1 Value-add
95%
estates include: Tamaki Estate, Penrose Industrial, Favona, Mt Wellington, Roma Road, Connect Industrial, Savill 2
2 Excludes leases where lease renewal executed, but commencement rental still subject to market review FY17 FY18 FY19 FY20 1H21
3 Retention rate measured over 12 month period
18Goodman Property Trust Interim Result 2021
Customer base
Top ten customers (% of portfolio income)
Top 10 customers account for 32% of portfolio income, generally
NZ Post
focused on storage, logistics and distribution
DHL
OfficeMax
Fletcher Building
Industry exposure (% of income)
Coda
T&G Global
Foodstuffs
Freightways 1
Fliway
Toll
0% 1% 2% 3% 4% 5% 6% 7%
1 Leased to Big Chill Distribution Limited, a subsidiary of Freightways
19Goodman Property Trust Interim Result 2021
Customers
COVID-19 continues to disrupt markets
Approximately 40% of GMT’s customers (70% by income), were utilising their premises to some degree through the Alert Level 4 restrictions.
Over 90% of customers (by income) were open to some extent from Alert Level 3
While the majority of GMT’s customers have adapted to the new operating environment a number, typically retail and hospitality businesses, have
experienced significant hardship as a result of COVID-19
Support in 1H FY21 by way of abatements, delayed rent reviews, leasing deals and deferrals were provided to a number of GMT’s customers
+ 1H FY21 P&L impact of customer support equates to approximately $2.2m1
Sample survey of GMT’s warehouse customers base shows:
+ Approximately a third of customers sampled expect to require more warehousing space in next 2 years
+ A number of customers continue to have issues with international supply chain and goods sourcing
+ Customers’ operations are increasing in sophistication, with many looking at further investment to improve their supply chain efficiency
Globally, new warehouse demand being led by customers leveraged to the acceleration in online and digital activity
1 Impact of abatements and rent review delays only, excludes amortisation of incentives provided on leasing deals agreed to provide support to customers
20Goodman Property Trust Interim Result 2021
Savill Link extension Strategic investment in proven logistics location
$70.0m
Purchase price
13.3ha
Land area
Savill Link
Acquisition properties
21Goodman Property Trust Interim Result 2021
Portfolio valuation
Portfolio summary as at 30 September 2020
Valuation $m Cap rate Initial Yield WALE years Occupancy Net lettable area sqm
Highbrook Business Park 1,609.3 5.0% 4.9% 6.3 99% 453,458
Savill Link 390.4 5.0% 4.9% 6.0 100% 129,466
M20 Business Park 283.0 5.6% 5.5% 4.5 100% 108,491
The Gate Industry Park1 250.4 5.4% 5.1% 3.1 100% 85,439
Westney Industry Park1 195.1 6.6% 9.2% 5.3 100% 105,763
Value-add estates 443.6 5.4% 4.8% 2.6 99% 181,189
Underlying stabilised portfolio 3,171.8 5.2% 5.0% 5.4 100% 1,063,806
Completed developments 46.3 4.7% 4.8% 11.7 100% 12,895
Total stabilised properties 3,218.1 5.2% 5.0% 5.4 100% 1,076,700
Developments held at fair value 57.0 5.1%2 2.0%2 5.22 43% 30,649
Developments held at cost 12.7 - - - - 10,400
Land 54.5 - - - - -
Total investment portfolio 3,342.3 5.2% 5.0% 5.4 100% 1,117,750
Portfolio revaluation $m
1H FY21
Stabilised 129.9
Developments 7.4
Land 2.9
Total investment portfolio 140.2
1 Includes right of use assets in respect of ground leases of $65.6m
2 Excludes M20 9,000
22Goodman Property Trust Interim Result 2021 Development programme El Kobar Units, Highbrook Business Park 23
Goodman Property Trust Interim Result 2021
Completed developments
GMT saw minimal disruption to its construction timetable due to
COVID-19, completing two projects totalling 12,895 sqm since
31 March 2020
7,401 sqm extension developed on a pre-committed basis
for OfficeMax
Savill Drive Units (5,493 sqm) developed on a build-to-lease
basis and was 100% leased prior to completion
Completed development metrics
FY21
% leased 100%
Average WALE 11.7 years
Yield on cost 6.1%
Yield on additional cost 8.6%
Cap rate on completion 4.7%
24Goodman Property Trust Interim Result 2021
Current development programme
Work-in-progress summary
Estate
Total project cost Lettable area Expected
Leased Current development programme consists of 30,649
$m sqm completion date1
sqm across six projects at Highbrook, Westney and
Highbrook 33.4 8,676 Feb-21 47%
M20 business parks
Westney 16.4 8,391 Nov-20 46%
M20 37.9 13,582 2H FY22 32% Two previously announced build-to-lease (speculative)
Total work-in-progress 87.7 30,649 41% developments were paused prior to construction
commencement with minimal spend
Paused developments 26.1 10,400 TBC -
Total 113.8 41,049 18% Recommencing paused 9,000 sqm build-to-lease
facility at M20 with completion forecast for 2H FY22
Exposure to build-to-lease product remains low,
Leasing exposure
equivalent to 1.7% of GMT portfolio
Developments (excluding paused) sqm
Currently under construction 30,649
Uncommitted 18,860
Total GMT portfolio 1,117,750
Exposure 1.7%
1 Last completion date of current work in progress
25Goodman Property Trust Interim Result 2021
Work-in-progress
Waiouru Point, Highbrook Business Park 4,416 sqm Westney 4,500, Westney Industry Park 4,970 sqm
M20 9,000, M20 Business Park 9,630 sqm 68 Westney Road, Westney Industry Park 3,421 sqm
26Goodman Property Trust Interim Result 2021 Outlook M20 Business Park 27
Goodman Property Trust Interim Result 2021
Outlook
The COVID-19 pandemic has changed the global landscape and is causing a rapid and pronounced change in the way
we live, work, and consume
Recent events have highlighted the important role a secure and efficient supply chain plays in the orderly functioning of a
modern economy
With consumer behaviour and structural changes driving the growth in online retail, customer demand for well-located
distribution and logistics space has continued to support the Trust’s portfolio fundamentals and targeted development
activity
Our long-term strategy to own properties in strategic infill locations that are close to consumers remains
While the economic outlook remains uncertain, the quality and scale of the portfolio, together with the low level of gearing
and targeted investment strategy gives us confidence that the Trust remains well positioned for sustainable long-term
growth
While we remain cautious about the balance of FY21, the improved business outlook has resulted in an increase of full
year cash earnings guidance to 6.3 cpu1 (previously 6.2 cpu)
1 Operating earnings adjusted for interest capitalised on land, maintenance capex and capitalised management fees on land
28Goodman Property Trust Interim Result 2021 Questions Savill Link 29
Goodman Property Trust Interim Result 2021

Thank
you

Disclaimer: The information and opinions in this presentation were prepared by Goodman (NZ) Limited on behalf of Goodman Property Trust and its subsidiaries (Goodman).
Goodman makes no representation or warranty as to the accuracy or completeness of the information in this presentation.
Opinions including estimates and projections in this presentation constitute the current judgment of Goodman as at the date of this presentation. They are subject to change without notice. Such opinions are not guarantees or predictions of future performance, and involve known and
unknown risks, uncertainties and other factors, many of which are beyond Goodman’s control, and which may cause actual results to differ materially from those expressed in this presentation.
Goodman undertakes no obligation to update any information or opinions whether as a result of new information, future events or otherwise.
This presentation is provided for information purposes only.
No contract or other legal obligations shall arise between Goodman and any recipient of this presentation.
Neither Goodman, nor any of its Board members, officers, employees, advisers or other representatives will be liable (in contract or tort, including negligence, or otherwise) for any direct or indirect damage, loss or cost (including legal costs) incurred or suffered by any recipient of this
presentation or other person in connection with this presentation.

                                                                                                                                                                                                                                                                                                       30
Goodman Property Trust Interim Result 2021 Appendix Highbrook Drive, Highbrook Business Park 31
Goodman Property Trust Interim Result 2021

Work-in-progress
                                                                                                                  Total project   Lettable
                                                                                                                                             Completion
     Development                             Address                                                     Estate           cost        area                Leased
                                                                                                                                                   date
                                                                                                                            $m        sqm

     68 Westney Road                         68 Westney Road, Mangere                    Westney Industry Park            6.6      3,421       Oct-20     100%
     Waiouru Point                           4-6 Waiouru Road, East Tamaki             Highbrook Business Park           15.1      4,416       Nov-20     100%
     Westney 4,500                           14 Timberly Road, Mangere                   Westney Industry Park            9.8      4,970       Nov-20       0%
     Ingram Micro Expansion                  25 Falcon Road, Manukau                        M20 Business Park            12.8      3,952       Dec-20     100%
                                             67 Business Parade South & 14 Sir Woolf
     Crossing Units                                                                    Highbrook Business Park           18.3      4,260       Feb-21       0%
                                             Fisher Drive, East Tamaki
     M20 9,000                               70 Plunket Avenue, Manukau                     M20 Business Park            25.0      9,630     2H FY22        0%
     Total work-in-progress                                                                                              87.7     30,649                   41%
     El Kobar 10,000                         20 El Kobar Drive, East Tamaki            Highbrook Business Park           26.1     10,400                    0%

     Total paused developments                                                                                           26.1     10,400                    0%
     Total                                                                                                             113.8      41,049                   18%

                                                                                                                                                                   32
Goodman Property Trust Interim Result 2021
Completed developments
OfficeMax Expansion
Estate Highbrook Business Park
Completion September 2020
NLA 7,401 sqm
Savill Drive Units
Estate Savill Link
Completion May 2020
Area 5,493 sqm
33Goodman Property Trust Interim Result 2021
Profit or loss
34Goodman Property Trust Interim Result 2021
Balance sheet
35Goodman Property Trust Interim Result 2021
Cash flows
36You can also read