INTERIM RESULTS 2019 Six months ended 30 June 2019

Page created by Jared Baker
 
CONTINUE READING
INTERIM RESULTS 2019 Six months ended 30 June 2019
INTERIM RESULTS 2019
 Six months ended 30 June 2019
INTERIM RESULTS 2019 Six months ended 30 June 2019
ANDY PALMER
Group Chief Executive Officer
INTERIM RESULTS 2019 Six months ended 30 June 2019
Agenda

1     H1 2019 Highlights

2     Financial review and guidance

3     Strategic update

4     Q&A

Appendix
INTERIM RESULTS 2019 Six months ended 30 June 2019
Balancing growth and brand positioning
     The external environment remains challenging with increased macro-
     economic uncertainties and we anticipate that this will continue for the
     remainder of the year

     Whilst the short-term wholesale correction is disappointing, retail sales
     have grown by 26% in the first half, with core wholesales up 9%

     Revised guidance: Wholesales: 6,300-6,500; Adjusted EBITDA margin of
     ~20%; and adjusted operating (EBIT) margin of ~8%; Capex: c.£300m

     We have also recognised £19m of doubtful debt provision against the
     sale of legacy Intellectual Property income last year

     We are taking immediate actions to improve efficiency and reduce our
     fixed cost base as we head into 2020

4
INTERIM RESULTS 2019 Six months ended 30 June 2019
H1 2019: Key results and highlights

      Retail unit growth +26%, with increased share of luxury market against backdrop of difficult macro-economic conditions

      Revenue fell to £407m as fewer Specials and core mix (more Vantage) offset growth in wholesale units

      Adjusted EBITDA of £22m due to planned costs of expansion and a £19m provision relating to sale of legacy Intellectual Property

      Deliveries Q4 weighted, including DB4 GT Zagatos; Lower fixed cost run-rate in H2 as marketing costs fall and deliver efficiencies

      DBX on track and pre-production car made its dynamic appearance at Goodwood; St Athan facility now commissioned

      Dynamic reveal of the Aston Martin Valkyrie at Silverstone Grand Prix; Car set to campaign at 24 Hours of Le Mans 2021

5
INTERIM RESULTS 2019 Six months ended 30 June 2019
MARK WILSON
EVP & Chief Financial Officer
INTERIM RESULTS 2019 Six months ended 30 June 2019
Financial KPIs

                 WHOLESALES                                                                      (£m)
                                                                                                                      REVENUE                                                       ADJUSTED LEVERAGE1
    (#)

H1 2019                                2,442                                                    H1 2019                                407                                         30-Jun-19           4.7x

H1 2018                              2,299                                                      H1 2018                                 425                                        30-Jun-18   2.5x

                       CORE ASP                                                                         ADJUSTED EBITDA                                                             (£m)
                                                                                                                                                                                               CAPEX
    (£k)                                                                                         (£m)

H1 2019                               140                                                      H1 2019                22                                                           H1 2019            162

H1 2018                                146                                                     H1 2018                                  106                                        H1 2018            152

           Note: See Appendix for more detail on APMs; (1) 2018 leverage excluding preference shares, converted to ordinary shares at IPO, 2019 LTM adjusted EBITDA excludes the
7          £7m benefit from first time adoption of IFRS 16 in H1 2019
INTERIM RESULTS 2019 Six months ended 30 June 2019
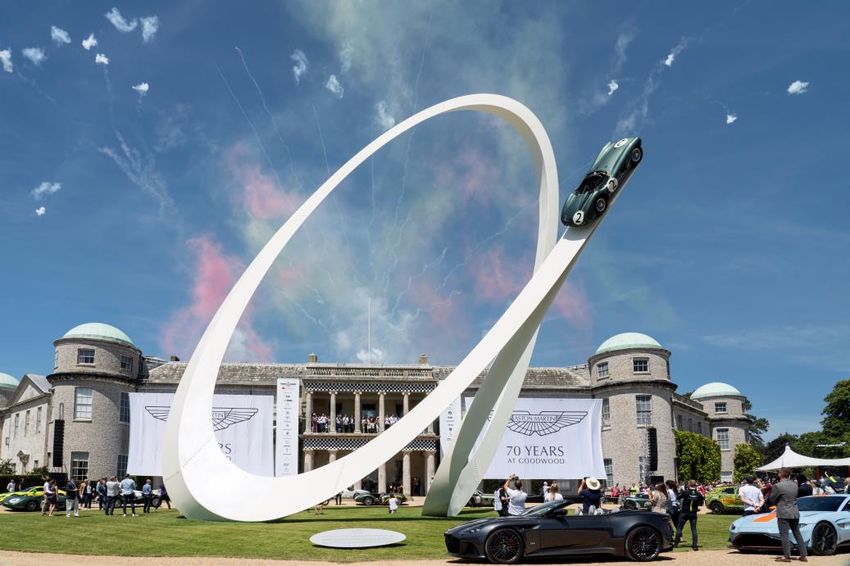
Retails up 26%; Wholesale strength in the Americas and APAC
        Total wholesales by engine
      2,299                        2,442
                 95                          36
                 755                         807                             -17%
                                                           +54%
                                                                                      -19%               +24%
                 1,449                       1,599                                                     China +39%

     H1 2018                   H1 2019
      V8            V12         Specials

              Wholesale ASP (£k)

       167
                                   145
                                                            700     683                                                         687
                                                                           565          607                       555
                                                     454                                         490
       146                         140

     H1 2018                    H1 2019               Americas           UK             EMEA ex.UK                       APAC
          Excl. Specials    Incl. Specials                        H1 2018   H1 2019   Total wholesale growth by region

8
INTERIM RESULTS 2019 Six months ended 30 June 2019
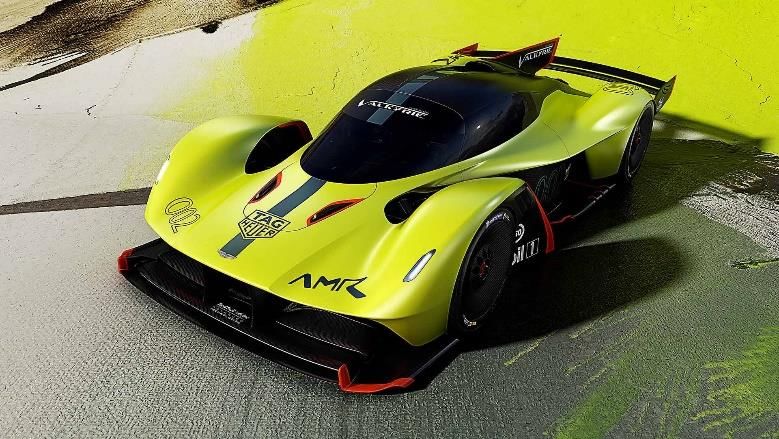
First half revenues lower year-on-year
     (£m)

                                                                                                                         Decline in vehicle sales from
                                                                                                                     1   £385m in H1 2018 to £356m
                                                                                                                         Unit growth offset by lower ASP driven by
                                                                                                                         fewer specials and core mix (more Vantage)

                                                                                                 11
                                                                 2
                                                                                                                         Revenue from the Sale of parts and
                                 (29)                                              (2)                               2   Servicing broadly unchanged
                                                                                                                         Heritage team focus on DB4 GT Zagato
      425                                                                                                                Continuation builds and cars for Bond 25

                                                                                                             407

                                                                                                                         Increase in revenue from Brands
                                                                                                                     3   and motorsport
                                                                                                                         Driven by the sales of Vantage GT3 and GT4
                                                                                                                         sports cars for the endurance racing series

    H1 2018                    Sale of                Sale of parts            Servicing of   Brands and   H1 2019
                              vehicles                                           vehicles     motorsport

     Note: Certain financial data within this presentation have been rounded
9
INTERIM RESULTS 2019 Six months ended 30 June 2019
Profit impacted by Specials mix, planned cost increases and provision
      (£m)
     25%                                20%                                                                                                                 10%                          5%               Adjusted EBIT analysis

                                                                                                                                                                                                                               H1      H1
                                                                                                                                                                                                   £m
                     (20)                                                                                                                                                                                                    2018    2019
                                                            (17)                                     3
     106                                                                                                                                   6                                                       Adjusted EBITDA            106       22
                                          86                                   (17)
                                                                                                                      (19)                                   41                                    D&A                          42      57
                                                                                                                                                                                (19)      22
 H1 2018            Other            H1 2018 Wholesales                        Mix           Non-vehicle         Planned FX, IFRS 16                    H1 2019               Other    H1 2019     Adjusted EBIT                64     (35)
 Adjusted          income             EBITDA                                                                   cost increase & other                     EBITDA              income    Adjusted
  EBITDA                           (excl. Other                                                                                                       (excl. Other                      EBITDA     Adjusted EBIT margin     15.2% (8.6%)
        Margin                       income)                                                                                                            income)

                  Gross profit of £148m with a gross margin of 36% (H1 2018: £180m;                                                                             The net financing expense decreased year-on-year to £41m (H1 2018:
           1      42%), reflecting planned lower number of Specials and core ASP in                                                                    3        £44m), and included the first interest cost for the new bonds issued on 1
                  addition to an improved lease offer                                                                                                           April 2019 and a £7m adjusting finance expense1

                  Operating expenses increased as expected, up 21% to £164m. Higher                                                                             The estimated effective tax rate for the year of c.21%2 has been applied
           2      D&A and planned increases in motorsport, DBX and St Athan, higher                                                                    4        for the half and a tax credit of £16m reflects tax on adjusting items and
                  marketing spend and headcount to support planned growth                                                                                       the loss in the period. Adjusted diluted EPS was negative 24.6p

      Note: See Appendix for more detail on APMs; Certain financial data within this presentation have been rounded; (1) Adjusting items of £9m H1 2019 (£nil H1 2018), see
10    appendix for more details; (2) It is currently anticipated that this rate will apply for the year providing there are no significant changes in legislation and provided the
      geographical contribution to group results stays broadly the same
Cash balance of £127m and net debt increased following bond issue
      (£m)
                           21                                                                                                                                                     144            11                   18
                                               (159)
                                                                       121

                                                                                              (1)
                                                                                                                                                                                                                                          732
     145                                                                                                           127                                560

 Cash balance           Cash     Cash used in Cash inflow Effect of ex. Cash balance                                                           Adj. net debt              Change in the   Increase in loans Reduction in cash        Adj. net debt
  31-Dec-18          generated    investing from financing rates on cash 30-Jun-19                                                              31-Dec-18                    Senior        and overdrafts                             30-Jun-19
                  from operating activities    activities    and cash                                                                                                    Secured Notes
                      activities                            equivalents

                  Cash generated from operating activities impacted by an                                                                                     £121m inflow from financing largely reflects the $190m mirror
           1      inventory build of £71m due to manufacturing at run-rate                                                                            3       bond placement on 1 April, offset by interest payments
                  To support wholesale deliveries expected to be significantly weighted in H2. Also due                                                       Supports flexibility in the investment in portfolio expansion through Phase 3 of the
                  to lower EBITDA year-on-year reflecting ongoing planned cost increases and mix                                                              Plan

                  Capex higher year-on-year at £162m1 (H1 2018: £152m)                                                                                        Net debt increased to £732m2 from £560m at year end
           2      primarily due to timing of near-term product launches                                                                               4       resulting in adjusted leverage of 4.7x3 LTM EBITDA
                  Capex for 2019 now re-phased to c.£300m with a focus on 2019 and 2020                                                                       Cash balance increased by £55m as at 30-Jun-18 (£72m), noting seasonality of
                  programmes                                                                                                                                  cashflows

      Note: See Appendix for more detail on APMs; Certain financial data within this presentation have been rounded; (1) Cash used in investing activities also includes an
11    inflow of £3.2m from interest received; (2) Excluding IRFS 16 adjustment; Net debt including £112m lease liabilities as per IFRS 16 first time adoption is £844m; (3) LTM
      adjusted EBITDA excludes the £7m benefit from first time adoption of IFRS 16 in H1 2019
FY 2019 revised outlook
       2019 guidance (ex. adjusting Brexit costs)

                             Wholesales                                       6,300 – 6,500

                   Adjusted EBITDA margin                                            ~20%

                     Adjusted EBIT margin                                             ~8%

                           Interest cost1                                           ~£70m

                                  D&A                                              ~£140m

                        Effective tax rate                                           ~21%

                         Capex and R&D                                             ~£300m

     Note: See Appendix for more detail on APMs; (1) Including the £7m adjusting financing expense in H1 2019 (previously £63m)
12
ANDY PALMER
Group Chief Executive Officer
Second Century Plan – firmly in Phase 3, Portfolio Expansion

        1
 S TA B I L I S AT I O N
                                          2
                                         CORE
                                    STRENGTH ENING
                                                                     PORTFOLIO
                                                                              3
                                                                     E X PA N S I O N
                                                                                                           SUSTAINABLE
                                                                                                         LUXURY BUSINESS

                                                    3 Pillar Brand Strategy

     Sports & Super Cars (4 cars)                        SUVs (2 cars)                                  Sedan (1 car)

                                              Exclusive and rare Special products

                      THE LOVE OF BEAUTIFUL                                             THE WONDER OF TRAVEL

14
Supplier Performance Management (SPM) activated

     All core suppliers are monitored against key risk criteria, with the SPM
     based around the key measures of:

                 QUALITY
                                                                                 SUPPLIER
                 COST

                 DELIVERY
                                                                                SCORECARD
                 D E V E LO P M E N T

                 MANAGEMENT

15
Continuing to upgrade our dealers, specifically across APAC
                                    Dealership footprint by region                                                    Recent dealer updates
                                                                                                       Hatfield (UK): relocation to new
                                                                                                       purpose built site
                                                                               •     4 openings
                                                                               •     4 terminations

                   44
                                              21

                                                         55
                                                                                42

                                                                                                       K o b e ( J a p a n ) : 7 th a u t h o r i s e d
                                                                                                       dealership in Japan

     Medium-term dealer footprint
             250 dealerships
           Aston Martin: 200
           Lagonda: 50                                               Number of dealerships by region

16
Strengthening core sports cars
                  DBS Superleggera                                         Vantage

DBS Superleggera Volante                     Va n t a g e A M R a n d ’ 5 9 E d i t i o n ’

 ‘Her Majesty’s               ’59 Edition’   ‘GT3 / GT4’                             ‘ Va n t a g e H e r i t a g e
 Service’                                                                            Racing Editions’

17
Update on the DBX and St Athan
                               2019                                           2020
         Q1             Q2               Q3            Q4          Q1                Q2
                         1PT Build                     2PT Build        3PT               SOP
M1 Physical Testing & Validation

                             1PT Physical Validation

     •   Initial prototype (M1) extensively tested in multiple locations

     •   St Athan has now completed commissioning to enable start-to-finish assembly of
         the first production trial (1PT) cars

     •   1PT cars now undergoing extensive dynamic testing, with the first public showing
         at the Goodwood Festival of Speed

     •   Over 220 employees now based at St Athan, including the 90 technicians who
         trained in Gaydon over the last two years and are now building the 1PT fleet

18
DBX “Take To Market” strategy

                                                                                                                               REGIONAL
     CUSTOMER                                              TEASE & DBX                                        GLOBAL                                    STA R T O F
                                                                                                                              MARKETING
      CLINICS                                             CONFIDENTIAL                                        LAUNCH                                  PRODUCTION
                                                                                                                              C A M PA I GN S

Ongoing                                    From Pebble Beach                                  December 2019            Throughout Q1 2020       Q2 2020

             Customer clinic responses – initial impression of DBX
                       U.S.                                                                    China

                             Strong
                            interest,                                                              Strong
                              64%                                                                 interest,
                                                                                                    68%

     Sources: AML customer clinics in the U.S. and China vs three other competitor products
19   Note: Strong interest relates to a score of 8, 9 or 10/10 after assessment of product
Mid-engined bloodline
                                      A s t o n M a r t i n Va l k y r i e ( S p ec i a l )   A s t o n M a r t i n Va l h a l l a ( S p e c i a l )
Aston Martin Red
Bull Racing

                                      •   Made its dynamic debut at the British Grand Prix    •   Limited to 500 coupes, and oversubscribed
                                      •   Fully sold out, first delivery Q4 2019              •   To feature Aston Martin hybrid V6 turbo engine

                                      A s t o n M a r t i n Va l k y r i e A M R              Va n q u i s h V i s i o n C o n c e p t
                                      Pro (Special)                                           (Core)

•    Initiates partnership with Red   •   Track only version of Aston Martin Valkyrie         •   Aston Martin’s first mid-engined core car
     Bull Advanced Technologies       •   Fully sold out                                      •   To feature Aston Martin hybrid V6 turbo engine

20
British Grand Prix – Silverstone

     Key brand events

“Bond 25”

                        Goodwood Festival of Speed

21
A global luxury business with a disciplined approach to growth
      Retail and wholesale growth but performance impacted       DBX remains on track, with dynamic appearance at
      by weakness in the UK and EMEA and continued macro-        Goodwood and extremely encouraging feedback from
      economic uncertainty                                       customer clinics; St Athan facility now commissioned

      To protect the brand positing we have reduced our          Encouraged by demand for Specials as development of
      wholesale guidance for FY 2019 and are taking actions to   the Aston Martin Valkyrie continues and we manage the
      improve efficiency                                         excess customer demand for Valhalla

22
Q&A
AML is optimally positioned to capture the luxury SUV opportunity
        SUV segment continues to exhibit robust growth and market share                                                                                                            Significant cross-sell opportunity
 Global SUV sales (units)

     1,000,000
                                                                                                                                         +30%                                                       Proportion of comparable
                                                                                                                                                                                                    Aston Martin owners who
                                                                                                                                                                                                       already own an SUV
      975,000
                                                                                                                                          +5%                                          67%

      950,000                                                                                                                                                                     Conservative and achievable target
                                                                                                                                                                                            ~7%
      925,000
                                                                                                                                                                                                      Global high luxury and
                                                                                                                                                                                                      premium performance
      900,000                                                                                                                                                                                        SUV target market share
             2019 2020 2021 2022 2023 2024 2025 2026 2027 2028 2029 2030                                                                                                                                 of ~7% by 2022

                                             Premium SUV                  High Luxury SUV

        Source: IHS Markit Global Automotive Outlook, Wealth-X report 2017, Capgemini World Wealth Report 2017, Global Economic Prospects 2018 (World Bank Group); Luxury Goods
24      Worldwide Market Study 2016 (Bain & Company), IHS Market Global Automotive Outlook for SUV market share and addressable market; Company information
Specials continue to be an important component of our strategy
                                        H1 2019                                          H2 2019                                         H1 2020                               H2 2020              2021                    2022+
Contemporary

                          Vanquish Zagato Shooting Brake                                                                                                             DBS GT Zagato (19)
                          (99)

                                                                           DB4 GT Zagato Continuation                                                Goldfinger DB5 Continuation
Heritage

                                                                           (19)                                                                      (25)

                                                                                                                                                                      Aston Martin Valkyrie (150)    Aston Martin Valkyrie AMR Pro
                                                                                                                                                                                                     (25)
Mid-engine / Electric

                                                                                                                                                                   Rapide E (155)                    Aston Martin Valhalla (500
                                                                                                                                                                                                     Coupes)

                        Note: Total number of units sold across the life of the Special shown in brackets, excluding prototypes which may also be sold
25
Income Statement, Cash Flow and Balance Sheet
     £m                                                                                       H1 2019                  H1 2018                       £m                                                   H1 2019    FY 2018     H1 2018
     Revenue                                                                                     407.1                    424.9                      Cash generated from operating activities                 20.8      222.6        62.0
     Cost of sales                                                                             (259.2)                  (244.5)                      Cash used in investing activities                     (159.0)    (306.3)     (150.1)
     Gross profit                                                                                147.9                    180.4
                                                                                                                                                     Cash inflow / (outflow) from financing activities       121.0       57.8       (7.2)
       Gross margin                                                                             36.3%                    42.5%
                                                                                                                                                     Effect of exchange rates on cash and cash
     Operating expenses1                                                                       (164.1)                  (136.0)                                                                              (0.5)       2.7        (1.0)
                                                                                                                                                     equivalents
           of which depreciation & amortisation                                                    57.2                    41.5
     Other (expense) / income                                                                    (19.0)                    20.0                      Decrease in net cash                                   (17.7)     (23.2)      (96.3)
     Adjusted operating (loss) / profit                                                          (35.2)                    64.4                      Cash balance                                           126.9      144.6         71.5
           Adjusted operating margin                                                            (8.6%)                   15.2%                       Borrowings                                             858.9      704.1        886.9
     Adjusting operating items                                                                    (2.5)                        -                     Preference share adjustment3                                -          -     (276.6)
     Operating (loss) / profit                                                                   (37.7)                    64.4                      Net debt4                                              732.0      559.5        538.8
     Net financing expense                                                                       (41.1)                  (43.6)                      Adjusted EBITDA LTM5                                   156.7      247.3        219.3
           of which adjusting financing items                                                     (6.6)                      0.0                     Adjusted Leverage                                        4.7x       2.3x        2.5x
     (Loss) / profit before tax                                                                  (78.8)                    20.8
     Taxation                                                                                      16.0                    (9.3)
                                                                                                                                                     £m                                                  30-Jun-19 31-Dec-18    30-Jun-18
     Reported net income                                                                         (62.8)                    11.5
                                                                                                                                                     Non current assets                                    1,601.6   1,418.6      1,299.5
                                                                                                                                                     Current assets                                          571.3     551.6        437.4
     Adjusted EBITDA                                                                               22.0                   105.9
      Adjusted EBITDA margin                                                                      5.4%                    24.9%                      Total assets                                          2,172.9   1,970.2      1,736.9
     Adjusted (loss) / profit before tax                                                         (69.7)                    20.8                      Current liabilities                                     861.3     790.3        592.9
                                                                                                                                                     Non current liabilities                                 923.1     730.5        990.8
     EPS (pence)2                                                                                (28.0)                        4.3                   Total liabilities                                     1,784.4   1,520.8      1,583.7
     Adjusted EPS (pence)2                                                                       (24.6)                        4.3                   Total equity                                            388.5     449.4        153.2

     Note: See Appendix for more detail on APMs and adjusting items; (1) Excludes adjusting items; (2) EPS is presented on a diluted basis; (3) Preference shares, which were
26   converted into ordinary shares at IPO, are included in borrowings in 2018; (4) Excluding IRFS 16 adjustment; Net debt including £112m lease liabilities as per IFRS 16 first
     time adoption is £844m; (5) LTM adjusted EBITDA excludes the £7m benefit from first time adoption of IFRS 16 in H1 2019
Summary Q1 / Q2 financials
£m                                                                                                          Q1-19                          Q1-18                          Q2-19        Q2-18    H1-19      H1-18
                                  1
Total wholesale volumes                                                                                      1,057                           963                          1,385        1,336     2,442     2,299
Revenue2                                                                                                     196.0                         185.4                          211.1        239.5     407.1     424.9
Gross profit                                                                                                  82.6                          82.3                            65.3        98.1     147.9     180.4
 Gross margin                                                                                               42.1%                          44.4%                          30.9%        41.0%    36.3%      42.5%
Adjusted EBITDA                                                                                               28.3                          43.7                           (6.3)        62.2       22.0    105.9
 Adjusted EBITDA margin                                                                                     14.4%                          23.6%                         (3.0%)        26.0%      5.4%     24.9%
Adjusted operating (loss) / profit                                                                            (2.2)                         22.0                          (33.0)        42.4     (35.2)     64.4
 Adjusted operating profit margin                                                                           (1.1%)                         11.9%                        (15.6%)        17.7%    (8.6%)     15.2%

Adjusting operating items                                                                                    (1.0)                               -                          (1.5)          -      (2.5)         -
Adjusting financing items                                                                                   (8.0)3                               -                            1.4          -      (6.6)         -
Operating (loss) / profit                                                                                    (3.2)                            22.0                         (34.5)       42.4     (37.7)      64.4
(Loss) / profit before tax                                                                                 (25.3)3                             2.8                         (53.5)       18.0     (78.8)      20.8

£m                                                                                                          Q1-19                          Q1-18                          Q2-19        Q2-18     H1-19      H1-18
Cash generated from operating activities                                                                      46.6                           10.0                         (25.8)         52.0      20.8       62.0
Cash used in investing activities                                                                           (76.3)                         (87.2)                         (82.7)       (62.9)   (159.0)    (150.1)
Cash inflow / (outlow) from financing activities                                                              14.6                            6.9                         106.4        (14.1)     121.0      (7.2)
Effect of exchange rates on cash and cash equivalents                                                        (1.7)                          (1.8)                            1.2          0.8      (0.5)     (1.0)
Decrease in net cash                                                                                        (16.8)                         (72.1)                          (0.9)       (24.2)    (17.7)     (96.3)
Cash balance                                                                                                127.8                            95.7                         126.9          71.5     126.9       71.5

      Note: See Appendix for more detail on APMs and adjusting items; (1) Number of vehicles includes specials; (2) 2018 excludes £20m reclassification; (3) Restated to reflect the
27    charge recognised in relation to hedge ineffectiveness on FX forwards – see note 4 of the Interim Financial Statements
Non-GAAP reconciliation and adjusting items
       Income Statement reconciliation                           Adjusting items

     £m                                  H1 2019    H1 2018    £m                                                 H1 2019    H1 2018

     (Loss) / profit for the period        (78.8)      20.8    Staff incentives                                      (2.0)         -

     Adjusting operating expenses            2.5           -   Professional fees                                     (0.5)         -

     Adjusting finance expenses              6.6           -   Adjusting operating items                             (2.5)         -
                                                               Movement on derivatives not qualifying for hedge
     Adjusted EBT                          (69.7)      20.8                                                          (6.6)         -
                                                               accounting
     Adjusted finance (income)              (3.2)      (2.3)   Adjusted finance expenses                             (6.6)         -

     Adjusted finance expense               37.7       45.9    Total adjusting items                                 (9.1)         -

     Adjusted EBIT                         (35.2)      64.4

     Reported depreciation                  24.7       12.9

     Reported amortisation                  32.5       28.6

     Adjusted EBITDA                        22.0      105.9

28
Alternative Performance Measures
     All metrics and commentary in this presentation exclude adjusting items unless stated otherwise.

     Certain financial data within this presentation have been rounded.

     In the reporting of financial information, the Directors have adopted various Alternative Performance Measures ("APMs"). APMs should be considered in
     addition to IFRS measurements. The Directors believe that these APMs assist in providing useful information on the underlying performance of the Group,
     enhance the comparability of information between reporting periods, and are used internally by the Directors to measure the Group's performance.

     The key APMs that the Group focuses on are as follows:

     i.   Adjusted EBT is the (loss) / profit before tax and adjusting items (note 4) as shown in the Consolidated Income Statement.

     ii. Adjusted EBIT is operating (loss) / profit before adjusting items.

     iii. Adjusted EBITDA removes depreciation, loss / (profit) on sale of fixed assets and amortisation from adjusted EBIT.

     iv. Adjusted Earnings Per Share is (loss) / profit after income tax before adjusting items as shown in the Consolidated Income Statement, divided by the
         weighted average number of ordinary shares in issue during the reporting period.
     v.   Net Debt is current and non-current borrowings less cash and cash equivalents, excluding any impact of IFRS 16, as shown in the Consolidated
          Statement of Financial Position.

     vi. Adjusted leverage is represented by the ratio of Net Debt, adjusted for Preference Shares, to the last 12 months (“LTM”) adjusted EBITDA excluding any
         benefit from the first time adoption of IFRS 16

29
Disclaimer

 This presentation has been prepared by Aston Martin Lagonda Global Holdings plc (“AML”) solely for use at the investor meeting being held on
 Wednesday, July 31, 2019 in connection with a discussion of its interim 2019 results. For purposes of this notice, this “presentation” shall include
 these slides and any question-and-answer session that follows oral briefings by AML’s executives. This presentation is for informational purposes only
 does not constitute an offer to sell or the solicitation of an offer to buy AML securities. Furthermore, this presentation does not constitute a
 recommendation to sell or buy AML securities.
 No representations or warranties, express or implied, are made as to, and no reliance should be placed on, the accuracy, fairness or completeness of
 the information presented or contained in this presentation. This presentation contains certain forward-looking statements, which are based on
 current assumptions and estimates by the management of AML. Past performance cannot be relied upon as a guide to future performance and should
 not be taken as a representation that trends or activities underlying past performance will continue in the future. Such statements are subject to
 numerous risks and uncertainties that could cause actual results to differ materially from any expected future results in forward-looking statements.
 These risks may include, for example, changes in the global economic situation, and changes affecting individual markets and exchange rates. AML
 provides no guarantee that future development and future results actually achieved will correspond to the forward-looking statements included here
 and accepts no liability if they should fail to do so. We undertake no obligation to update these forward-looking statements, which speak only as at
 the date of this presentation and will not publicly release any revisions that may be made to these forward-looking statements, which may result from
 events or circumstances arising after the date of this presentation. This presentation is confidential and is being delivered to selected recipients only. It
 may not be reproduced (in whole or in part), distributed or transmitted to any other person. By attending the meeting at which this presentation is
 being given, you will be deemed to have represented, warranted and undertaken that you have read and agree to comply with the contents of this
 notice.

30
Aston Martin Lagonda Investor Relations Team

        www.astonmartinlagonda.com

Charlotte Cowley, Director of Investor Relations
          Tel: +44 (0)7771 976764
  Email: charlotte.cowley@astonmartin.com

        Alice Walker, Investor Relations
          Tel: +44 (0)7734 780716
    Email: alice.walker@astonmartin.com
You can also read