Interim results for the period ended 31 August 2021 - Johannesburg Stock Exchange
←
→
Page content transcription
If your browser does not render page correctly, please read the page content below
Interim results for the period ended 31 August 2021
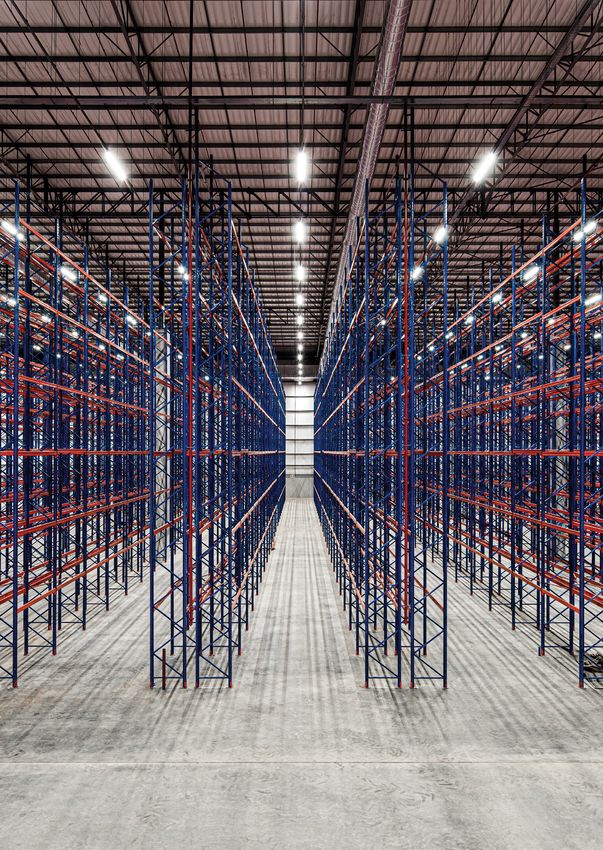
Contents
Interim results for the period ended 31 August 2021

Commentary                                                  1
Condensed consolidated statement of financial position     20
Condensed consolidated statement of comprehensive income   21
Condensed consolidated statement of cash flows             22
Condensed consolidated statement of changes in equity      23
Selected explanatory notes to the results                  24
Appendix 1 – Distributable earnings                        31
Appendix 2 – SA REIT disclosure                            33
Glossary                                                   36
Administration                                             IBC

Highlights
Distribution per share

78.38 cents
Weighted average lease expiry

14.7 years
Loan-to-value

28.6%

Front cover: Equites Park – Riverfields, Gauteng.
Inside front cover: Equites Park – Meadowview, Gauteng.
Equites Property Fund Limited
                                                                                                        Interim results for the period ended 31 August 2021   1

Commentary

     Highlights

     –	Distribution per share (“DPS”) of 78.38 cents, an increase of 5.3% compared to the prior comparable period

     –	Loan-to-value (“LTV”) ratio of 28.6%, demonstrating a conservative capital structure

     –	Net asset value (“NAV”) per share increased by 2.2% from R17.25 to R17.63, supported by uplifts on UK developments

     –	Like-for-like (“LfL”) portfolio valuation uplift in the UK was 5.1% in sterling

     –	LfL property valuations in SA were flat for the period

     –	LfL net property income growth was 7.5% in SA

     –	Average rental collection rates were 99.6% and 100% in SA and the UK, respectively

     –	Overall logistics portfolio vacancy rate of 0.8%

     –	Raised R1.3 billion in equity during the period under review

     –	Issued a R300 million floating rate note at an exceptional margin of 3-month JIBAR plus 165bp

     –	The distribution policy remains unchanged at a 100% pay-out ratio

     – Solar plant output capacity reached 980 MWh at Aug-21 compared to 89 MWh at Aug-20

1.   Six months in review
     Equites continues to benefit from the outperformance of the logistics property market globally; with supply chain optimisation, the growth in
     e-commerce and the consumers’ requirements for faster fulfilment driving strong occupier demand for warehousing space.

     These global trends continue to reflect in the Group’s results, with DPS and NAV per share exceeding pre-COVID-19 levels. Equites continues
     to enjoy access to equity markets and raised R1.3 billion in equity over the last six months; this resulted in an LTV ratio of 28.6% at 31 August
     2021. The Group refinanced over R1.2 billion of debt facilities during the period, with more than 60% of debt maturing after February 2024,
     resulting in a weighted average debt maturity of 3.0 years. Equites issued a R300 million 3-year floating rate note off the recently updated
     Domestic Medium Term Note (“DMTN”) Programme at an exceptional margin of 3-month JIBAR plus 165bp.

     The strong performance over the last six months is underpinned by resilient property portfolios in SA and the UK, which was further
     enhanced by the attractive development pipeline of logistics properties in the top-end of the UK logistics market.

     In SA, the bulk of Equites’ tenants are operationally strong after facing an uncertain and challenging 2020. This is especially true for large
     listed and multinational tenants including Shoprite, Simba, The Foschini Group (“TFG”), Nestlé, DSV and Digistics. The Group has recovered
     all rent deferrals due, in line with payment arrangements made with each respective tenant, with no arrears noted. The civil unrest which
     plagued SA in July 2021 only impacted one property in the portfolio, with damages estimated to be less than R1 million, which is fully
     recoverable under Sasria.

     The UK portfolio delivered a 100% rental collection rate and a 5.1% uplift in value over the six-month period, in sterling. Equites Newlands
     Group Limited (“ENGL”), the venture with Newlands Property Developments LLP (“Newlands”), has started to deliver on its promised value
     creation. Equites’ first logistics facility developed by ENGL reached practical completion on 15 September 2021. The total development cost
     is £35 million (R694 million) and the property will be leased to Amazon on a 15-year lease. The development for Hermes is progressing well
     and is on track to be completed in February 2022, with a total development cost of £72 million (R1.4 billion). The combined valuation uplift
     on these two developments is estimated to be in excess of R500 million, creating significant value to Equites shareholders.

     The Group is on track to deliver on its DPS guidance of 5% to 6% growth for FY22, in conjunction with strong growth in NAV per share,
     whilst distributing 100% of its distributable earnings.
2 Equites Property Fund Limited
Interim results for the period ended 31 August 2021
Commentary continued
Equites Property Fund Limited and its subsidiaries for the period ended 31 August 2021
2. Overview of UK logistics market
The occupier market in the UK logistics market has reached an all-time high, with online retailers and third-party logistic companies jostling
for space to expand their logistics networks and bolster their fulfilment capabilities. With the structural changes supporting the demand for
logistics assets, the take-up of warehousing space is now 50% higher than pre-COVID-19 levels. The ferocious demand for warehousing
space has driven supply to decrease at its fastest pace on record, with the national vacancy rate decreasing from 6.6% to 4.4%. This clearly
demonstrates that recent demand has run ahead of supply.
The consequence of the demand-supply dynamic evident in the UK market, is an increase in market rental growth, with national market
rents estimated to grow by between 5% and 7% for 2021. The surge in global demand for raw materials following prolonged COVID-19
lockdowns has also given rise to construction inflation, which further supports market rental growth. Given the demand for construction
materials, UK developers have struggled to source sufficient cladding, steel and concrete, which has driven an increase in the average cost to
construct a warehouse. A clear example is structural steel prices, which have increased by more than 30% over the last 18 months.
Average land prices in England have demonstrated an annual increase of 40%, adding significantly to the total cost of developments. Higher
land prices have been supported by the yield compression in the market, which has increased property values and sustains an attractive
development margin on new developments. Whilst the demand for space remains high, developers are able to pass along construction
inflation to tenants in the form of higher rentals.
The prime yield for UK logistics properties compressed by 75bp over the last 12 months, from 4.0% to 3.25%, supported by strong investor
appetite. Capital invested into the UK industrial and logistics market totalled a record £6.0 billion in H1 2021; this is more than double the
£2.7 billion recorded in H1 2020.
Equites is well-positioned to benefit from the UK market dynamics via ENGL, which will enhance the performance of the Group significantly
over the medium- to long-term.
3. Overview of SA logistics market
In SA, a more resilient local economy continued to exceed expectations, with Q2 2021 GDP growth of 1.2% (q/q) slightly ahead of
expectations of 0.7% (q/q). A surge in metal exports drove SA into a very robust trade surplus for H1 2021. However, the uncertainty around
SA’s path to recovery from COVID-19, coupled with the recent civil unrest and record levels of unemployment, points to a low-growth
environment for SA over the medium-term.
Despite the structural weaknesses in the economy, the SA logistics market has proved its defensiveness over the last 18 months as tenants
focus on supply chain optimisation and enhancing their e-commerce capabilities. The demand for A-grade warehousing space remains
robust in SA, which is evident from numerous national and multinational tenants expanding their warehousing footprint — this includes DSV,
Shoprite, Massmart, Takealot, Pick n Pay and TFG.
The paradigm shift from brick-and-mortar to online shopping is gaining momentum in SA, with numerous retailers recently doubling their
online sales. According to World Wide Worx, online sales as a percentage of total retail sales was 2.8% in 2020 (c.R30 billion), with
expectations that this could reach 5% of total retail sales in 2022 (c.R54 billion). The 2021 South African Digital Customer Experience Report
estimates that SA’s e-commerce market could double from 2.8% to 5.6%, if e-tailers improved shoppers’ issues around their online customer
experience, which includes e-tailers’ trustworthiness, ease-of-use, security, delivery and after-sales support.
Equites is of the view that the focus on supply chain optimisation and growth in e-commerce will be strong tailwinds to SA’s logistics
property market in future.Equites Property Fund Limited
Interim results for the period ended 31 August 2021 3
4. Operational update
4.1 Tenant engagement during COVID-19 and rental relief
Equites proactively engaged with every single tenant during 2020 to understand their immediate and long-term business needs during the
pandemic and to ascertain how the Group could assist in ensuring the sustainability of their operations. For the majority of tenants, the
immediate concern was their cash flow requirements for the duration of the lockdown. Following these engagements, Equites offered
deferred rental arrangements to 31 tenants (29 in SA and 2 in the UK). The arrangements constituted short-term cash flow relief over a
period of approximately three months. The majority of the repayments were to be made within 12 months, with a few being extended over
the remaining term of the lease.
The short-term rental deferrals in SA, which amounted to R24 million, have mostly been recovered in full with R1.2 million to be recovered
in the next three months. Long-term rental deferrals granted to tenants in SA amounted to R13 million, with only R5 million outstanding, to
be fully recovered over the remaining term of the respective leases. In the UK, R0.9 million (£43 750) of rental relief is outstanding from a
single tenant, to be recovered by January 2022. Additional rental relief has been granted during the current period, amounting to
R1.5 million, to two C-grade tenants in SA.
The average rental collection rates over the period have been 99.6% in SA and 100% in the UK. This is testament to a resilient property
portfolio that comprises of 97% A-grade tenants.
4.2 Civil unrest in SA
The civil unrest in July 2021 had an insignificant impact on Equites’ SA portfolio, as only one property was damaged in KwaZulu-Natal, which
is tenanted by Pick n Pay. The damage to the property was less than R1 million and is fully recoverable from Sasria. In response to the civil
unrest, the Group has increased security at all logistics parks in SA and adopted more innovative security measures, including the use of
artificial intelligence, to respond swiftly and effectively to any threats. The additional security costs attributable to Equites had an insignificant
impact on its distributable earnings.
4.3 Employee health and safety
The Group has made a concerted effort to prioritise the health and wellbeing of its people. Approximately two-thirds of staff have spent the
last 18 months working from home to ensure that the spread of COVID-19 was contained, while fully committing their time and resources to
ensuring that Equites continued to function optimally. Those who returned to the office were provided with additional sanitisers and masks,
and alternative transport arrangements were procured for those who travelled using public transport. To support the country’s drive to
increase vaccination numbers, Equites provided vaccine education to all staff members as well the necessary time away from work to enable
them to receive their vaccines. To date, 84% of employees have received the first dose and the team is well on its way to being a fully
vaccinated workforce.
5. The Group’s financial performance
5.1 Distribution per share
DPS has increased by 5.3% to 78.38 cents compared with 8.0
the corresponding prior interim period of 74.44 cents.
1.3
The key drivers of the movement in DPS were: 7.0
– LfL net rental growth in the SA portfolio of 7.5%
contributed to 4.7% DPS growth, a result of the Group’s 6.0 1.0
-1.1 5.3
robust in-force contractual lease escalation rate and -0.3
5.0 4.7 -0.3
exposure to A-grade tenants.
– The Shoprite transaction, which was concluded in
4.0
November 2020, was effective for the full six-month
%
period, contributing 1.0% to DPS growth. 3.0
– Developments during the period under review, were not
affected by construction interruptions compared to the 2.0
previous comparable period, where construction
activities on developments in SA were suspended for two 1.0
months, resulting in the suspension of capitalised interest
during these months. This resulted in 1.3% DPS growth 0.0
SA LfL core Shoprite Developments UK Decrease Rental Total DPS
for the period under review. portfolio cashflows in LTV discounts growth
– Lower net cash flows received from the UK portfolio due (+7.5% growth)
to the strengthening in the Rand, which had the effect of
a 1.1% decline in DPS.4 Equites Property Fund Limited
Interim results for the period ended 31 August 2021
Commentary continued
Equites Property Fund Limited and its subsidiaries for the period ended 31 August 2021
5. The Group’s financial performance continued
5.2 Net asset value per share
NAV per share increased by 2.2% from R17.25 at 18.2
28 February 2021 to R17.63 at 31 August 2021. NAV per 0.30
share has recovered over the period under review and is
18.0
now above pre-COVID-19 levels. The primary drivers of the 0.08
increase in the NAV per share were: 0.53
17.8
– Progress on the two UK developments, Hermes and -0.27
Amazon, which resulted in a R373 million uplift in value, 17.63
17.6
Rand per share
contributing 3.1% to NAV growth. The developments are -0.26
valued on a percentage completion basis.
17.4
– The UK portfolio’s value increased by 5.1% on a LfL basis,
17.25
supported by the compression of prime distribution
yields in the UK during 2021, in sterling. This resulted in a 17.2
R213 million uplift in value, contributing to 1.7% growth
in NAV per share. 17.0
– Due to the Rand strengthening by 5% against the sterling,
the net foreign exchange impact on the UK asset base, 16.8
debt and derivatives was R187 million, negatively FY21 Hermes and UK assets FX impact on Capital raised Deferred taxes 1H22
Amazon revaluation UK assets at a premium & other
impacting NAV per share by 1.6%. to NAV
– Net deferred tax and other impacts negatively impacted
NAV per share by 1.5%.
5.3 Loan-to-value ratio
The LTV ratio decreased by 2.6% from 31.2% as at 32.0
28 February 2021, to 28.6%, as at 31 August 2021. 31.2
The key factors impacting the Group’s LTV ratio during the 31.0
period under review were:
– An equity raise of R1 billion in July 2021 decreased the 30.0
0.3
LTV ratio by 5%. 0.8
29.0 28.6
– The Group retained R279 million in equity through the 3.5
dividend reinvestment programme (“DRIP”), decreasing -0.8
28.0
the LTV ratio by 1.4%.
%
– The total investment in the UK and SA development 27.0
pipelines was R1.2 billion, increasing the LTV ratio by
4.3%. 26.0 -5.0
25.0
-1.4
24.0
FY21 R1bn DRIP UK SA UK FX UK 1H22
Capital raise Investments Investments impact valuation
upliftsEquites Property Fund Limited
Interim results for the period ended 31 August 2021 5
6. Developments and acquisitions
6.1 SA: Developments and acquisitions
Equites has consistently communicated its strategy of pursuing growth in SA through high-quality acquisitions and developments.
During the period under review, the Group concluded an agreement with Attacq Waterfall Investment Company (“Attacq”) whereby Attacq
will dispose of an undivided half share of the leasehold rights and rental enterprises in respect of two logistics properties being the Amrod
and Massbuild distribution centres (“DCs”), as well as an undivided half share in a development in Waterfall for Cotton On. The weighted
average lease expiry (“WALE”) across all three properties is c.10 years, and the weighted average acquisition yield is 8.5%. The total transaction
consideration is R511 million, which includes the remaining development costs of the Cotton On DC. The Waterfall Logistics Hub is regarded
as one of the pre-eminent logistics parks in SA, and this acquisition will increase Equites’ exposure to this node.
Equites’ in-house development team continues to innovate and push the boundaries to create a unique product offering that is unmatched
in the SA context. All developments are built applying a strict baseline specification which is inspired by global best practice; this remains one
of the Group’s competitive advantages in this space.
During the last six months, Equites completed a distribution campus for Sandvik, a global mining and excavating company. The total
development cost was R293 million and the facility is let to Sandvik on a 10-year triple net lease. This transaction is the second development
agreement concluded at Equites Park, Riverfields. The Group continues to see strong occupier demand in this precinct due to its location on
the R21 and R23 interchange and its close proximity to OR Tambo International Airport. It is expected that this node will continue to attract
development deals of this nature in the future.
In line with the previously communicated strategy of securing high-quality development deals, Equites has secured two development leases
which will be developed on its existing land bank in SA. The first is the extension of the TFG warehouse in Lords View by 16 784m²,
increasing the total GLA of the facility to c.40 000m². The current facility will remain operational throughout the duration of the extension
project, which will result in no “downtime” for TFG. In addition to the increase in the building size, a solar photovoltaic (“PV”) system will be
installed and additional upgrades will be implemented to prepare the facility for an EDGE certification. The latter will significantly boost the
sustainability rating of the existing facility. The total development cost of the extension is estimated to be R198 million, and the lease term will
be 10 years. In addition to the extension, Equites has agreed to a renewal of the existing lease, which will be coterminous with the extension
and expire in 2032.
The second agreement relates to the development of a flagship distribution facility for Cargo Compass SA (Pty) Ltd (“Cargo Compass SA”) in
Jet Park. Cargo Compass SA is one of SA’s largest freight forwarding companies, specialising in exports, imports, warehousing and distribution.
The facility exhibits the Equites standard building specifications and will be fitted with a full solar PV system. The expected development cost
is R256 million with a GLA of 29 188m². The property will be let to Cargo Compass SA on a 10-year triple net lease.
6.2 Update on strategic venture with Newlands in the UK
The investment landscape in the UK logistics property market continues to be frenetic in 2021, as the sheer weight of capital chasing
investment opportunities compressed distribution yields to record levels. With yields for prime logistics facilities continuing to reach
unprecedented lows, it is currently not feasible for Equites to acquire new product in the open market, as the expected total return does not
exceed its hurdle rate (predominantly due to the lower initial yields). Equites’ decision to partner with a best-in-class development team,
Newlands, affords Equites the opportunity to expand in the premium sector of the UK logistics market at a discount to open market values.
The Group estimates the pipeline of development opportunities within ENGL to exceed £800 million (R16 billion) over the next three to five
years, which will provide Equites with an opportunity to build scale in the top-end of the UK logistics market. The pipeline will be focused on
developing modern distribution warehouses on a pre-let basis for blue-chip tenants on long-term leases. ENGL will, however, also fund
turnkey developments on behalf of third parties (built-to-sell developments), with the third parties assuming all financial risks, which will
release cash profits and will not be distributed to shareholders, but will be a key source of equity for new projects and will enhance the
balance sheet.6 Equites Property Fund Limited
Interim results for the period ended 31 August 2021
Commentary continued
Equites Property Fund Limited and its subsidiaries for the period ended 31 August 2021
6. Developments and acquisitions continued
6.2 Update on strategic venture with Newlands in the UK continued
The key transactions to date are summarised below:
Amazon – Peterborough
The Group completed the development of a world-class last-mile DC, which will be let to Amazon on a 15-year triple net, fully repairing and
insuring lease. The lease agreement will afford Equites stable cashflows of £2.1 million (R42 million) per annum, with five-yearly (upward
only) rent reviews, subject to a CPI collar and cap of 1.00% and 3.00%, compounded annually. The total development cost is £35 million
(R694 million) – including the Newlands profit share – which results in Equites effectively taking full control of the asset at a 5.68% yield on
cost. The percentage completion as at 31 August 2021 was 77%, with the remaining construction draws to be settled on completion of the
lease. The DC reached practical completion on 15 September 2021.
Hermes – Hoyland Plot 1
The development for Hermes is on track to be completed in February 2022. The total development cost is estimated to be £72 million
(c. R1.4 billion) and Hermes has signed a 20-year triple net, fully repairing and insuring lease. The lease agreement will afford Equites with
stable cashflows of £3.8 million (R76 million) per annum, with five-yearly (upward only) rent reviews, subject to a Retail Price Index collar
and cap of 2.00% and 4.00%, compounded annually. The percentage completion was 61% as at 31 August 2021.
Turnkey development – Hoyland Plot 2
ENGL entered two agreements, i) a sale of land agreement and ii) a development funding agreement, whereby ENGL will develop two DCs
for Promontoria. Equites’ total funding commitment in respect of the development of the two DCs is approximately £24 million (R492
million) with an expected profit attributable to Equites of c.£6.0 million (R120 million), equating to an ungeared return on invested capital of
25%. The proceeds will be used as equity for further opportunities within ENGL.
6.3 Equites pipeline
The total pipeline of current opportunities is R3.9 billion, with R2 billion of capital expenditure outstanding at the reporting date. The pipeline
will be funded from cash on hand, undrawn debt facilities, debt raised against completed developments, new listed debt instruments and
several equity sources – including dividend reinvestment programmes and the potential sale of a property in the UK.
A summary of current and future projects is presented below:
Equites pipeline Equites Cashflows Est. yield Est. fair value Completion
Amount in R million outlay outstanding on cost yield date
SA developments 824 581
Cargo Compass SA – Jet Park 256 195 8% – 9% 8% – 9% Jul-22
TFG – Lords View 198 145 8% – 9% 8% – 9% Jun-22
Viking – Lords View 108 45 8% – 9% 8% – 9% Mar-22
Site 12 – Meadowview 74 36 8% – 9% 8% – 9% Mar-22
Nioro Plastics – Saxdowne 89 61 8% – 9% 8% – 9% May-22
Cotton On – Waterfall (50% share) 99 99 8.10% 8% – 9% May-22
SA acquisitions 412 412 8.50% 8.50%
Amrod – Waterfall (50% share) 197 197 8.90% 8.90% Oct-21
Massbuild – Waterfall (50% share) 215 215 8.20% 8.20% Oct-21
UK developments – Equites hold 2 139 723 5.44%
Amazon – UK (Peterborough) 694 160 5.68% 4.0% – 4.5% Sep-21
Hermes – UK (Hoyland Plot 1) 1 445 563 5.30% 3.5% – 4.0% Feb-22
Est. profit
UK developments – Turnkey 500 314 to Equites
Hoyland Plot 2 (Barnsley) 500 314 R120 million 3Q22
Grand total of pipeline 3 875 2 030Equites Property Fund Limited
Interim results for the period ended 31 August 2021 7
7. Property valuations
The fair value of the Group’s investment property portfolio (including assets held-for-sale) has increased by 9.5% from R19.3 billion at
28 February 2021 to R21.2 billion at 31 August 2021. The growth is attributable to the increase in the UK valuations, along with the
completion of pre-let developments in SA.
All properties are valued by the Board at every reporting period, primarily using the discounted cash flow method. Other valuation
techniques, such as the income capitalisation method, are considered to ensure the reasonability of values. At 31 August 2021, the Group
externally valued 48 properties, in line with its policy to target externally valuing each property at least once every 18 months. The
assumptions in the external valuations were used as a basis for establishing the reasonability of assumptions used in the Group’s internal
valuations.
The fair value of developments was established using a forward income yield, applying a stage of completion method.
In SA, the COVID-19 pandemic and prevailing macroeconomic climate resulted in the moderation of property valuations at 28 February 2021.
Following a slight recovery in the SA economy and the resilience of the logistics asset class, the Group has seen values remaining steady, with
no further declines reported. Equites externally valued 74% of the SA portfolio at 31 August 2021.
In the UK, valuation yields have reached an all-time low, supported by the structural changes in the logistics space and the demand for the
asset class. Furthermore, higher property values are being supported by strong rental growth in all key logistics nodes in the UK. The Group
externally valued 100% of the UK portfolio at 31 August 2021.
The information presented below is a summary of the significant inputs and resultant values assigned to Equites’ income-producing portfolio:
% of income- Average Discount Exit cap
producing value rate rate
Region Type of property portfolio (R/m²) (%) (%)
Modern distribution centre 66 9 343 12.61 7.65
Logistics campus 19 17 483 13.35 8.17
SA
Cross-docking / Ultra-low coverage 11 12 686 13.05 7.92
Other 4 17 961 13.22 9.74
SA total: 100 11 792 12.85 7.87
Modern distribution centre 47 33 065 n/a1 n/a1
UK
Cross-docking / Ultra-low coverage 53 54 043 n/a1 n/a1
UK total: 100 42 370 n/a n/a
1 As 100% of the UK portfolio was externally valued using an income capitalisation method, a discount rate and an exit capitalisation rate does not apply
As a reasonability test, the Group calculates the implied initial yields based on the outputs of the valuation models. The variance in the
implied average initial yield over the past six months is illustrated below:
Variance in Quantum
Region initial yield (in bp)
SA Increase C 18
UK Decrease D 288 Equites Property Fund Limited
Interim results for the period ended 31 August 2021
Commentary continued
Equites Property Fund Limited and its subsidiaries for the period ended 31 August 2021
8. Equites’ operational performance
8.1 Tenant quality
Based on contractual revenue Based on rentable area
Aug 21 97 21 Aug 21 98 11
Feb 21 95 3 2 Feb 21 96 2 2
Aug 20 95 3 2 Aug 20 90 4 2 4
% %
50 60 70 80 90 100 50 60 70 80 90 100
nA
– Large nationals, large n B – Smaller international n C – Other local tenants n Vacant
listed and government and national tenants and sole proprietors
The Group understands the value of low-risk tenants, which is reflected in the fact that 97.0% of its revenue is derived from A-grade tenants.
This, in conjunction with the long WALE, suggests a high level of income predictability and low risk of tenant default.
Sectoral profile
Based on contractual revenue Based on rentable area
Aug 21 96 4 Aug 21 98 2
Feb 21 95 5 Feb 21 98 2
Aug 20 94 6 Aug 20 95 3 2
% %
50 60 70 80 90 100 50 60 70 80 90 100
n Logistics n Industrial n Office
The Group’s clear focus remains on building a high-quality portfolio of assets focused on the logistics sector. With the structural tailwinds
supporting the asset class, Equites is pleased that 95.8% of its total revenue is derived from logistics real estate.
8.2 Lease longevity
31 August 28 February 31 August
Weighted average lease expiry by revenue (years) 2021 2021 2020
SA – Logistics 15.0 15.6 7.0
SA – Industrial 3.8 4.1 4.5
SA – Office 1.8 — —
14.9 15.5 6.9
UK – Logistics 13.7 15.1 13.7
Weighted average lease expiry 14.7 15.4 10.0
Equites’ WALE of 14.7 years, combined with the quality of its tenants, represents a high degree of income certainty over a sustained period.
This further reduces continuous reletting commissions and decreases the risk of vacancies in the medium-term.Equites Property Fund Limited
Interim results for the period ended 31 August 2021 9
31 August 28 February 31 August
Weighted average escalation by GLA (%) 2021 2021 2020
SA – Logistics 6.5 6.4 7.8
SA – Industrial 8.0 8.0 8.1
SA – Office 7.0 — —
6.5 6.4 7.8
Strong in-force escalations prevail in the Group’s portfolio; this provides it with stable and predictable growth for the duration of the leases.
The weighted average lease escalation is now 6.5% in Equites’ SA portfolio, by GLA. On an income basis, the average SA portfolio escalation
rate is 6.8%. The majority of the UK leases are structured with five year annual rent reviews and not fixed annual escalations.
Lease expiry
Based on contractual revenue Based on rentable area
80 80
71 71
70 66 70
64
60
60 60 57
50 50
40 40
%
%
30 30
20 15 20
12 11 12 13
10 11 10 11
10 7 8 6 7 5 10 7 6 8 6 6 8 7 6
3 1 4 3 2
1 2 1 1 0.1 2
0 0
Aug 21 Feb 21 Aug 20 Aug 21 Feb 21 Aug 20
n Vacant/Monthly n Within 1 year n Within 2 years n Within 3 years n Within 4 years n Within 5 years n Beyond 5 years
8.4% of all rentals expire within two years, with only 1.0% of revenue expiring within the upcoming year. Equites actively engages with all
tenants whose leases are reaching expiry, from 18-24 months prior to the expiry date.
8.3 Geographical profile
Based on contractual revenue Based on rentable area
Aug 21 52 28 2 18 Aug 21 52 34 2 12
Feb 21 48 23 3 26 Feb 21 50 35 3 12
Aug 20 47 20 3 30 Aug 20 49 22 4 25
% %
0 10 20 30 40 50 60 70 80 90 100 0 10 20 30 40 50 60 70 80 90 100
n Gauteng n Western Cape n KwaZulu-Natal n United Kingdom
While the UK portfolio has been steadily increasing in value, the Group is still an SA-focused REIT and continues to focus on growing the SA
portfolio through acquisitions and developments. The largest single geographic concentration is Gauteng, with 51.7% of its portfolio currently
situated in the region. Equites views this region as the hub of SA logistics and will continue to focus its growth efforts there.10 Equites Property Fund Limited
Interim results for the period ended 31 August 2021
Commentary continued
Equites Property Fund Limited and its subsidiaries for the period ended 31 August 2021
8. Equites’ operational performance continued
8.4 Vacancy
31 August 28 February 31 August
Vacancy profile 2021 2021 2020
Logistics 0.8% 0.1% 1.9%
Office 50.7% — 100.0%
1.0% 0.1% 3.8%
Equites’ logistics vacancy rate increased marginally from 0.1% as at 28 February 2021 to 0.8%, as at August 2021. The increase in the vacancy
rate relates to a small speculative development that reached completion during the period. The Group expects to conclude a lease agreement
for this property in the near future. The balance of the portfolio’s logistics vacancy consists of a single ancillary unit of 1 401m² located in the UK.
9. Treasury financial management
9.1 Financial market update
Globally, the abstruseness of the timing of fiscal and monetary stimulus tapering by the US Federal Reserve and other central banks has
created volatility in the markets as new waves and variants of COVID-19 and delays in vaccination rollout keep the market guessing as to
central bank rate moves. Global economic activity continues to tick upwards within the context of shifting geopolitical nexuses, and whilst
many reserve banks have turned hawkish, the Group expects rates to remain towards the bottom of the cycle in SA until there is a further
improvement in the growth outlook, with economic and political uncertainty being the primary factors, and the South African Reserve Bank’s
attempts to balance growth and inflation.
In the UK, a successful vaccine rollout has allowed for an earlier return to work to the extent that staff shortages and high wage inflation have
been experienced. Whilst the Bank of England has looked through temporary inflation, it sees inflation peaking at 4% by year-end, and the
current expectation is that the Bank Rate will need to be hiked by mid-2022.
9.2 Highlights of the past six months
Two important updates to the financial standing of Equites occurred during the past six months, i) the credit rating of Equites was upgraded
by Global Credit Ratings Co. (“GCR”) to AA- and ii) the JSE granted approval for the update of the listed DMTN Programme including an
increase in authorised size to R10 billion.
GCR upgraded the national scale long- and short-term issuer ratings of Equites from A+(ZA) and A1(ZA) to AA-(ZA) and A1+(ZA) respectively, with
a stable outlook. GCR highlighted “the sustained improvement in portfolio quality, supported by positive externalities impacting the logistics sector…
characterised by growth in rental income, elimination of vacancies and stability of margins”. GCR emphasised that the strong tenant profiles and
boom in demand for logistics space which have sustained robust performance, coupled with above-inflation escalations together with
continuous completion of developments and acquisitions, will drive growth in rental income going forward. Comprehensive interaction
between GCR and Equites enabled GCR to discern that sector concentration is mitigated by “the diversity of tenants’ business lines” and “strong
collection rates”.
GCR noted shareholders’ support in the recent R1 billion capital raise and that they “would be expected to back an additional equity raise in the
short term given the current value of the REIT’s share price relative to net asset value”. The DMTN Programme “added to the diversity of funding
sources” and “liquidity cover is underpinned by strong access to funding through both debt and equity markets, where the REIT is building a good
track record”.
The stable outlook reflects GCR’s expectation that “portfolio quality will remain resilient relative to peers, backed by high occupancy rates with
high-quality tenants and largely pre-let development-led growth”. GCR stated that the rating may be upgraded with increased “exposure to more
stable and developed markets” whilst “negative rating action is considered unlikely”.
The update to the JSE-listed DMTN Programme brings Equites in line with current JSE Debt Listings Requirements, and the increase in
authorised Programme size to R10 billion positions Equites for future growth in the debt capital market. Further, this will enable Equites to
issue sustainability-linked notes funded by SA banks and other financial institutions, allowing the Group to continue to be a leader in
environmental, social and corporate governance (“ESG”) in SA.Equites Property Fund Limited
Interim results for the period ended 31 August 2021 11
9.3 Approach to treasury financial management
The formation of, and adherence to, a robust treasury policy is a cornerstone from which the Group maximises stakeholder value, employing
guiding principles to evaluate the appropriateness of any financial decision made.
The six key guiding principles as outlined in the Group policy are stated below, together with the steps taken in the past six months to abide
by these principles:
Principle
1 Minimise the current cost of capital using an optimal mix of debt and equity
2 Maintain a robust balance sheet which offers flexibility for future growth opportunities
3 Diversify the sources of finance employed to fund operations
4 Phase the maturity of outstanding financial liabilities
5 Ensure that strong liquidity is maintained
6 Appropriately manage significant financial risks
9.3.1 Minimising the cost of capital
In June 2021 Equites issued a listed R300 million three-year floating rate note off the DMTN Programme. Whilst this was a private placement
to a single investor, this investor expressed the desire for a significantly larger quantum, and several other institutional investors were also
willing to subscribe. The decision to issue only R300 million was driven by Equites’ focus in maintaining an optimal capital structure
incorporating a low cost of debt.
The pricing of the note at 3-month JIBAR plus 165bp is reflective of the strong financial standing of Equites in the SA debt capital market,
especially when compared with other issuers in the same sector.
The listed debt pricing has a resultant impact on bilateral loan funding with banks and other financial institutions, and recent refinancing of
new and existing debt facilities have allowed Equites to further reduce the cost of debt.
31 August 28 February 31 August
2021 2021 2020
All-in ZAR effective fixed cost of debt 6.81% 6.54% 7.69%
All-in GBP effective fixed cost of debt 2.48% 1.89% 2.76%
All-in effective average fixed cost of debt 4.97% 5.19% 5.44%
9.3.2 Maintaining a robust balance sheet
The capital structure of the Group is constantly evaluated, considering both stakeholder risk appetite and the projected future requirements
of the business. The Group aims for an LTV ratio that aligns with the capital structure, with a focus on ensuring that the business is
appropriately structured to reduce risk and maximise the ability to take advantage of potential future opportunities.
The sale of two UK properties in February 2021, a strong uptake in the dividend reinvestment alternative in May 2021, and a successful
equity raise of R1 billion in July 2021 resulted in a minimal requirement to raise debt funding during the past six months. Rather, shorter-
dated maturing facilities were repaid and the maturity of debt facilities with two SA banks was extended.
The LTV ratio is determined based on the ratio of net debt to the fair value of property assets. As a result of the reduced requirement to raise
debt, LTV ratio as at 31 August 2021 was 28.6%.
31 August 28 February 31 August
R’000 2021 2021 2020
Gross debt 6 506 495 6 828 343 5 005 811
Cash & cash equivalents (203 020) (612 316) (134 597)
Net debt (excluding derivatives) 6 303 475 6 216 027 4 871 214
Total assets 22 636 646 20 857 199 16 892 475
Less assets related to net debt (586 499) (925 436) (361 093)
Fair value of property assets 22 050 147 19 931 763 16 531 382
LTV ratio 28.6% 31.2% 29.5%12 Equites Property Fund Limited
Interim results for the period ended 31 August 2021
Commentary continued
Equites Property Fund Limited and its subsidiaries for the period ended 31 August 2021
9. Treasury financial management continued
9.3 Approach to treasury financial management continued
9.3.3 Diversifying sources of funding
The update to the DMTN Programme listed on the JSE positions Equites to continue to diversify sources of funding in the local DCM. As at
August 2021, R1.8 billion (44% of SA debt and 28% of total debt) had been raised from DCM sources.
The Group continues to engage directly with banks, financial institutions and DCM investors to understand their requirements and offerings.
The past six months have seen a particular focus on engaging with the sustainability and ESG teams at several institutions in order to align
debt financing with Equites’ commitment to developing EDGE-certified green buildings, enabling the Group to continue to achieve progress
in Sustainable Development Goals. The SA government’s increase in permitted renewable energy generation by the public sector will allow
Equites to deploy capital towards increasing the solar PV at properties above the current 1MW level, with Equites’ tenants being the direct
beneficiaries.
In this regard, the Group has recently completed the refinancing of several facilities with SA banks that incorporate various forms of
sustainability metrics. In terms of the UK funding, the Group has begun discussions to incorporate sustainability goals into new funding that
will be raised over the next 12 months.
9.3.4 Phasing the maturity of financial liabilities
The Group balances the term structure of loans and borrowings to reduce refinancing risk with the minimisation of the cost of debt.
The weighted average debt maturity profile has remained at 3.0 years since last reported in February 2021 through a combination of new
and refinanced facilities. The Group has recently completed the refinancing of more than R1.2 billion with two SA institutions, extending the
tenor to August 2024 (R1 billion) and August 2025 (R0.2 billion). GBP-denominated debt has been raised from these two SA banks, with a
new £10 million facility maturing in 12 months and an increase of an existing facility of £25 million to £50 million maturing in 24 months. In
June 2021, R300 million of three-year debt was raised off the DMTN Programme, thereby ensuring that 87.7% of debt matures after 28
February 2023 and more than 60% matures after 29 February 2024.
Loan Facility Undrawn % of
balance amount facility total loan
Expiry date (R’000) (R’000) (R’000) balance
FY22 200 035 400 000 199 965 3.1%
FY23 599 996 799 759 199 763 9.2%
FY24 1 799 397 2 548 795 749 398 27.5%
FY25 1 771 000 1 771 000 — 27.1%
Beyond FY25 2 136 067 2 396 387 225 000 33.1%
Total 6 506 495 7 915 941 1 374 126 100.0%
9.3.5 Maintaining strong liquidity
Equites has maintained a highly liquid financial position throughout the suppressed macroeconomic environment. The Group has a policy-
driven contingent liquidity buffer of R300 million, and due to cash flow from the capital raise and disposal of assets during the period, cash
and committed undrawn facilities were R1.6 billion at August 2021, including R960 million of undrawn new facilities.
With these additional sources of liquidity, the Group will be able to execute the development pipeline while providing the necessary flexibility
to execute on any further opportunities, should these arise.Equites Property Fund Limited
Interim results for the period ended 31 August 2021 13
9.3.6 Appropriately managing financial risks
a. Interest rate risk
The Group has continued to use a combination of natural hedges and derivative financial instruments to hedge exposure to interest rate risk.
At 31 August 2021, the Group had hedged 98.8% and 81.6% of the existing floating-rate term loan balances and total committed future cash
outflows, respectively. Forward-starting interest rate swaps, entered into in prior years to mitigate the interest rate risk arising from forecast
future committed outflows, are now hedging current risk. Additional derivatives have been entered into to take advantage of the low interest
rate cycle resulting in a high proportion of interest rate risk exposure that is hedged, which will benefit the Group in future years.
31 August 28 February 31 August
R’000 2021 2021 2020
Interest rate derivatives 4 344 547 4 216 614 2 439 066
Fixed-for-floating cross currency swap 600 000 600 000 600 000
Hedge cover 4 944 547 4 816 614 3 039 066
Floating-rate borrowings 5 005 767 5 055 890 3 475 105
Current interest rate risk exposure hedged 98.8% 95.3% 87.5%
Fixed-rate borrowings 1 536 048 1 772 453 1 745 495
Total interest-bearing borrowings 6 506 495 6 828 343 5 220 600
Contracted capital commitments 1 974 945 2 170 938 2 245 649
Total committed future cash outflows 8 481 440 8 999 281 7 466 248
Hedge cover including fixed-rate borrowings 6 480 595 6 589 067 4 784 561
Forward-starting interest rate hedges 439 470 692 028 1 192 500
Total hedge cover 6 920 065 7 281 095 5 977 061
Effective interest rate risk exposure hedged on committed future financing cash outflows 81.6% 80.9% 80.1%
b. Foreign exchange rate risk
The Group continues to implement the foreign exchange risk management policy, which defines the Group’s strategy towards foreign
exchange rate risk.
Hedging net investment in foreign operation
The Equites treasury policy restricts the utilisation of cross-currency interest rate swaps (“CCIRS”) to 45% of foreign denominated assets.
Several pre-let developments in the UK are nearing completion and, once these assets become income-producing properties, the Group will
raise in-country debt and close out the related CCIRS. Discussions around debt financing of these assets has already commenced and will be
concluded on completion of the assets. Given the relatively large increase in developments compared with the lesser increase in CCIRS, the
utilisation of CCIRS has decreased to 23.2% of foreign denominated assets. The raising of sterling-denominated debt from SA banks has
facilitated this reduction in utilisation.
The table below shows the carrying amount of UK assets which are currently hedged through CCIRS:
31 August 28 February 31 August
£’000 2021 2021 2020
Carrying amount of UK assets 419 147 366 322 335 263
Nominal value of CCIRS 97 405 92 447 92 447
CCIRS hedged of foreign denominated assets 23.2% 25.2% 27.6%14 Equites Property Fund Limited
Interim results for the period ended 31 August 2021
Commentary continued
Equites Property Fund Limited and its subsidiaries for the period ended 31 August 2021
9. Treasury financial management continued
9.3 Approach to treasury financial management continued
9.3.6 Appropriately managing financial risks continued
b. Foreign exchange rate risk continued
Hedging distributable earnings and cash flow risk
Where possible, the Group continues to utilise natural hedges to minimise exposure to fluctuations in foreign exchange rates on distributable
earnings. The Group assesses the likely impact on the funds to be received from foreign operations of reasonably possible changes in the
GBP/ZAR exchange rate using financial modelling and hedges exposure within these levels.
The Group has hedged net income to be received over the next 24 months in line with the documented Group hedging level policy.
Effective Blended Blended
hedging participation participation
Six-month period ended level floor cap
28 February 2022 80.00% R21.36/GBP R21.51/GBP
31 August 2022 75.00% R22.86/GBP R22.98/GBP
28 February 2023 45.00% R21.10/GBP R23.25/GBP
31 August 2023 30.00% R21.00/GBP R22.75/GBP
The Group’s hedging policy with respect to distributable earnings and cash flow risk is deliberately constructed to provide short-term stability
in the growth in distributable earnings and to gain from the hard currency appreciation over the medium- and long-term.
10. Transformation
In Equites’ pursuit to support efforts toward rectifying inequalities in SA, the Group fully recognises and acknowledges the importance of
adhering to the country’s B-BBEE policies. For the period under review, the Group has maintained a Level 4 B-BBEE rating with a verified
black ownership of 51%.
In May 2020, the Group was faced with the partial loss of an anchor empowerment shareholder. Following the loss, it became imperative
for the Group to engage in strategic empowerment transactions.
To aid this objective, the Group has engaged in a Statement 102 transaction whereby it will dispose of six property assets located in the
Western Cape to a black property investment company. These assets are deemed to be non-core to the Equites portfolio due to the size of
the individual assets. The intention is not only to transfer the properties to the counterparty, but more importantly, to impart mentoring in
respect of property and asset management in order to support them in building a long-term successful property business. Whilst the
transaction has been concluded, there are still outstanding conditions precedent which in all likelihood should be confirmed by the end
of November 2021.
The second part of the strategy is focused on identifying and engaging with potential empowerment partners on an equity level. Negotiations
in this respect are ongoing and any significant developments will be communicated in due course.Equites Property Fund Limited
Interim results for the period ended 31 August 2021 15
11. Environmental, social and governance
ESG has become one of the Group’s key strategic areas of differentiation, with a keen focus on sustainability. The areas of focus are detailed below:
Focus area Description
Product design Equites aims to be at the forefront of green building initiatives by incorporating natural resources and
environmentally responsible techniques into all new developments.
Equites has qualified for a higher level of EDGE certification and has obtained EDGE certifications for all
new developments which have come online in the last 12 months. It is the intention for all new
developments to meet this standard.
Environmental awareness The Group has undertaken sustainability audits across the portfolio; based on the outcomes of the audits,
the Group will suggest improvements to be undertaken by the landlord and/or the tenant to improve its
environmental footprint.
Equites’ atmosphere Equites has undertaken a detailed carbon assessment to drive more conscious behaviour and reduce the
impact on the atmosphere.
Community upliftment and Equites aims to drive sustainable community development through its focus on educational initiatives and
education initiatives positively impacting the local communities in which developments are undertaken.
Customer centricity Equites engaged in its first full-scale tenant satisfaction survey, with the outcomes translating into more
effective engagement with tenants.
The intention is to build long-standing relationships with the Group’s tenants that are embedded with trust
and loyalty.
Human capital Equites promotes diversity through a wide representation of skills, experience and diversity in its team and
promoting internal growth and development.
12. Prospects
In line with previous guidance, the Board expects that Equites will achieve full year distribution per share growth of 5% – 6%.
Management is also targeting positive NAV per share growth for FY22, supported by the development pipeline within ENGL. The Group
therefore expects to achieve a double-digit total return for FY22, which is a function of the distribution yield on NAV per share as well as the
growth in NAV per share.
This guidance is based on the assumptions that a stable macro-economic environment will prevail, no major corporate failures will occur,
the GBP/ZAR exchange rate remains fairly stable and tenants will be able to absorb the recovery of rising utility costs and municipal rates.
This forecast has not been audited or reviewed by Equites’ external auditors.
13. Subsequent events
The directors are not aware of any events that have occurred since the end of this reporting period which have a material impact on the result.
14. Changes to the board of directors and company secretary
14.1 Board appointments
The Board is pleased to announce the appointment of Cindy Hess and Ndabezinhle Mkhize as independent non-executive directors with
effect from 1 October 2021.
Cindy (CA(SA)) is currently an independent non-executive director of Life Healthcare Group Holdings Limited, RCL Foods Limited and
Truworths International Limited. Her previous experience includes serving as Chief Financial Officer of Pioneer Food Group Limited, Media24
Holdings Proprietary Limited and Sea Harvest Group Limited.
Ndabezinhle (BSc (Actuarial Science), CFA, CAIA) is currently the Chief Investment Officer of the Eskom Pension and Provident Fund,
chairman of IG Markets South Africa and an independent non-executive director and chairperson of the audit and risk committee of Fairvest
Property Holdings Limited. His previous experience includes co-portfolio management positions at STANLIB Asset Management and
Coronation Fund Managers as well as an equity analyst role at Prudential Investment Managers.
The board of directors confirms that the appointments of the non-executive directors were made in accordance with Equites’ policy on the
nomination of directors, and these appointments are in line with Equites’ policy to ensure that the Board enhances its independence, meets
its diversity targets and constitutes the appropriate level of skills and expertise required to successfully fulfil its duties.16 Equites Property Fund Limited
Interim results for the period ended 31 August 2021
Commentary continued
Equites Property Fund Limited and its subsidiaries for the period ended 31 August 2021
14. Changes to the board of directors and company secretary continued
14.2 Company secretary
The Board have appointed Todd Colin Petersen as company secretary of the Company with effect from 1 October 2021. In line with best
governance practices, it is recommended that an executive director does not also serve as the company secretary; for this reason, Riaan Gous
has resigned from the role of company secretary, effective 1 October 2021.
Todd is a qualified attorney of the High Court of South Africa. Moreover, Todd holds a Bachelor of Arts Degree (majoring in Political Science
and History) and an LLB Degree both from the University of Cape Town. Todd has experience in corporate and commercial law having started
his legal career as a candidate attorney and, thereafter, as an associate at Norton Rose Fulbright. He has also been an associate at ENSafrica and
at Bedell Cristin in the Channel Islands. Todd has been employed as a Legal Executive at Equites since 1 September 2020.
The board is satisfied that Todd has the necessary experience, qualifications and expertise to take up the position of company secretary of Equites.
15. Basis of preparation
The condensed consolidated interim results for the six months ended 31 August 2021 are prepared in accordance with International
Financial Reporting Standard, IAS 34 Interim Financial Reporting, the SAICA Financial Reporting Guides as issued by the Accounting Practices
Committee and Financial Pronouncements as issued by Financial Reporting Standards council, the JSE Listings Requirements and the
requirements of the Companies Act of 2008 of South Africa. The accounting policies applied in the preparation of these interim financial
statements are in terms of International Financial Reporting standards and are consistent with those applied in the previous annual financial
statements.
Laila Razack CA (SA), in her capacity as Chief Financial Officer, was responsible for the preparation of these condensed consolidated interim
financial statements.
These condensed consolidated interim financial statements have not been reviewed or audited by the Company’s external auditors.
16. Declaration of an interim cash dividend with the election to reinvest the cash dividend in return for Equites shares
(“dividend reinvestment alternative”)
Notice is hereby given of the declaration of the interim dividend number 16 of 78.37854 cents per share.
The Board has declared an interim gross dividend of 78.37854 cents per share on 4 October 2021 which is a 5.3% growth over the prior year
interim distribution of 74.44 cents per share. The DPS growth is in line with previous guidance of 5% – 6%.
% 31 August 31 August
Dividends declared (cents per share) change 2021 2020
Interim dividend 5.3% 78.37854 74.44
Shareholders will be entitled, in respect of all or part of their shareholdings, to elect to reinvest the cash dividend in return for Equites shares.
Those shareholders who elect not to reinvest will receive a gross cash dividend of 78.37854 cents per share. The entitlement for shareholders
to receive the dividend reinvestment alternative is subject to the Board agreeing on the pricing and terms of the dividend reinvestment
alternative. The Board in its discretion may withdraw the dividend reinvestment alternative should market conditions warrant such actions
and such withdrawal will be communicated to shareholders prior to the finalisation announcement to be published by no later than 11:00
(SA time) on Tuesday, 12 October 2021.
A circular providing further information in respect of the cash dividend and dividend reinvestment alternative (the “circular”) will be posted to
shareholders on Tuesday, 5 October 2021. The circular will be available on the website of the Company (www.equites.co.za/investor-
community/investors-documentation/) from Tuesday, 5 October 2021. Copies of the circular may be obtained from the registered offices of
Equites during normal business hours from Tuesday, 5 October 2021 to Friday, 22 October 2021. Shareholders who have dematerialised their
shares through a Central Securities Depository Participant (“CSDP”) or broker should instruct their CSDP or broker with regard to their
election in terms of the custody agreement entered into between them and their CSDP or broker.
The distribution of the circular and/or accompanying documents and the right to elect shares in jurisdictions other than the Republic of
South Africa may be restricted by law and any failure to comply with any of these restrictions may constitute a violation of the securities laws
of any such jurisdictions. Shareholders’ rights to elect shares are not being offered, directly or indirectly, in the United Kingdom, European
Economic Area , Canada, United States of America , Japan, Hong Kong or Australia unless certain exemptions from the requirements of those
jurisdictions are applicable.You can also read