INTERIM STATEMENT JANUARY 1 TO MARCH 31, 2020 WWW.DURR-GROUP.COM - The Dürr Group

Page created by Leonard Franklin
 
CONTINUE READING
INTERIM STATEMENT JANUARY 1 TO MARCH 31, 2020 WWW.DURR-GROUP.COM - The Dürr Group
INTERIM
STATEMENT
JANUARY 1 TO
MARCH 31, 2020

WWW.DURR-GROUP.COM
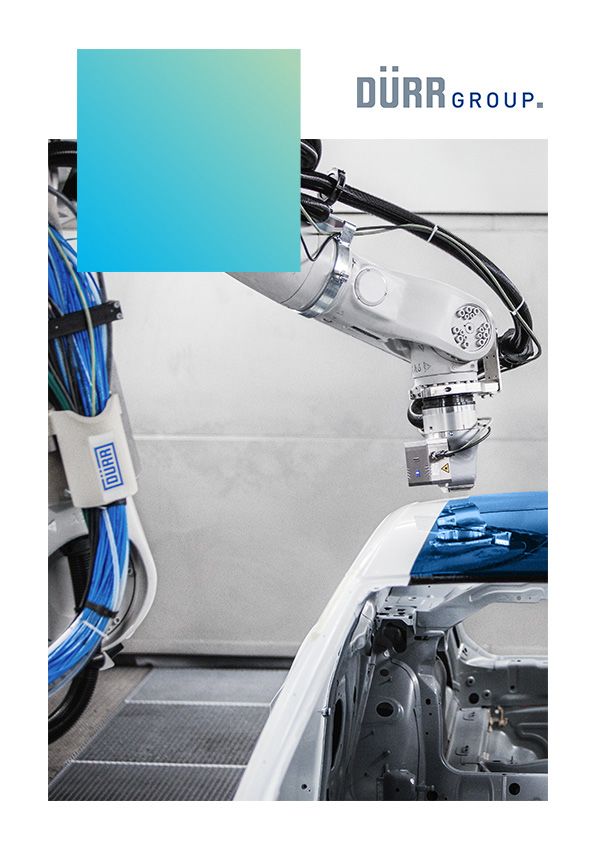
Contents
3       Key figures

4       Highlights Q1 2020

5       Group management report

18      Consolidated statement of income

19      Consolidated statement of comprehensive income

20      Consolidated statement of financial position

22      Consolidated statement of cash flows

24      Consolidated statement of changes in equity

25      Financial calendar

25      Contact

COV ER PHOTO
We received the German Innovation Award in A pril 2020 in recognition of the development of the
EcoPaint Jet. The robot-based system substantially simplifies dual-color painting of cars. A s it
does not use overspr ay, car bodies no longer have to be masked with plastic film when the roof is
painted with a contr asting color for example. This saves time and money, lowers energy
consumption and avoids waste.
Key figures for the Dürr Group (IFRS)
�����������������������������������������������������������������������������������������������������������������������������������������������������������������������������������������������������������������������������������   3

Key figures for the Dürr Group (IFRS)

                                                                                                                                                                           Q1 2020                                 Q1 2019
Order intake                                                                                                                                 €m                                  838.3                               1,105.9
Orders on hand (March 31)                                                                                                                    €m                              2,704.1                                 2,769.8
Sales                                                                                                                                        €m                                  842.6                                  949.9
Gross profit                                                                                                                                 €m                                  177.2                                  206.4
EBITDA                                                                                                                                       €m                                    51.7                                    75.7
EBIT                                                                                                                                         €m                                    22.9                                    48.6
EBIT before extraordinary effects                               1
                                                                                                                                             €m                                    32.6                                    54.6
Earnings after tax                                                                                                                           €m                                    13.2                                    33.0
Gross margin                                                                                                                                     %                                 21.0                                    21.7
EBIT margin                                                                                                                                      %                                   2.7                                     5.1
EBIT margin before extraordinary effects1                                                                                                        %                                   3.9                                     5.7
Cash flow from operating activities                                                                                                          €m                                    68.7                                 - 43.0
Free cash flow                                                                                                                               €m                                    45.9                                 - 66.0
Capital expenditure                                                                                                                          €m                                    19.7                                    22.1
Total assets (March 31)                                                                                                                      €m                              4,038.6                                3,745.53
Equity (including non-controlling interests) (March 31)                                                                                      €m                              1,047.4                                1,031.83
Equity ratio (March 31)                                                                                                                          %                                 25.9                                  27.53
ROCE       2
                                                                                                                                                 %                                   8.2                                 16.43
Net financial status (March 31)                                                                                                              €m                                 - 65.4                              - 143.93
Net working capital (March 31)                                                                                                               €m                                  476.5                                  530.4
Employees (March 31)                                                                                                                                                           16,562                                 16,415
Dürr share
ISIN: DE0005565204
High                                                                                                                                              €                              32.90                                  37.13
Low                                                                                                                                               €                              15.72                                  29.18
Close                                                                                                                                             €                              18.69                                  34.96
Average daily trading volumes                                                                                                              Units                            326,582                                 195,397
Number of shares (weighted average)                                                                                                     Thous.                                 69,202                                 69,202
Earnings per share                                                                                                                                €                                0.18                                    0.45

Minor variances may occur in the computation of sums and percentages in this report due to rounding.

1
 Extraordinary effects in Q1 2020: € -9.7 million (including purchase price allocation effects: € -4.5 million), Q1 2019: € -6.0 million
2
 Annualized
3
 This figure differs slightly from the figure originally disclosed as the opening statement of financial position as of January 1, 2019 was
adjusted following the review of a lease. See page 5 for further information.

                                                                                                                                                  Interim statement January 1 to March 31, 2020
Highlights         Q1 2020
�����������������������������������������������������������������������������������������������������������������������������������������������������������������������������������������������������������������������������������   4

Highlights Q1 2020: Substantial deterioration in
underlying conditions due to Covid-19
„„        Order intake down 24% following delayed award of a big-ticket project
„„        Sales down 11% primarily as a result of the lockdown in China in February/March
„„        Book-to-bill ratio: 1.0
„„        At € 2.7 billion, orders on hand still at the high level recorded at the end of 2019
„„        Decline in EBIT to € 22.9 million (down 53%) due to reduced sales, lower service business and higher
          extraordinary effects (purchase price allocation, measures to secure future viability) of € -9.7 million
          (Q1 2019: € -6.0 million)
„„        Divisions
                Further improvement in the operating EBIT of Clean Technology Systems
                Woodworking Machinery and Systems: comparatively moderate decline in order intake, sales and
                earnings
                Application Technology: sales-related decline in earnings
                Paint and Final Assembly Systems: decline in EBIT cushioned by slightly wider gross margin
                Spare-parts business in Measuring and Process Systems and Application Technology adversely
                affected to a disproportionately strong degree
„„        Cash flow/liquidity
                At € 68.7 million, cash flow from operating activities substantially up on Q1 2019
                Positive free cash flow: net financial status up € 34 million on the end of 2019
                March 31, 2020: total liquidity of around € 850 million plus unused credit facilities of € 500 million
                Additional external finance raised through successful funding activities in April and May
„„        Cost-cutting and liquidity-preservation measures stepped up, however no risks to going-concern
          status
„„        Guidance for 2020 suspended, original targets now beyond reach, forward visibility currently low

                                                                                                                                                  Interim statement January 1 to March 31, 2020
Group       management report
�����������������������������������������������������������������������������������������������������������������������������������������������������������������������������������������������������������������������������������   5

GROUP MANAGEMENT REPORT

GERMAN INNOVATION AWARD FOR ECOPAINTJET
At the beginning of April 2020, we received the German Innovation Award in the “Large Companies” cate-
gory for our EcoPaintJet robot painting system. Illustrated on the title page of this interim statement, the
EcoPaintJet is a revolutionary innovation for highly-defined painting of cars and other products. It features
the following advantages: 100% of the paint lands on the surface without any losses, two-color coatings
are possible without any problems in a process that is faster and more energy-efficient than before with
reduced resource consumption. In automotive production, the EcoPaintJet simplifies product customization
considerably. For example, decorative stripes or contrasting colors can be applied to the body roof fully au-
tomatically and highly efficiently. The new technology combines expertise and high-tech components from
the areas of paint application, robotics and software. The core element is an innovative applicator fitted to a
robot. Unlike conventional rotary atomizers, it applies the paint with the aid of a filigree nozzle plate, similar
to an inkjet printer.

AUTOMOTIVE FINAL ASSEMBLY SYSTEMS POOLED WITHIN PAINT AND FINAL ASSEMBLY SYSTEMS
With effect from January 1, 2020, we reorganized our automotive final assembly business. Testing techno-
logy, assembly products and automotive filling technology were transferred from Measuring and Process
Systems to Paint and Final Assembly Systems. Together with the final assembly activities based there, they
form a powerful unit that provides better customer service. In this way, we are well positioned to harness
additional opportunities in final assembly technology and to exploit the potential for growth offered by the
electromobility transformation in this business in particular.

The transferred activities generated sales of € 171.8 million and EBIT of € 16.8 million in 2019. In the
following tables for Paint and Final Assembly Systems and Measuring and Process Systems, we have retro-
actively restated the figures for the first quarter of 2019 to reflect this new structure in the interests of full
comparability.

ADJUSTMENT TO 2019 STATEMENT OF FINANCIAL POSITION (IFRS 16)
In the course of 2019, we had to make minor adjustments to the opening statement of financial position as
of January 1, 2019. This was due to the results of a review of the term of a lease held by a foreign company
in connection with the initial application of IFRS 16. This led to minor deviations from the original figures
reported in the course of 2019. For example, net financial status as of March 31, 2019 was adjusted from
€ -135.7 million to € -143.9 million.

Business performance
NEGATIVE IMPACT AS A RESULT OF COVID-19
After initially being largely confined to China until the beginning of March, the Covid-19 virus has since
spread across the world. The pandemic is having considerable adverse effects on the Dürr Group’s business
performance and perspectives. In China, the economy has returned to a recovery trajectory since the end
of the first quarter. We were able to ramp up our activities to a level of 100% within a short space of time
after temporarily shutting them down. On the other hand, the pandemic has triggered massive restrictions
on social and economic activity in other parts of the world since March. However, many countries are now
cautiously easing the restrictions in order to stimulate their economies step by step.

Our plants in Germany and Poland have been able to consistently keep production going over the last few
weeks. However, we were forced to temporarily close our facilities in other countries such as Brazil, India
and the United States. At the beginning of April, more than 50% of our employees worldwide were working
from home. At the end of April, we initiated steps for a gradual return to on-site working and the resumption
of customary business processes accompanied by strict measures to protect our employees’ health.

                                                                                                                                                  Interim statement January 1 to March 31, 2020
Group management report
�����������������������������������������������������������������������������������������������������������������������������������������������������������������������������������������������������������������������������������   6

ORDER INTAKE LOWER
The corona crisis left traces on the Dürr Group’s order intake in the first quarter of 2020. It declined by 24.2%
to € 838.3 million due, among other things, to the postponement of the award of a big-ticket contract that
had been promised by an automotive OEM. In March this downward trend gained momentum in service bu-
siness in particular, reflecting the global spread of the corona virus. With respect to the individual divisions,
Clean Technology Systems and Measuring and Process Systems were almost able to hold their order intake
steady, the other divisions were down. Currency-translation and consolidation effects left negligible traces
on order intake, sales and earnings.

Order intake from the emerging markets (Asia excluding Japan, South and Central America, Africa, Eastern
Europe) shrank by just under one third to € 369.0 million in the first quarter of 2020, accounting for 44.0% of
total new orders. Despite the initially massive effects of the corona crisis, orders in China rose by 86.3% to
€ 215.0 million, driven by two big-ticket painting technology orders received from producers of electric vehi-
cles. New orders were also up 16.0% in Germany but contracted by 27.0% in the other European countries.
In the Americas, order intake dropped by 60.7% over the exceedingly strong year-ago quarter.

ORDER IN TA K E (€ MIL L ION), FIR S T QUA R T ER OF 2020

              - 24.2%                                                                 Q1 2019                                Q1 2020

      1,105.9

                     838.3

                                                                                         - 60.7%

                                                + 86.3%                             404.6                                                                           - 27.0%
                                                                                                                             + 16.0%                                                                       - 40.0%
                                                                                                                                                                267.8
                                                           215.0                                                                                                              195.4                   178.9
                                              115.4
                                                                                                 159.2                    139.1 161.4                                                                               107.3

          Total                                 China                                 Americas                           Germany                                 Europe                             Asia (w/o China),
                                                                                                                                                             (w/o Germany)                          Africa, Australia

11.3% DECLINE IN SALES
Sales declined across all five divisions in the first quarter of 2020, with the Group figure dropping
by 11.3% to € 842.6 million. Of this, Germany accounted for 17%, the rest of Europe for 22%,
Americas for 32% and Asia, Africa and Australia for 29%. The emerging markets contributed 40%
of Group sales (Q1 2019: 44%).

Service business was down 9.4%, thus contracting at a less pronounced figure than total sales.
With revenue coming to € 247.3 million in tandem with slightly narrower margins, service bu-
siness contributed a high 29.3% to Group sales. As many customers temporarily closed their
plants, we sustained a noticeable decline in spare-parts business. Conversion work was also
curtailed as a result of plant closures.

Despite the lower order intake, the book-to-bill ratio was just under 1. Orders on hand declined
by only € 38.8 million compared with the end of 2019, reaching € 2,704.1 million as of March 31,
2020 and thus remaining at a high level. They were down € 65.8 million on the same day of the
previous year.
                                                                                                                                                  Interim statement January 1 to March 31, 2020
Group       management report
�����������������������������������������������������������������������������������������������������������������������������������������������������������������������������������������������������������������������������������   7

INCOME S TAT EMEN T A ND P R OF I TA BIL I T Y R AT IO S

                                                                                                                                                                          Q1 2020                                  Q1 2019
Sales                                                                                                                                     €m                                   842.6                                    949.9
Gross profit                                                                                                                              €m                                   177.2                                    206.4
Overhead costs1                                                                                                                           €m                                 - 153.7                                 - 158.5
EBITDA                                                                                                                                    €m                                      51.7                                    75.7
EBIT                                                                                                                                      €m                                      22.9                                    48.6
EBIT before extraordinary effects2                                                                                                        €m                                      32.6                                    54.6
Financial result                                                                                                                          €m                                     - 4.4                                    - 2.7
EBT                                                                                                                                       €m                                      18.5                                    45.9
Income taxes                                                                                                                              €m                                     - 5.3                                 - 12.9
Earnings after tax                                                                                                                        €m                                      13.2                                    33.0
Earnings per share                                                                                                                             €                                  0.18                                    0.45
Gross margin                                                                                                                                  %                                   21.0                                    21.7
EBITDA margin                                                                                                                                 %                                     6.1                                     8.0
EBIT margin                                                                                                                                   %                                     2.7                                     5.1
EBIT margin before extraordinary effects2                                                                                                     %                                     3.9                                     5.7
EBT margin                                                                                                                                    %                                     2.2                                     4.8
Return on sales after taxes                                                                                                                   %                                     1.6                                     3.5
Tax ratio                                                                                                                                     %                                   28.6                                    28.1

1
    Sales and marketing, administration and R&D expenses
2
    Extraordinary effects in Q1 2020: € -9.7 million (including purchase price allocation of € -4.5 million), Q1 2019: € -6.0 million

GROSS PROFIT DOWN ON THE PREVIOUS YEAR
Gross profit contracted by 14.2% to € 177.2 million in the first quarter of 2020, with the gross
margin shrinking by 0.7 percentage points to 21.0%. The main reason for this was that we were
not able to lower cost types such as personnel expenses to match the rate of decline in sales.

EBIT SUBSTANTIALLY LOWER
We were able to lower overhead costs (including research and development costs) by 3.0% in the first
quarter of 2020 and thus partially bring them into line with the lower sales. Other operating income and
other operating expense were almost in balance, coming to a net € -0.5 million (Q1 2019: € 0.7 million).

EBIT contracted by 52.8% to € 22.9 million in the first quarter of 2020 (Q1 2019: € 48.6 million). This was
primarily due to the lower sales together with an increase in extraordinary expenses to € 9.7 million
(Q1 2019: € 6.0 million) as we discontinued loss-making activities at two smaller facilities in Germany.
The purchase price allocation effects included in extraordinary expenses came to € 4.5 million. Operating
EBIT (adjusted for extraordinary effects) fell by 40.2% to € 32.6 million (Q1 2019: € 54.6 million), resulting
in an operating EBIT margin of 3.9%, compared with 5.7% in the year-ago period.

With depreciation and amortization expense coming to € 28.8 million, EBITDA stood at € 51.7 million in
the first quarter of 2020 (Q1 2019: € 75.7 million). The weaker financial result of € -4.4 million (Q1 2019:
€ -2.7 million) was due, among other things, to a decline of € 1.3 million in net investment income. By
contrast, interest income and interest expense were largely unchanged. The tax rate rose only marginally
and, at 28.6%, remained at a low level (Q1 2019: 28.1%). Earnings after tax dropped by 59.9% to € 13.2
million, translating into earnings per share of € 0.18 (Q1 2019: € 0.45).

                                                                                                                                                  Interim statement January 1 to March 31, 2020
Group       management report
�����������������������������������������������������������������������������������������������������������������������������������������������������������������������������������������������������������������������������������   8

Financial position
CASH FLOW FROM OPERATING ACTIVITIES SUBSTANTIALLY UP ON THE PREVIOUS YEAR AND WELL INTO
POSITIVE TERRITORY

C A SH F LO W 1

€m                                                                                                                                                                             Q1 2020                             Q1 2019
Earnings before taxes                                                                                                                                                                  18.5                               45.9
Depreciation and amortization                                                                                                                                                          28.8                               27.1
Interest result                                                                                                                                                                          5.1                                4.7
Income tax payments                                                                                                                                                                   - 9.1                               - 9.7
Change in provisions                                                                                                                                                                  - 3.6                               - 4.4
Change in net working capital                                                                                                                                                          17.8                            - 87.3
Other items                                                                                                                                                                            11.2                            - 19.2
Cash flow from operating activities                                                                                                                                                    68.7                            - 43.0
Interest payments (net)                                                                                                                                                               - 0.2                                 0.2
Lease liabilities                                                                                                                                                                     - 7.4                               - 5.9
Capital expenditure                                                                                                                                                                 - 15.3                             - 17.3
Free cash flow                                                                                                                                                                         45.9                            - 66.0
Other cash flows                                                                                                                                                                    - 12.0                                - 3.5
Change in net financial status                                                                                                                                                         33.9                            - 69.5
1
 Currency translation effects have been eliminated from the cash flow statement. Accordingly, it does not fully reflect all changes in
the line items shown in the statement of financial position.

In contrast to the first quarter of earlier years, cash flow from operating activities was positive in the
first quarter of 2020, coming to € 68.7 million. The improvement of € 111.7 million compared with the
same period in the previous year was due, among other things, to the reduction of € 17.8 million in net
working capital, which had increased by € 87.3 million in the year-ago period.

Cash flow from investing activities came to € -25.1 million and was primarily influenced by capital ex-
penditure on property, plant and equipment as well as intangible assets, which came to € 15.3 million. It
also includes the investment of € 9.1 million in term deposits. Cash outflows in connection with business
compositions, acquisitions of shares in other companies and investments in other financial assets reached
€ 2.8 million and reflect mainly the acquisition of the digital technology company Techno-Step GmbH in the
Application Technology division.

There was a cash outflow from financing activities of € -10.8 million (Q1 2019: € -16.8 million). An
amount of € 7.4 million was used for the settlement of lease liabilities. We spent € 2.0 million for the
purchase of further shares in HOMAG that were offered to us by shareholders. On the basis of the po-
sitive cash flow from operating activities, a free cash flow of € 45.9 million was registered in the first
quarter of 2020 (Q1 2019: € -66.0 million). The net financial status improved by € 33.9 million over the
end of 2019, coming to € -65.4 million as of March 31, 2020.

NE T F IN A NCI A L S TAT US

€m
March 31, 2020                                                                                                                                                                                                          -65.4
December 31, 2019                                                                                                                                                                                                        -99.3
March 31, 2019                                                                                                                                                                                                         -143.9

                                                                                                                                                  Interim statement January 1 to March 31, 2020
Group       management report
�����������������������������������������������������������������������������������������������������������������������������������������������������������������������������������������������������������������������������������   9

FURTHER INCREASE IN TOTAL ASSETS

CURREN T A ND NON-CURREN T A S SE T S

€m                                                                                                           March 31,               Percentage of                     December 31,                         March 31,
                                                                                                                 2020                  total assets                           2019                              2019
Intangible assets                                                                                                     640.4                              15.9                          644.0                         650.6
Property, plant and equipment                                                                                         513.1                              12.7                          525.4                         527.8
Other non-current assets                                                                                              146.7                                3.6                         153.0                         148.2
Non-current assets                                                                                                1,300.3                                32.2                       1,322.4                      1,326.6
Inventories                                                                                                           550.3                              13.6                          509.2                         556.0
Contract assets                                                                                                       636.9                              15.8                          519.1                         528.3
Trade receivables                                                                                                     541.6                              13.4                          570.3                         590.5
Cash and cash equivalents                                                                                             687.6                              17.0                          662.0                         589.2
Other current assets                                                                                                  322.0                                8.0                         299.4                         155.0
Current assets                                                                                                    2,738.3                                67.8                       2,560.0                      2,418.9
Total assets                                                                                                      4,038.6                             100.0                         3,882.3                      3,745.5

Total assets climbed by € 156.3 million or 4.0% over the end of 2019 to € 4,038.6 million. One major
factor in this was the increase of a total of € 158.9 million in inventories and contract assets. This is
due to the fact that, although we continued to work on orders in project and mechanical engineering
business, we were not always able to deliver the finished products due to customer shutdowns. Cash
and cash equivalents rose to € 687.6 million as of March 31, 2020; including term deposits, total liqui-
dity came to € 856.8 million.

C A SH A ND C A SH EQUI VA L EN T S

€m
March 31, 2020                                                                                                                                                                                                          687.6
December 31, 2019                                                                                                                                                                                                       662.0
March 31, 2019                                                                                                                                                                                                          589.2

                                                                                                                                                  Interim statement January 1 to March 31, 2020
Group       management report
�����������������������������������������������������������������������������������������������������������������������������������������������������������������������������������������������������������������������������������   10

CHANGES IN LIQUIDITY

    €m

      800
                                                                         68.7                                 -20.1                                   -23.0
      700                   662.0                                                                                                                                                                   687.6

      600

      500

      400

      300

      200

      100

           0
                    Cash and cash                             Operating cash                         Investments                              Others (e.g. in-                                 Cash and cash
                    equivalents                               flow                                   (incl. acquisi-                          terest payments,                                 equivalents
                    Dec. 31, 2019                                                                    tions)                                   term deposits)                                   March 31, 2020

EQUITY STEADY

EQUI T Y

                                                                                                            March 31,                Percentage of                    December 31,                             March 31,
€m                                                                                                              2020                   total assets                          2019                                  2019
Subscribed capital                                                                                                   177.2                                 4.4                         177.2                            177.2
Other equity                                                                                                         857.5                               21.2                          853.5                            839.2
Equity attributable to shareholders                                                                              1,034.7                                25.6                       1,030.6                          1,016.4
Non-controlling interests                                                                                               12.7                               0.3                           12.7                             15.4
Total equity                                                                                                     1,047.4                                25.9                       1,043.4                          1,031.8

As the earnings after tax of € 13.2 million coincided with negative currency-translation effects, there was
only a small increase in equity as of March 31, 2020. However, the equity ratio contracted to 25.9%, down
from 27.5% on the same date in the previous year, due to the increase in total assets.

Current and non-current liabilities climbed by € 152.3 million compared with the end of 2019 due to higher
contract liabilities resulting from project payments from customers among other things.

                                                                                                                                                  Interim statement January 1 to March 31, 2020
Group       management report
�����������������������������������������������������������������������������������������������������������������������������������������������������������������������������������������������������������������������������������   11

CURREN T A ND NON-CURREN T L I A BIL I T IE S

                                                                                                          March 31,                Percentage of                      December 31,                             March 31,
€m                                                                                                            2020                   total assets                            2019                                  2019
Financial liabilities (incl. bond and
Schuldschein loans)                                                                                                922.0                               22.8                           923.1                             733.1
Provisions (incl. retirement benefits)                                                                             215.9                                 5.3                          229.4                             196.4
Contract liabilities                                                                                               794.1                               19.7                           632.7                             612.7
Trade payables                                                                                                     469.0                               11.6                           479.0                             546.3
Income tax liabilities                                                                                             118.6                                 2.9                          129.6                             133.4
Other liabilities (incl. deferred taxes)                                                                           471.6                               11.7                           445.2                             491.8
Total                                                                                                          2,991.2                                 74.1                       2,838.9                           2,713.6

EXTERNAL FINANCE AND FUNDING STRUCTURE
In March 2020 we issued a further sustainability Schuldschein loan of € 115 million. After accruing to us
in April, the proceeds were primarily used for the early repayment of the variable tranches (€ 100 million)
under the Schuldschein loan that we had issued in 2016. The interest rate is partially linked to the Dürr
Group’s sustainability rating and, at an average of 0.9%, is substantially lower than the interest rate on the
Schuldschein loan that was issued in 2016 (average of 1.6%).

Following the issue of the sustainability Schuldschein loan, our funding structure is composed of the
following elements.

„„ Corporate bond issued by Dürr AG of € 300 million (expiring April 3, 2021)
„„ Three Schuldschein loans issued by Dürr AG for a combined total of € 515 million (different terms, the
   last one expiring in 2030)
„„ Syndicated loan held by Dürr AG for € 750 million, including € 500 million as a credit facility and € 250
   million as a guarantee facility (expiring August 7, 2024)
„„ Lease liabilities of € 103 million (March 31, 2020)
„„ Bilateral credit facilities of € 4 million (March 31, 2020)

Details of a further funding transaction for a total of € 350 million, which we executed at the beginning of May 2020,
can be found in the section on material events after the reporting date on page 17.

                                                                                                                                                  Interim statement January 1 to March 31, 2020
Group       management report
�����������������������������������������������������������������������������������������������������������������������������������������������������������������������������������������������������������������������������������   12

Employees
SLIGHT INCREASE IN HEADCOUNT
Compared to March 31, 2019, employee numbers were up 0.9%, rising to 16,562. The main reason for
this was the expansion of capacities for internal Group engineering services in India and Poland prior
to the outbreak of the corona crisis. The Group headcount has risen only marginally (by 0.4%) since the
end of 2019. Over the coming quarters, employee numbers are to be reduced on a like-for-like basis
particularly due to the capacity adjustments already announced for HOMAG (primarily the Hemmoor
plant) and at smaller German facilities in Application Technology and Clean Technology Systems. The
headcount in the emerging markets widened by 2.8% over March 31, 2019, rising to 5,332 employees
and contributing 32.2% of the global workforce. Half of our employees are based in Germany.

EMP LOY EE S BY DI V ISION

                                                                                                        March 31, 2020                         December 31, 2019                                     March 31, 2019
Paint and Final Assembly Systems                                                                                           4,465                                         4,4121                                        4,2771
Application Technology                                                                                                     2,301                                          2,306                                         2,271
Clean Technology Systems                                                                                                   1,392                                          1,418                                         1,443
Measuring and Process Systems                                                                                              1,524                                         1,5151                                        1,5431
Woodworking Machinery and Systems                                                                                          6,613                                          6,569                                         6,633
Corporate Center                                                                                                               267                                            273                                           248
Total                                                                                                                    16,562                                         16,493                                       16,415
1
  Testing technology, assembly products and automotive filling technology were transferred from Measuring and Process Systems to
Paint and Final Assembly Systems effective January 1, 2020. The figures 2019 have been adjusted accordingly and therefore differ from the
figures originally disclosed.

EMP LOY EE S BY REGION

                                                                                                        March 31, 2020                          December 31, 2019                                    March 31, 2019
Germany                                                                                                                     8,210                                          8,181                                        8,197
Other European countries                                                                                                    2,648                                          2,617                                        2,613
North / Central America                                                                                                     2,031                                          2,028                                        2,012
South America                                                                                                                  364                                            354                                           344
Asia, Africa, Australia                                                                                                     3,309                                          3,313                                        3,249

Total                                                                                                                    16,562                                         16,493                                       16,415

Segment report

S A L E S BY DI V ISION

€m                                                                                                                                                                            Q1 2020                              Q1 2019
Paint and Final Assembly Systems                                                                                                                                                   297.2                              348.91
Application Technology                                                                                                                                                             121.4                                139.4
Clean Technology Systems                                                                                                                                                              82.3                                88.3
Measuring and Process Systems                                                                                                                                                         52.1                               54.11
Woodworking Machinery and Systems                                                                                                                                                  289.6                                319.2
Corporate Center                                                                                                                                                                        0.0                                 0.0

Total                                                                                                                                                                              842.6                               949.9
1
 Testing technology, assembly products and automotive filling technology were transferred from Measuring and Process Systems to
Paint and Final Assembly Systems effective January 1, 2020. The figures for the first quarter of 2019 have been adjusted accordingly and
therefore differ from the figures originally disclosed.

                                                                                                                                                  Interim statement January 1 to March 31, 2020
Group       management report
�����������������������������������������������������������������������������������������������������������������������������������������������������������������������������������������������������������������������������������   13

EBI T BY DI V ISION

€m                                                                                                                                                                            Q1 2020                              Q1 2019
Paint and Final Assembly Systems                                                                                                                                                      10.5                               16.11
Application Technology                                                                                                                                                                  5.7                               14.6
Clean Technology Systems                                                                                                                                                              - 1.2                               - 0.7
Measuring and Process Systems                                                                                                                                                         - 1.6                                3.41
Woodworking Machinery and Systems                                                                                                                                                     12.5                                18.4
Corporate Center / consolidation                                                                                                                                                      - 3.0                               - 3.1

Total                                                                                                                                                                                 22.9                                48.6
1
 Testing technology, assembly products and automotive filling technology were transferred from Measuring and Process Systems to
Paint and Final Assembly Systems effective January 1, 2020. The figures for the first quarter of 2019 have been adjusted accordingly and
therefore differ from the figures originally disclosed.

PA IN T A ND F IN A L A S SEMBLY S Y S T EM S

                                                                                                                                                                                 Q1 2020                         Q1 20191
Order intake                                                                                                                                          €m                              249.9                             436.1
Sales                                                                                                                                                 €m                              297.2                             348.9
EBITDA                                                                                                                                                €m                                 16.8                             22.2
EBIT                                                                                                                                                  €m                                 10.5                             16.1
EBIT before extraordinary effects                                                                                                                     €m                                 11.2                             17.1
EBIT margin                                                                                                                                               %                                3.5                              4.6
EBIT margin before extraordinary effects                                                                                                                  %                                3.8                              4.9
ROCE 2                                                                                                                                                    %                              18.6                                   -
1
 Testing technology, assembly products and automotive filling technology were transferred from Measuring and Process Systems to Paint
and Final Assembly Systems effective January 1, 2020. The figures for the first quarter of 2019 have been adjusted accordingly and
therefore differ from the figures originally disclosed.
2
    annualized

Order intake in the Paint and Final Assembly Systems division dropped by 42.7% to € 249.9 million in the first
quarter of 2020. Whereas business in the same period in the previous year had been dominated by a big-ticket
order received in North America, in March 2020 a large-scale project was postponed shortly before it was due to
be awarded. There are fewer projects in the pipeline than in the previous year, although there have been no major
cancellations of orders already awarded. Sales dropped by 14.8% despite the higher order backlog as many auto-
motive plants and construction sites were temporarily closed down, preventing us from executing the planned work.
This caused EBIT to drop by 34.9%. The EBIT margin before extraordinary effects (mainly purchase price allocation
effects) shrank from 4.9% to 3.8%. By contrast, the gross margin was up on the previous year in the first quarter of
2020 as orders with higher margins were executed, while the efficiency gains arising from the FOCUS 2.0 optimiza-
tion program began to feed through.

A P P L IC AT ION T ECHNOLOGY

                                                                                                                                                                                 Q1 2020                           Q1 2019
Order intake                                                                                                                                          €m                              116.7                             159.6
Sales                                                                                                                                                 €m                              121.4                             139.4
EBITDA                                                                                                                                                €m                                   9.0                            17.8
EBIT                                                                                                                                                  €m                                   5.7                            14.6
EBIT before extraordinary effects                                                                                                                     €m                                   7.9                            14.7
EBIT margin                                                                                                                                               %                                4.7                            10.5
EBIT margin before extraordinary effects                                                                                                                  %                                6.5                            10.6
ROCE1                                                                                                                                                     %                                8.1                            19.8
1
    annualized

                                                                                                                                                  Interim statement January 1 to March 31, 2020
Group       management report
�����������������������������������������������������������������������������������������������������������������������������������������������������������������������������������������������������������������������������������   14

In the Application Technology division, order intake (down 26.8%) and sales (down 12.9%) were also sub-
stantially lower in the first quarter of 2020. The book-to-bill ratio was just under 1. There were two main
reasons for the 61.1% decline in EBIT: the sharp fall in profitable spare-parts and service business as well
as extraordinary expenses of € 2.2 million in connection with the closure of a small, loss-making facility in
Germany. Before extraordinary effects, EBIT came to € 7.9 million (down 46.2%), translating into an EBIT
margin of 6.5%. We acquired Techno-Step GmbH in Böblingen in March to expand the digital skills in Appli-
cation Technology. With sales of around € 3.5 million, this company specializes in developing and installing
systems for analyzing process data.

CL E A N T ECHNOLOGY S Y S T EM S

                                                                                                                                                                                 Q1 2020                           Q1 2019
Order intake                                                                                                                                          €m                              108.8                             112.6
Sales                                                                                                                                                 €m                                 82.3                             88.3
EBITDA                                                                                                                                                €m                                   1.7                              2.5
EBIT                                                                                                                                                  €m                                - 1.2                             - 0.7
EBIT before extraordinary effects                                                                                                                     €m                                   1.8                              1.2
EBIT margin                                                                                                                                               %                             - 1.5                             - 0.8
EBIT margin before extraordinary effects                                                                                                                  %                                2.2                              1.4
ROCE1                                                                                                                                                     %                             - 3.3                             - 1.6
1
    annualized

Clean Technology Systems reported only a small decline of 3.3% in order intake. There are also plenty of
exhaust-air purification technology projects in the pipeline, which currently appears to be largely unaffected
by Covid-19. With sales dropping by 6.8% to € 82.3 million, the book-to-bill ratio reached 1.3, while the or-
der backlog continued to grow. The EBIT of € -1.2 million includes extraordinary expenses of € 3.0 million,
which are very largely related to the closure of a small production plant. Before extraordinary effects, EBIT
climbed by 48.3% to € 1.8 million, increasingly reflecting the positive effects arising from efficiency gains
and improved processes following the integration of Megtec/Universal.

ME A S URING A ND P R OCE S S S Y S T EM S

                                                                                                                                                                                 Q1 2020                         Q1 20191
Order intake                                                                                                                                          €m                                 61.1                             63.1
Sales                                                                                                                                                 €m                                 52.1                             54.1
EBITDA                                                                                                                                                €m                                   1.0                              5.8
EBIT                                                                                                                                                  €m                                - 1.6                               3.4
EBIT before extraordinary effects                                                                                                                     €m                                - 1.4                               3.7
EBIT margin                                                                                                                                               %                             - 3.0                               6.2
EBIT margin before extraordinary effects                                                                                                                  %                             - 2.8                               6.9
ROCE 2                                                                                                                                                    %                             - 3.3                                   -
1
 Testing technology, assembly products and automotive filling technology were transferred from Measuring and Process Systems to Paint
and Final Assembly Systems effective January 1, 2020. The figures for the first quarter of 2019 have been adjusted accordingly and th-
erefore differ from the figures originally disclosed.
2
    annualized

Measuring and Process Systems also reported largely stable order intake (down 3.2%) and sales (down
3.6%) in the first quarter. With the book-to-bill ratio coming to 1.2, the order backlog continued to grow. The
unsatisfactory earnings performance, with EBIT coming to € -1.6 million after € 3.4 million in the year-ago,
was due to appreciably weaker demand for spare parts, a substantial decline in business in China in the
wake of the corona crisis and a changed sales mix: There was a substantial decline in business in standard
machinery with its higher margins, which particularly focuses on the automotive industry; on the other hand,
                                                                                                                                                  Interim statement January 1 to March 31, 2020
Group       management report
�����������������������������������������������������������������������������������������������������������������������������������������������������������������������������������������������������������������������������������   15

business in special machinery, which is exposed to greater pricing and execution risks, was stronger. We
initiated process optimizations in special machinery business to address this.

W OOD W ORK ING M ACHINER Y A ND S Y S T EM S

                                                                                                                                                                                 Q1 2020                           Q1 2019
Order intake                                                                                                                                          €m                              301.7                             334.6
Sales                                                                                                                                                 €m                              289.6                             319.2
EBITDA                                                                                                                                                €m                                 25.5                             29.8
EBIT                                                                                                                                                  €m                                 12.5                             18.4
EBIT before extraordinary effects                                                                                                                     €m                                 16.1                             20.5
EBIT margin                                                                                                                                               %                                4.3                              5.8
EBIT margin before extraordinary effects                                                                                                                  %                                5.5                              6.4
ROCE1                                                                                                                                                     %                              11.5                             14.6
1
    annualized

Although order intake and sales in the Woodworking Machinery and Systems division dropped in the first
quarter of 2020 (by 9.8% and 9.3%, respectively), these declines were in line with our plans and were influen-
ced only partially by the pandemic. In China, both figures were largely unchanged over the previous year. The
HOMAG plants in Germany and Poland, which are responsible for the bulk of production, have remained in
operation since the outbreak of the pandemic. The book-to-bill ratio came to 1.04 in the first quarter. EBIT
before extraordinary effects dropped by 21.8% to € 16.1 million for sales-related reasons, although the gross
margin held steady at the previous year’s level.

CORP OR AT E CEN T ER
EBIT in the Corporate Center (e.g. Dürr AG, Dürr IT Service GmbH) came to € -3.0 million in the first quarter
of 2020, thus remaining close to the previous year’s figure (€ -3.1 million).

Opportunities and risks
RISK S
A detailed description of the customary risks of our business and the risk management system can be found
in the 2019 annual report (from page 81), which was published on March 20, 2020. Despite the corona crisis,
there are currently no discernible risks which either individually or in conjunction with other risks are lia-
ble to pose any threat to the Group’s going-concern status. However, economic conditions and the outlook
have deteriorated massively in recent months and the global economy has slipped into recession. Accor-
dingly, our overall risk situation has increased considerably, although we still consider it to be manageable.

OPP OR T UNIT IE S
A description of the opportunities arising from our business and the opportunities management system can
be found in the 2019 annual report (starting on page 90). There has also been a deterioration in opportunities
since the publication of the annual report.

                                                                                                                                                  Interim statement January 1 to March 31, 2020
Group       management report
�����������������������������������������������������������������������������������������������������������������������������������������������������������������������������������������������������������������������������������   16

Personnel changes
Chief Financial Officer Carlo Crosetto left Dürr AG on February 29, 2020 at his own request. Chief Executive
Officer Ralf W. Dieter has assumed his duties on an interim basis. Dietmar Heinrich, whom the Supervisory
Board appointed as the new Chief Financial Officer in December 2019, will be commencing his duties on
August 1, 2020.

Karl-Heinz Streibich has announced his attention to step down from his position as Chairman of Dürr AG’s
Supervisory Board at the end of the Annual General Meeting on May 28, 2020. The reason for this is that
Mr. Streibich is standing for election to the Supervisory Board of Software AG and plans to assume the po-
sition of Chairman. This would mean that he would have more than the maximum of five supervisory board
mandates (chairmanships count twice) recommended by the German Corporate Governance Code. Gerhard
Federer will be standing for election to replace him as Chairman of Dürr AG’s Supervisory Board. A member
of the Supervisory Board since 2016, he is Chairman of the Audit Committee. The election will be held by the
Supervisory Board after the Annual General Meeting.

Arndt Zinnhardt has been proposed for election at the Annual General Meeting as a new member of the
Supervisory Board. As a former auditor and tax consultant and with many years of experience as chief
financial officer at a software company, Mr. Zinnhardt holds outstanding expert knowledge of financial and
digital matters.

Outlook
The economic environment has deteriorated massively since mid-March as a result of the Covid-19 pande-
mic. It is now assumed that the global economy faces the greatest crisis since the Second World War. On a
positive note, China now appears to have overcome the pandemic. The western world is gradually getting
social and economic life back on track. The Dürr Group is following these developments but is attaching the
utmost importance to caution and protecting its employees’ health.

We expect the economic consequences of the crisis to unleash their greatest effect on our business in the
second quarter. In view of this, substantial declines in order intake and sales must be expected, while the
possibility of a loss and a negative cash flow from operating activities cannot be excluded. Looking forward
to the second half of the year, we currently expect to see a gradual recovery. However, it is currently not pos-
sible to provide any full-year guidance with respect to our business performance in view of the exceptional
macroeconomic circumstances. We will be publishing guidance in the customary form as soon as this is
possible.

Given the contraction in our business, we have taken various measures to lower costs. These include, for
example, moderate capacity adjustments with respect to external employees and the core workforce, short-
time working arrangements, reduced working hours and a cut in expenses and capital spending. Prudent
cash management is helping us to conserve our liquidity. The section on material events after the reporting
date on page 17 provides information on the steps taken to raise additional funding. We are convinced that
we are robust enough and have sufficient liquidity to overcome the current crisis.

                                                                                                                                                  Interim statement January 1 to March 31, 2020
Group       management report
�����������������������������������������������������������������������������������������������������������������������������������������������������������������������������������������������������������������������������������   17

Material events after the reporting date
E X T ERN A L FIN A NCING INCRE A SED: REFIN A NCING SECURED IN 2021
At the beginning of April, we received the proceeds of € 115 million from the sustainability Schuldschein
loan that we had issued in March 2020. At the beginning of May 2020, we secured an additional credit
facility of € 350 million to additionally heighten our financial flexibility. It is being provided by six syndi-
cate banks for an initial period of one year but may be renewed twice for a further six-month period at a
time. The credit facility was obtained ahead of the refinancing operations planned for the coming year:
the corporate bond for € 300 million issued in 2014 will be maturing in April 2021. At the same time, a
tranche of € 50 million under the Schuldschein loan issued in 2016 will also be due for repayment. If we
are unable to arrange any long-term follow-up finance in the capital market in sufficient time, we will
still be able to take recourse to this facility.

HOM AG GROUP S T RENGT HENING M A RK E T P OSIT ION IN CHIN A
At the end of April 2020, HOMAG Group AG signed a contract with its Chinese partner Golden Field Inter-
national Holdings Ltd. providing for the HOMAG Group to take over the entire operating business of the
sales joint venture HOMAG China Golden Field Ltd. (HCGF). In addition, the HOMAG Group is increasing
its share in the Chinese production and engineering company HOMAG Machinery Shanghai Co. Ltd. to
100% by acquiring the share of 18.75% previously held by Golden Field International Holdings Ltd.

This transaction integrates all of HOMAG’s business activities in China within a single company that is
fully owned by the HOMAG Group, allowing it to cover the entire value chain from engineering and pro-
duction to sales and service efficiently. At the same time, it gives HOMAG a first-class sales and service
presence with five regional branches in the world’s largest furniture market.

Between 2017 and 2019, HOMAG generated annual average sales of € 145 million in China, of which
90% arose via HCGF. Looking forward, only those sales that HCGF does not generate with HOMAG pro-
ducts will cause an increase in total sales for HOMAG and the Dürr Group as a whole. Over the last three
years, these came to an annual average of € 110 million. Earnings will improve as HOMAG will also be
retaining the margin on sales hitherto attributable to HCGF. The addition of HCGF will cause HOMAG’s
headcount in China to rise by 450 to a good 750. The acquisition will also broaden its digital skills as
HCGF will be contributing its developer team and applications.

Subject to approval by the Chinese antitrust authorities, the contract is expected to take effect in autumn
2020. The fixed purchase price payable by HOMAG is a low double-digit € million amount. Further
performance-related payments are also possible in addition to this.

No other events liable to exert a material impact on the Group’s net assets, financial position and re-
sults of operations occurred between the end of the first quarter of 2020 and the date of this interim
statement.

Bietigheim-Bissingen, May 14, 2020

Dürr Aktiengesellschaft

Ralf W. Dieter		                                              Dr. Jochen Weyrauch		                                                              Pekka Paasivaara
CEO			                                                        Deputy CEO			                                                                      Member of the Board of Management

                                                                                                                                                  Interim statement January 1 to March 31, 2020
Consolidated statement of income
�����������������������������������������������������������������������������������������������������������������������������������������������������������������������������������������������������������������������������������   18

Consolidated statement of income
OF DÜRR A K T IENGE SEL L S CH A F T, S T U T TG A R T, FOR T HE P ERIOD F R OM JA NUA R Y 1 TO M A R CH 31, 2 02 0

€k                                                                                                                                                                             Q1 2020                             Q1 2019
Sales revenues                                                                                                                                                                  842,574                             949,859
Cost of sales                                                                                                                                                                 - 665,396                          - 743,452
Gross profit on sales                                                                                                                                                           177,178                            206,407
Selling expenses                                                                                                                                                                - 78,890                           - 82,457
General administrative expenses                                                                                                                                                 - 46,716                           - 46,929
Research and development costs                                                                                                                                                  - 28,140                           - 29,124
Other operating income                                                                                                                                                             15,022                               7,711
Other operating expenses                                                                                                                                                        - 15,519                              - 6,976
Earnings before investment result, interest and income taxes                                                                                                                      22,935                             48,632
Investment result                                                                                                                                                                       709                             1,967
Interest and similar income                                                                                                                                                          1,815                              1,634
Interest and similar expenses                                                                                                                                                     - 6,911                             - 6,338
Earnings before income taxes                                                                                                                                                      18,548                             45,895
Income taxes                                                                                                                                                                      - 5,307                          - 12,910
Profit of the Dürr Group                                                                                                                                                          13,241                             32,985
   Attributable to
   Non-controlling interests                                                                                                                                                            514                             1,852
   Shareholders of Dürr Aktiengesellschaft                                                                                                                                        12,727                             31,133
   Number of shares issued in thousands                                                                                                                                      69,202.08                          69,202.08
   Earnings per share in € (basic and diluted)                                                                                                                                         0.18                               0.45

                                                                                                                                                  Interim statement January 1 to March 31, 2020
Consolidated statement of comprehensive income
�����������������������������������������������������������������������������������������������������������������������������������������������������������������������������������������������������������������������������������   19

Consolidated statement of comprehensive
income
OF DÜRR A K T IENGE SEL L S CH A F T, S T U T TG A R T, FOR T HE P ERIOD F R OM JA NUA R Y 1 TO M A R CH 31, 2 02 0

€k                                                                                                                                                                              Q1 2020                            Q1 2019
Profit of the Dürr Group                                                                                                                                                           13,241                            32,985
Items of other comprehensive income that are not reclassified to profit or loss

Remeasurement of defined benefit plans and similar obligations                                                                                                                        8,747                              - 890
   Associated deferred taxes                                                                                                                                                       - 2,391                                  391
Items of other comprehensive income that may be reclassified subsequently to
profit or loss

Changes in fair value of financial instruments used for hedging purposes
recognized in equity                                                                                                                                                               - 6,317                               - 998
   Associated deferred taxes                                                                                                                                                          1,853                              - 112
Currency translation effects                                                                                                                                                     - 10,524                             13,759
Currency translation effects from entities accounted for using the equity method                                                                                                      1,081                              - 350
Other comprehensive income, net of tax                                                                                                                                            - 7,551                            11,800
Total comprehensive income, net of tax                                                                                                                                               5,690                           44,785
Attributable to
Non-controlling interests                                                                                                                                                                356                            2,032
Shareholders of Dürr Aktiengesellschaft                                                                                                                                              5,334                           42,753

                                                                                                                                                  Interim statement January 1 to March 31, 2020
Consolidated statement of financial position
�����������������������������������������������������������������������������������������������������������������������������������������������������������������������������������������������������������������������������������   20

Consolidated statement of financial position

OF DÜRR A K T IENGE SEL L S CH A F T, S T U T TG A R T, A S OF M A R CH 31, 2 02 0

                                                                                                                                 March 31,                      December 31,                                   March 31,
€k                                                                                                                                   2020                              2019                                        2019
ASSETS
Goodwill                                                                                                                             448,784                                449,160                                448,563
Other intangible assets                                                                                                              191,627                                194,840                                202,067
Property, plant and equipment                                                                                                        513,105                                525,395                                527,768
Investment property                                                                                                                     19,961                                 20,215                                21,077
Investments in entities accounted for
using the equity method                                                                                                                 39,334                                 37,663                                37,572
Other financial assets                                                                                                                  12,653                                 12,653                                10,186
Trade receivables                                                                                                                       10,865                                 15,816                                14,636
Sundry financial assets                                                                                                                   6,251                                  6,746                                  4,839
Deferred tax assets                                                                                                                     55,657                                 57,887                                56,998
Other assets                                                                                                                              2,021                                  1,978                                  2,858
Non-current assets                                                                                                               1,300,258                              1,322,353                              1,326,564
Inventories and prepayments                                                                                                          550,276                                509,206                                555,977
Contract assets                                                                                                                      636,863                                519,075                                528,280
Trade receivables                                                                                                                    541,644                                570,261                                590,454
Sundry financial assets                                                                                                              220,245                                206,401                                  53,154
Cash and cash equivalents                                                                                                            687,594                                662,024                                589,176
Income tax receivables                                                                                                                  40,748                                 46,634                                28,315
Other assets                                                                                                                            60,961                                 46,379                                73,556
Current assets                                                                                                                   2,738,331                              2,559,980                              2,418,912
Total assets Dürr Group                                                                                                          4,038,589                              3,882,333                              3,745,476

                                                                                                                                                  Interim statement January 1 to March 31, 2020
Consolidated statement of financial position
�����������������������������������������������������������������������������������������������������������������������������������������������������������������������������������������������������������������������������������   21

                                                                                                                                 March 31,                      December 31,                                   March 31,
€k                                                                                                                                   2020                              2019                                        2019
EQUITY AND LIABILITIES
Subscribed capital                                                                                                                   177,157                                177,157                                177,157
Capital reserves                                                                                                                        67,318                                 67,318                                67,318
Revenue reserves                                                                                                                     832,273                                820,820                                798,990
Other comprehensive income                                                                                                           - 42,052                               - 34,654                               - 27,078
Total equity attributable to the shareholders of
Dürr Aktiengesellschaft                                                                                                          1,034,696                              1,030,641                              1,016,387
Non-controlling interests                                                                                                               12,708                                 12,745                                15,453
Total equity                                                                                                                     1,047,404                              1,043,386                              1,031,840
Provisions for post-employment benefit obligations                                                                                      50,487                                 58,962                                51,407
Other provisions                                                                                                                        20,987                                 22,339                                17,945
Contract liabilities                                                                                                                      2,113                                  2,113                                  2,761
Trade payables                                                                                                                               336                                    240                                    891
Bond and Schuldschein loans                                                                                                          698,622                                798,242                                598,120
Other financial liabilities                                                                                                             83,833                                 86,780                                93,533
Sundry financial liabilities                                                                                                              7,978                                  6,290                                  6,271
Income tax liabilities                                                                                                                            -                                      -                              4,164
Deferred tax liabilities                                                                                                                69,789                                 81,151                                91,522
Other liabilities                                                                                                                            190                                    254                                    681
Non-current liabilities                                                                                                              934,335                            1,056,371                                  867,295
Other provisions                                                                                                                     144,400                                148,058                                127,078
Contract liabilities                                                                                                                 791,997                                630,570                                609,946
Trade payables                                                                                                                       468,665                                478,771                                545,370
Bond and Schuldschein loans                                                                                                             99,829                                           -                                      -
Other financial liabilities                                                                                                             39,734                                 38,045                                41,407
Sundry financial liabilities                                                                                                         331,671                                319,890                                349,028
Income tax liabilities                                                                                                                  48,835                                 48,467                                37,673
Other liabilities                                                                                                                    131,719                                118,775                                135,839
Current liabilities                                                                                                              2,056,850                              1,782,576                              1,846,341
Total equity and liabilities Dürr Group                                                                                          4,038,589                              3,882,333                              3,745,476

                                                                                                                                                  Interim statement January 1 to March 31, 2020
Consolidated statement of cash flows
�����������������������������������������������������������������������������������������������������������������������������������������������������������������������������������������������������������������������������������   22

Consolidated statement of cash flows
OF DÜRR A K T IENGE SEL L S CH A F T, S T U T TG A R T, FOR T HE P ERIOD F R OM JA NUA R Y 1 TO M A R CH 31, 2 02 0

€k                                                                                                                                                                            Q1 2020                              Q1 2019
Earnings before income taxes                                                                                                                                                     18,548                               45,895
Income taxes paid                                                                                                                                                                - 9,142                              - 9,733
Net interest                                                                                                                                                                       5,096                                4,704
Profit from entities accounted for using the equity method                                                                                                                          - 462                             - 1,900
Dividends from entities accounted for using the equity method                                                                                                                      1,866                                         -
Amortization, depreciation and impairment of non-current assets                                                                                                                  28,806                               27,115
Net gain/loss on the disposal of non-current assets                                                                                                                                      78                                - 11
Non-cash allowance on cash and cash equivalents                                                                                                                                          -4                                - 75
Other non-cash income and expenses                                                                                                                                                 7,340                                 - 234
Changes in operating assets and liabilities
    Inventories                                                                                                                                                                - 45,569                            - 14,522
    Contract assets                                                                                                                                                         - 125,451                              - 44,765
    Trade receivables                                                                                                                                                            24,454                                 9,226
    Other receivables and assets                                                                                                                                               - 10,488                            - 11,389
    Provisions                                                                                                                                                                   - 3,637                              - 4,435
    Contract liabilities                                                                                                                                                       168,788                             - 73,472
    Trade payables                                                                                                                                                               - 4,391                              36,199
    Other liabilities (other than financing activities)                                                                                                                          23,447                                 4,689
    Other assets and liabilities                                                                                                                                               - 10,604                            - 10,296
Cash flow from operating activities                                                                                                                                              68,675                            - 43,004
Purchase of intangible assets                                                                                                                                                    - 5,724                              - 6,187
Purchase of property, plant and equipment                                          1
                                                                                                                                                                                 - 9,555                           - 11,161
Purchase of other financial assets                                                                                                                                               - 1,000                                         -
Proceeds from the sale of non-current assets                                                                                                                                       1,098                                    497
Acquisitions, net of cash acquired                                                                                                                                               - 1,820                                         -
Investments in time deposits                                                                                                                                                     - 9,116                                    544
Interest received                                                                                                                                                                  1,064                                1,159
Cash flow from investing activities                                                                                                                                           - 25,053                             - 15,148
1
 The item „Purchase of property, plant and equipment” does not include cash outflows from additions to right-of-use assets from leases as
there are no cash outflows at the acquisition date (exception: incidental acquisition cost and prepayments).

                                                                                                                                                  Interim statement January 1 to March 31, 2020
Consolidated statement of cash flows
�����������������������������������������������������������������������������������������������������������������������������������������������������������������������������������������������������������������������������������   23

€k                                                                                                                                                                            Q1 2020                              Q1 2019
Change in current bank liabilities and other financing activities                                                                                                                   - 167                             - 1,025
Repayment of non-current financial liabilities                                                                                                                                        - 37                               - 198
Payments of lease liabilities                                                                                                                                                    - 7,362                              - 5,927
Cash paid for transactions with non-controlling interests                                                                                                                                   -                         - 8,750
Tendering of shares as part of the settlement offer to the shareholders
of HOMAG Group AG                                                                                                                                                                - 1,988                                         -
Interest paid                                                                                                                                                                    - 1,238                                 - 923
Cash flow from financing activities                                                                                                                                           - 10,792                             - 16,823
Effects of exchange rate changes                                                                                                                                                 - 7,270                                9,069
Change in cash and cash equivalents                                                                                                                                              25,560                            - 65,906
Cash and cash equivalents
At the beginning of the period                                                                                                                                                 663,044                              656,695
At the end of the period                                                                                                                                                       688,604                              590,789
Less allowance according to IFRS 9                                                                                                                                               - 1,010                              - 1,613
Cash and cash equivalents at the end of the reporting period
(consolidated statement of financial position)                                                                                                                                687,594                              589,176

                                                                                                                                                  Interim statement January 1 to March 31, 2020
Consolidated statement of changes in equity
�������������������������������������������������������������������������������������������������������������������������������������������������������������������������������������������������������������������������������������������������������������������������������������������������������������������������������������������������������������������������������������������������������������������������������������������������   24

Consolidated statement of changes in equity

OF DÜRR A K T IENGE SEL L S CH A F T, S T U T TG A R T, FOR T HE P ERIOD F R OM JA NUA R Y 1 TO M A R CH 31, 2 02 0

                                                                                                                                                                                                       Other comprehensive income
                                                                                                                                                       Items that are
                                                                                                                                                      not reclassified                  Items that may be reclassified subsequently to
                                                                                                                                                      to profit or loss                                 profit or loss
                                                                                                                                                                                                                                                                                                                          Total equity
                                                                                                                                                                                          Unrealized                                                                                                                      attributable
                                                                                                                                                                                              gains /                  Changes in the                                                                                            to the
                                                                                                                                         Remeasurement                                   losses from                     consolidated                                                        Other                      shareholders                             Non-
                                                                          Subscribed                    Capital                 Revenue of defined benefit                                 cash flow                           group /                        Currency               comprehensive                    of Dürr Aktien-                      controlling
€k                                                                            capital                 reserves                  reserves            plans                                    hedges                  reclassifications                      translation                    income                        gesellschaft                        interests              Total equity
December 31, 2018                                                               177,157                   67,318                  771,468                            - 30,542                      - 2,776                                  608                    - 5,940                         - 38,650                        977,293                         14,858                  992,151
Adjustments IFRS 16                                                                          -                      -               - 9,415                                      -                           -                                   -                       - 43                             - 43                       - 9,458                            - 53                 - 9,511
January 1, 2019                                                                 177,157                   67,318                  762,053                            - 30,542                      - 2,776                                  608                    - 5,983                         - 38,693                        967,835                         14,805                  982,640
Profit for the period                                                                        -                      -               31,133                                       -                           -                                   -                            -                                -                     31,133                          1,852                    32,985
Other comprehensive income                                                                   -                      -                         -                           - 499                    - 1,110                                       -                  13,229                            11,620                         11,620                             180                   11,800
Total comprehensive income,
net of tax                                                                                   -                      -               31,133                                - 499                    - 1,110                                       -                  13,229                           11,620                          42,753                          2,032                   44,785
Options of non-controlling
interests                                                                                    -                      -                 5,799                                      -                           -                                   -                            -                                -                        5,799                      - 1,384                      4,415
Other changes                                                                                -                      -                         5                                  -                           -                                -5                              -                              -5                                -                             -                          -
March 31, 2019                                                                  177,157                   67,318                  798,990                            - 31,041                      - 3,886                                  603                       7,246                        - 27,078                     1,016,387                          15,453               1,031,840

January 1, 2020                                                                 177,157                   67,318                  820,820                            - 38,023                         - 470                                 586                       3,253                        - 34,654                     1,030,641                          12,745               1,043,386
Profit for the period                                                                        -                      -               12,727                                       -                           -                                   -                            -                                -                     12,727                             514                   13,241
Other comprehensive income                                                                   -                      -                         -                           6,356                    - 4,464                                       -                  - 9,285                          - 7,393                         - 7,393                          - 158                  - 7,551
Total comprehensive income,
net of tax                                                                                   -                      -               12,727                               6,356                     - 4,464                                       -                 - 9,285                           - 7,393                           5,334                            356                    5,690
Options of non-controlling
interests                                                                                    -                      -               - 1,279                                      -                           -                                   -                            -                                -                     - 1,279                          - 393                  - 1,672
Other changes                                                                                -                      -                         5                                  -                           -                                -5                              -                              -5                                -                             -                          -
March 31, 2020                                                                  177,157                   67,318                  832,273                            - 31,667                      - 4,934                                  581                    - 6,032                         - 42,052                     1,034,696                          12,708               1,047,404

                                                                                                                                                                                                                                                                                                                                                                Interim statement January 1 to March 31, 2020
Financial calendar and contact
�����������������������������������������������������������������������������������������������������������������������������������������������������������������������������������������������������������������������������������
 �����������������������������������������������������������������������������������������������������������������������������������������������������������������������������������������������������������������������������������   2525

 Financial calendar
 May 28, 2020		                                                Virtual Annual General Meeting

 June 18, 2020 		                                              Quirin Champions, Frankfurt

 August 6, 2020                                                Interim financial report on the first half of 2020,
 				                                                          analyst/investor telephone conference

 August 18, 2020		                                             Bankhaus Lampe Deutschlandkonferenz, Baden-Baden

 September 9, 2020		                                           MainFirst Cross Sector Conference, London

 September 21, 2020		                                          Baader Investment Conference, Munich

 September 22, 2020		                                          Berenberg/GS German Corporate Conference, Munich

 November 5, 2020                                              Interim statement on the first nine months of 2020,
 				                                                          analyst/investor telephone conference

 November 16, 2020		                                           Investors‘ Day, Poland (planned)

 November 24, 2020		                                           DZ Equity Conference, Frankfurt

 Contact
 Further information 			 Dürr AG
 on Dürr AG can be 			   Günter Dielmann
 obtained from:				Mathias Christen
 					Stefan Tobias Burkhardt
 					Corporate Communications & Investor Relations
 					Carl-Benz-Strasse 34
 					74321 Bietigheim-Bissingen
 					Germany

 					                   Tel.: +49 7142 78-1785 / -1381 / -3558
 					Fax: +49 7142 78-1716
 					corpcom@durr.com
 					investor.relations@durr.com

 					www.durr-group.com

 					                                                                                                  This interim statement is the English translation
 					                                                                                                  of the German original. The German version shall prevail.

 This interim statement contains forward-looking statements. As is the case for any business activity conducted in
 a global environment, such forward-looking statements are always subject to uncertainty. Our information is based
 on the conviction and assumptions of the Board of Management of Dürr AG, as developed from the information
 currently available. However, the following factors may affect the success of our strategic and operating measures:
 geopolitical risks, changes in general economic conditions (especially a prolonged recession), exchange rate fluc-
 tuations and changes in interest rates, new products launched by competitors, and a lack of customer acceptance
 for new Dürr products or services, including growing competitive pressure. Should any of these factors or other
 imponderable circumstances arise, or should the assumptions underlying the forward-looking statements prove
 incorrect, actual results may differ from those projected. Dürr AG undertakes no obligation to provide continuous
 updates of forward-looking statements and information. Such statements and information are based upon the
 circumstances as of the date of their publication.

                                                                                                                                                   Interim statement January 1 to March 31, 2020
You can also read