Introducing Chorus New Zealand's largest fixed line communications infrastructure business

Page created by Virginia Butler
 
CONTINUE READING
Introducing Chorus New Zealand's largest fixed line communications infrastructure business
Introducing Chorus
                New Zealand’s largest fixed line communications infrastructure business

25 March 2019
Introducing Chorus New Zealand's largest fixed line communications infrastructure business
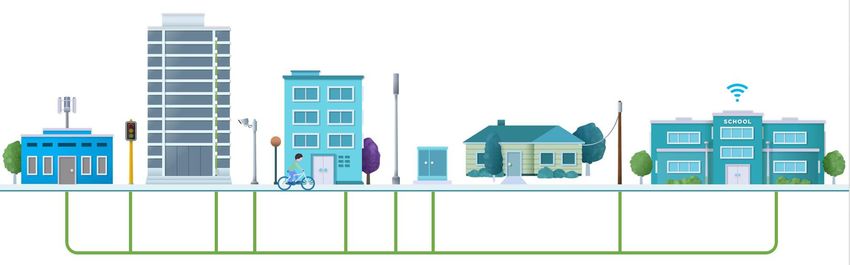
An overview of Chorus
> New Zealand’s largest fixed line communications infrastructure business
    established in Dec 2011 following demerger from Telecom NZ
    listed on NZX and ASX:CNU
    ADR ticker:CHRYY
    ~NZ$2.5 billion market capitalisation (at 20 March 2019)
    S&P “BBB” stable; Moody’s “Baa2” stable

> A nationwide copper and growing fibre (FTTH) network
    ~1.5m connections, including ~1.2m broadband
    70% of way through 11-year fibre to the premises rollout
    ~900 employees supported by ~4,000 contractors/subcontractors
    51% fibre uptake, well ahead of expectations
    streaming video services driving significant data consumption

2   25 March 2019                          INVESTOR ROADSHOW
Introducing Chorus New Zealand's largest fixed line communications infrastructure business
An open access wholesale network

3   25 March 2019         INVESTOR ROADSHOW
Introducing Chorus New Zealand's largest fixed line communications infrastructure business
Our network infrastructure
       Copper VDSL to ~80% of lines; Fibre to pass ~1.36m end customers by 2023
                       Offices: fibre
                       access and ‘fibre
                       to the desktop’                                                         IoT: pole and cabinet
                                                                                               assets provide coverage
Exchange co-                               Fibre to smart      Fibre                           and power
location:                                                      backhaul: to                    infrastructure          School wi-fi trials:
                                           locations:
wireless co-                                                   mobile towers,                                          extend school network to
                                           CCTV, traffic
location and                                                   small cells                                             local students via Chorus
                                           lights
network edge                                                                                                           network
                                                                              FTTP: enabling unlimited
computing
                                                                              data, enhanced wi-fi and
                                                                              TV broadcast capability

       ~600                                                               ~11,000 cabinets                  ~280,000 poles
       exchanges

                                                     ~30,000km duct network

   4   25 March 2019                                        INVESTOR ROADSHOW
Introducing Chorus New Zealand's largest fixed line communications infrastructure business
New Zealand is taking fibre further

> Ultra-fast broadband (UFB): a Government objective
  ▪ original objective (UFB1): fibre to premises covering 75% of
        population by 2020

     ▪ subsequent agreements (UFB2 and UFB2+) extended
        coverage goal to 87% of population by the end of 2022

> Chorus was awarded ~75% of the fibre rollout

     ▪ requirement that Chorus split from Telecom NZ to
        participate: demerger in December 2011

     ▪ Crown partnerships with four fibre companies: Chorus,
        Enable, Northpower, Ultrafast Fibre (WEL Networks)

5    25 March 2019                               INVESTOR ROADSHOW
Introducing Chorus New Zealand's largest fixed line communications infrastructure business
Crown financing
      $800m received at 31 December from Crown Infrastructure Partners (CIP)
> up to $1.33 billion available by 2023 (57:43 equity/debt)                                              AS AT 31 DECEMBER
                                                                                                              drawn    undrawn
    ▪ CIP equity securities
      •   unique class of security with no right to vote at shareholder meetings, but
          entitle the holder to a right to repayment preference on liquidation                   76.5        76.5
      •   an increasing portion of the securities will attract dividend payments from 30
          June 2025 onwards
      •   the dividend rate is based on 180 day NZ bank bill rate, plus 6% p.a. margin
      •   may be redeemed at any time by cash payment of total issue price or the
          issue of Chorus shares (at a 5% discount to the 20-day VWAP for Chorus
                                                                                           $m    388          388
          shares)
                                                                                                                         278

    ▪ CIP debt securities                                                                                                          105
      •   unsecured, non-interest bearing and carry no voting rights at shareholder
                                                                                                                          24
          meetings
                                                                                                 UFB1      UFB1 DEBT   UFB2/2+   UFB2/2+
      •   Chorus is required to redeem the securities in tranches from 30 June 2025 to          EQUITY                  EQUITY    DEBT
          2036 by repaying the issue price to the holder

6     25 March 2019                                        INVESTOR ROADSHOW
Introducing Chorus New Zealand's largest fixed line communications infrastructure business
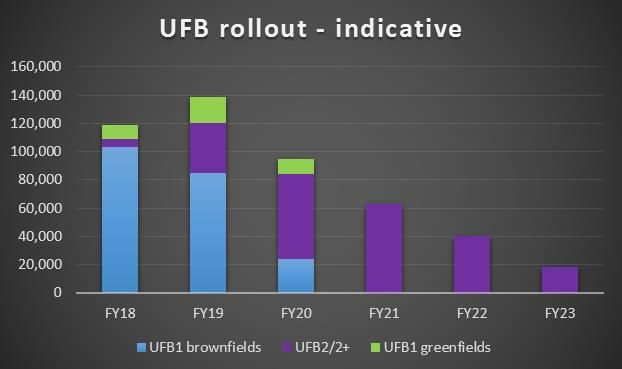
FY19 is peak communal build year

          ~120,000 brownfields premises to be passed across UFB1 and UFB2
          expect to claim another ~18k UFB1 greenfields premises already passed in prior years

Programme guidance                        Notes                                           No. of
                                                                                          premises
UFB1 communal      $1.75 - $1.8 billion   Tracking towards the top end of guidance
                                          and excludes growth (e.g. additional splitter
                                          investment)
UFB1 cost to       $1,050 - $1,250        For a standard residential connection,
connect (CPPC)                            including layer 2 and service desk costs,
                                          and in 2011 dollars. Tracking towards the
                                          top half of the range.
UFB2* communal     $505 - $565 million    Combined guidance range for UFB2 and 2+

UFB2* cost to      $1,650 - $1,850        In 2017 dollars and including layer 2,
connect                                   backbone costs for MDUs and rights of way
                                          with 10 or fewer premises and service desk
                                          costs
* combined UFB2 and 2+ rollout plans

  7   25 March 2019                                          INVESTOR ROADSHOW
Introducing Chorus New Zealand's largest fixed line communications infrastructure business
UFB rollout 70% complete; 51% uptake                                                                                                                             Uptake

No. of              UFB rollout and uptake                                              Uptake
                                                                                                              Fibre orders completed as a % of fibre
connections
1,400,000                                                                                   100%             capable addresses (by months available)
                                                                                                   60%

                       UFB connections                UFB available addresses               90%
1,200,000
                                                                                            80%    50%
                       Planned footprint              % Uptake (RHS)
1,000,000                                                                                   70%
                                                                                                   40%
                                                                                            60%
 800,000
                                                                                            50%
                                                                                                   30%
 600,000
                                                                                            40%

 400,000                                                                                    30%    20%

                                                                                            20%
 200,000                                                                                           10%
                                                                                            10%

        0                                                                                   0%
                                                                                                   0%
                                                                                                         0     6     12    18   24     30      36      42   48   54    60      66

Premises to pass by Dec 2022                                 ~1,054,000*                                      2013   Jan-June        2013   July-Dec        2014 Jan-June
                                                                                                              2014   July-Dec        2015   Jan-June        2015 July-Dec
                                                                                                              2016   Jan-June        2016   July-Dec        2017 Jan-June
Customers able to connect                                    ~1.36 million
                                                                                                              2017   July-Dec        2018   Jan-June
                                    *Includes estimated 43k greenfields premises for UFB1

       8      25 March 2019                                                        INVESTOR ROADSHOW
Introducing Chorus New Zealand's largest fixed line communications infrastructure business
Record fibre demand and customer satisfaction
    Achieved 50% ‘fibre in a day’ target                      Fibre installations
                                                  20,000

                                                  18,000

                                                  16,000

                                                  14,000

                                                  12,000

                                                  10,000

                                                   8,000

                                                   6,000                      FY18     FY19
                                                   4,000

                                                   2,000

                                                       -
                                                           July Aug Sept Oct Nov Dec Jan Feb Mar April May June

9   25 March 2019                  INVESTOR ROADSHOW
Introducing Chorus New Zealand's largest fixed line communications infrastructure business
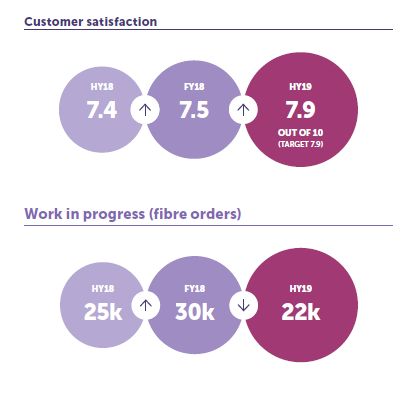
Transition to a regulated utility

25 March 2019
Legislation passed in November 2018
 > New regulatory framework to be implemented to replace UFB contractual framework (UFB1 ends Dec 2019)

           87% of population where fibre will be available by end of 2022                              Remaining 13% of population

      Fibre access network                              Where fibre is available:                       Where fibre is not available:

      •   Regulated asset base (RAB) with revenue       •   Copper network to be deregulated and        •     Copper remains regulated and TSO
          cap to be determined by Commerce                  Telecommunications Service Obligation             applies
          Commission                                        (TSO) removed                               •     Copper pricing capped at 2019 levels
      •   Two fibre anchor products (voice only +       •   Chorus can withdraw copper service,               with CPI adjustments
          entry level broadband) at 2019 prices + CPI       subject to minimum consumer                 •     Commission required to review pricing
      •   3 years after new regime commences, the           protection requirements                           framework no later than 2025
          Commission can review the revenue cap
          model and anchor products, subject to                                                     Note: existing copper regulatory framework uses benchmarking and Total
          specified conditions and statutory criteria                                               Service Long Run Incremental Cost, with pricing last set in late 2015 for a
                                                                                                    5-year period

                                                                                                    Regulated copper             Line only             With broadband
                                                                                                    pricing                      (monthly)             (monthly)

                                                                                                    From mid Dec 2018            $31.19                $42.02

                                                                                                    From mid Dec 2019            $31.68                $42.35

11   25 March 2019                                              INVESTOR ROADSHOW
Regulated Asset Base implementation
     > Commerce Commission will determine the starting value of the RAB, regulatory WACC, cost allocations, expenditure
        allowances and maximum allowable revenue

                                                                        Building block
                                                                          cost stack

12     25 March 2019                              INVESTOR ROADSHOW
Implementation of new fibre framework
      > Commerce Commission to complete process by 1 January 2022
                Input methodologies: emerging views paper due in May; draft decision in November

     Transition period:                                          First regulatory period:
     1 December 2019 to January 2022                             1 January 2022 to January 2025
Chorus can charge up to the product price caps                   Start of first regulatory period under new RAB
agreed with Crown Infrastructure Partners. Price caps            framework
‘frozen’ until 2022, with annual CPI adjustment in July
• voice only: $25                                                Price caps and CPI adjustments continue for voice
• 30/10Mbps: $42.50                                              service, broadband service (product to be
• 100/20Mbps: $46                                                confirmed) and Direct Fibre Access Service
• 200/20Mbps: $55
• 1Gbps: $65                                                     Price caps are removed from other products
• Direct Fibre Access Service: $355
                                                                 Unbundled fibre to be available in UFB2/2+ areas
Unbundled fibre (commercial price) to be available in            from January 2026
UFB1 areas from January 2020.

13   25 March 2019                                INVESTOR ROADSHOW
Key implementation parameters
Parameters                Chorus view
Asset valuation           RAB to include all assets supporting fibre access services, including fibre in LFC areas.
                          Valuation method defined by Act as actual cost incurred for post 2011 assets; book value
                          for pre-existing. The Commission has acknowledged real financial capital maintenance as
                          key principle underpinning the building block model.
Depreciation              Act requires straight line depreciation for initial RAB valuation.
Allocation of shared      No method prescribed in Act. The Commission will need to determine allocation for initial
costs between fibre       RAB valuation and then principles for cost allocation after the implementation date.
access and other          Precedent is accounting based cost allocation, but more complexity for telco networks
services                  given high degree of asset sharing and rapidly growing fibre uptake.
Unrecovered losses        Act prescribes adding an asset to RAB to enable recovery of financial losses on
                          investment prior to implementation. The Commission has proposed using a building block
                          methodology.
Crown financing           Act requires actual cost of Crown financing to be considered in valuing the financial
                          losses asset, but no method prescribed. Commission should recognise CIP financing was
                          not costless given contractual terms and financing structure.
WACC                      WACC to be set for loss calculation period and for post implementation period. Nature of
                          Chorus/fibre business and international comparators support WACC uplift.

     14   25 March 2019                          INVESTOR ROADSHOW
Proposed RAB framework similar to NZ electricity sector
      Growing number of wholesale communication network comparators
Country     Company      Business type       Market       EV/EBITDA      Net Debt     Credit rating       WACC
                                             cap                         /EBITDA
New         Vector       Electricity         NZ$3.5b      10.9x 2        4.37x        BBB – S&P           In April 2018 the NZ Commerce Commission
Zealand                  distribution                                                 Baa1 – Moody’s      determined a FY19 WACC of 5.19% (post tax, 67th
                         network                                                                          percentile) for electricity distribution businesses
New         Chorus       Wholesale           NZ$2.5b      7.1x 2         3.82x        BBB – S&P           Fibre WACC yet to be determined under new
Zealand                  communications                                               Baa2 – Moody’s 1    regulatory framework. In Dec 2015, the NZ
                         network (copper                                                                  Commerce Commission determined WACC of
                         + fibre)                                                                         5.56% (post tax, 50th percentile) for Chorus’
                                                                                                          legacy network
Singapore   Netlink      Wholesale           NZ$3.4b      15x 2          2.2x 2       Not rated           In 2017, IMDA - the Singapore regulator -
            NBN          communications                                                                   determined WACC of 7% (pre-tax) under a RAB
            Trust        network (fibre                                                                   framework for the Jan 2018 to Dec 2022 period
                         only)
Czech       CETIN        Wholesale           Not listed                               BBB – Fitch         In 2015, CTU - the Czech regulator - determined
Republic                 communications                                               Baa2 – Moody’s      WACC (post tax) of 9.07% for NGA network and
                         network (fixed +                                                                 6.39% for legacy network 3
                         mobile)
                                             Source: Financial metrics based on Bloomberg data as at 20 March 2019

1. Moody’s Investor Services has noted Chorus’ transition to a regulated utility model could support a higher leverage profile within the Baa2 credit rating.
2. Based on trailing 12 month financials.
3. In 2016, a European Commission report recommended higher WACCs be applied to Next Generation Access networks to reflect different characteristics
from legacy networks, including systematic demand risks, intensive capital leverage and long-term pay-offs.

       15   25 March 2019                                           INVESTOR ROADSHOW
Broadband: the 4th utility

25 March 2019
NZ market: population and premises growth
            Broadband uptake by retailer (all technology)                                          NZ broadband market – by technology
1,800,000                                                                      1,800,000

1,600,000                                                                      1,600,000

1,400,000                                                                      1,400,000

1,200,000                                                                      1,200,000

1,000,000                                                                      1,000,000

 800,000                                                                        800,000

 600,000                                                                        600,000

 400,000                                                                        400,000

 200,000                                                                        200,000

      -                                                                              -

                                                                                  Chorus xDSL                   Chorus mass market fibre    Chorus premium fibre
              Spark   Vodafone   Vocus   2degrees   Trustpower   ROM
                                                                                  Local fibre companies (UFB)   Other fibre networks        Other xDSL
                                                                                  Vodafone cable                Fixed (mobile) wireless     Legacy fixed wireless, satellite
                                     Source: IDC                                                                              Source: IDC

       17   25 March 2019                                              INVESTOR ROADSHOW
Chorus connection trends
                                                                                     1600000
                            31 Dec   31 March     30 June     30 Sept      31 Dec
                             2017        2018       2018        2018        2018
                                                                                     1400000
                                                                                                     Baseband copper
Unbundled                   68,000     62,000      53,000      45,000      39,000
copper                                                                                               Unbundled copper
                                                                                     1200000
Baseband                   290,000    279,000     268,000     255,000     244,000
copper
(no broadband)                                                                       1000000
                                                                                                     Copper ADSL
Fibre broadband            362,000    394,000     433,000     479,000     517,000
(GPON)
                                                                                     800000
VDSL                       320,000    325,000     321,000     309,000     295,000
(includes naked)

                                                                                     600000
Copper ADSL                499,000    465,000     433,000     402,000     374,000
(includes naked)                                                                                     VDSL
Data services                7,000      6,000       6,000       5,000        5,000   400000
(copper)

Fibre premium               13,000     12,000      12,000      12,000      12,000
(P2P)                                                                                200000          Fibre (GPON)
Total connections        1,559,000   1,543,000   1,526,000   1,507,000   1,486,000
                                                                                           0
                                                                                         30-Jun-17   30-Sep-17   31-Dec-17   31-Mar-18     30-Jun-18   30-Sep-18   31-Dec-18
                                                                                               Data services (copper)                    Fibre premium (P2P)
                                                                                               Fibre broadband (GPON)                    VDSL
                                                                                               Copper ADSL                               Unbundled copper (no broadband)
                                                                                               Baseband copper (no broadband)

           18      25 March 2019                                 INVESTOR ROADSHOW
Connection movements by Zone
                                                                                               INDICATIVE CONNECTION
                                                                                                  CHANGES BY ZONE
> Total fixed line connections decreased by 40k to
     1,486,000 (H1 FY18:-43k)                                                      Copper (no broadband)                 Broadband (fibre or copper)
     ▪ copper lines with no broadband decreased by 38k,                                                                                  LOCAL FIBRE
        mostly in Chorus UFB areas                                               CHORUS UFB                                              COMPANY UFB
                                                                                   ZONE*                            RURAL                   ZONE
     ▪ 1k reduction in data services over copper

                                                                                              13
> Total broadband connections decreased by 1k to

                                                                                                   5
     1,186,000 (H1 FY18:-5k)                                     Change in
                                                                 connections     Q1    Q2                      Q1 Q2 Q1                   Q1 Q2 Q1 Q2

                                                                                                                              0
     ▪ strong growth in Chorus UFB areas, offsetting             (‘000s)
                                                                                              Q1    Q2
                                                                                                                              Q2

                                                                                                                    -1

                                                                                                                         -1
        reductions in LFC areas

                                                                                                               -2

                                                                                                                                          -4

                                                                                                                                               -4
     ▪ VDSL and vectoring upgrades helping limit rural

                                                                                                                                                    -9

                                                                                                                                                         -9
        wireless effect

                                                                                       -12
     ▪ Note: disconnections typically higher in Q2

                                                                                 -15
                                         Total connections at 31 Dec**         1,099,000                    202,000                    168,000
                                         Broadband connections                 922,000                      153,000                    111,000
                                         Copper (no broadband)                 177,000                      49,000                     57,000
                                         connections
                                                                                             * Includes planned UFB1, 2 and 2+ coverage
                                                                                             **Excludes 17k fibre premium and data services (copper) connections

19    25 March 2019                                INVESTOR ROADSHOW
Fibre connections pass 500k
              Total mass market fibre uptake by plan type                                 > 84,000 mass market fibre connections added in H1
        100                                                                                  ▪ 71% of mass market fibre connections on 100Mbps
                                                                          $65 monthly
         90                                                               $55 monthly
                                                                                             ▪ 44,000 connections on gigabit plans (FY18: 30,000)
         80
                                                                                             ▪ glide path announced for 1Gbps pricing:
                                                                                               •   Residential: $60 from July 2019; $56 from July 2020
         70
                                                                                               •   Business: $75 currently; $70 from July 2019; $66 from
         60                                                              $45 monthly               July 2020
         50
% of
plans    40

         30

         20

         10                                                            $41.50 monthly

          0

         50Mbps     100Mbps   200Mbps   Gigabit   Education   Business 100Mbps+   Other

    20        25 March 2019                                                INVESTOR ROADSHOW
Stream big
     Shift to online delivery steps up
      new Freeview smartvu device streams
       channels without need for TV aerial or
       satellite dish

      Vodafone leveraging Sky Sport via
       their Vodafone TV platform

      Spark launching sports streaming
       service

21   25 March 2019                         INVESTOR ROADSHOW
Streaming is driving shift to unlimited data plans
       71% of NZ broadband connections have no data cap
                              Share of connections by data cap
100%
        5%             8%
90%
                                                                                 Unlimited
                                      33%
80%
                                                    50%
70%                                                                              100GB or more
                                                                 62%
                                                                        71%
60%
                                                                                 50GB to 100GB
50%

40%                                                                              20GB to 50GB

30%
                                                                                 5GB to 20GB
20%

10%
                                                                                 Under 5GB
                                                                                                 , 2018
 0%
   2013                2014           2015          2016         2017     2018

       Source: Statistics NZ ISP Survey June 2018

22     25 March 2019                                       INVESTOR ROADSHOW
Data demand isn’t slowing
> Monthly average data usage per connection on our                               > Traffic at peak time has almost doubled since 2017
     network grew to 235GB from 210GB (June 2018)
     ▪ 315GB on fibre (June:297GB)
     ▪ 174GB on copper (June:160GB)

                                                     Network throughput (Gbps)
                                                                                                              Time of day

23   25 March 2019                          INVESTOR ROADSHOW
1,000 Gigabytes per month by 2023…
     Video content and 4K, 8K to drive usage

     Application requirements in Mbps
                                                                      Chorus forecast: average monthly
                                                                           broadband usage (GB)
                                                            GB
                                                           1400                           Copper     Fibre

                                                           1200

                                                           1000

                                                            800

                                                            600

                                                            400

                                                            200

                                                                 0
Source: Cisco VNI, Forecast and Trends, 2017-2022                    June 2019 June 2020 June 2021 June 2022 June 2023 June 2024

24   25 March 2019                                  INVESTOR ROADSHOW
Innovation
      trialling 10 Gigabit PON and wireless PON

      infrastructure re-use trialled for IoT delivery

      ‘fibre to the desktop’ concept trials in two
       schools and two new office premises

      school trials proving wi-fi potential to bridge
       digital divide

      network edge computing: three exchange sites
       under development for Q3 FY19

      4K TV trial: clear medium term potential for               Passive fibre infrastructure for ~400 desks, removing
       broadcasting role                                          need for legacy IT rackspace and related investment.

25   25 March 2019                            INVESTOR ROADSHOW
Capital and financial
                   management

25 March 2019
Capital management                                                       > The Chorus Board considers that a ‘BBB’ credit
                                                                                          rating or equivalent credit rating is appropriate
                                                                                          for a company such as Chorus. It intends to
                                                                                          maintain capital management and financial
                                                                                          policies consistent with these credit ratings.

                                                                                  > FY19 dividend guidance of 23 cps, subject to
                                                                                          no material adverse changes in circumstances or
                                                                                          outlook.

                                                                                  > A Dividend Reinvestment Plan has been
                                                                                          available to NZ and Australian resident
                                                                                          shareholders with a 3% discount to prevailing
                                                                                          market price

                                    During the UFB build programme to 2020, the Board
     FY12*: prorated for the post
     demerger period of seven
                                    expects to be able to provide shareholders with
     months                         modest dividend growth from a base of 20cps paid
                                    for FY16, subject to no material adverse changes in
                                    circumstances or outlook.

27       25 March 2019                                             INVESTOR ROADSHOW
> At 31 Dec, debt of $2,362m comprised:
                                                                    ▪ Long term bank facilities of $350m undrawn;
                                                                    ▪ NZ bond: $400m and $500m
       Debt                                                         ▪ Euro Medium Term Notes $1,462m (NZ$ equivalent at
                                                                         hedged rates)
                                      As at
                                   31 Dec 2018                   Term debt profile
                                       $m
                                                                                                 CIP debt securities available
    Borrowings                          2,362                                                    Face value of CIP debt securities issued
                                                                   800
    + PV of CIP debt                     137                       700                           EUR EMTN
    securities (senior)                                                                          NZ Bond
                                                            NZ     600
    + Net leases payable                 238                $M                                   GBP EMTN
                                                                   500
    Sub total                           2,737                      400                     785
                                                                               677
    - Cash                              (281)                      300
                                                                                                            500                             72
    Total net debt                     2,456                       200               400                                         60
                                                                                                 14                  33
    Net debt/EBITDA                  3.82 times                    100
                                                                                                                                            137
                                                                                                 72                 72           107
                                                                    0
     Financial covenants require senior net debt/EBITDA
      ratio to be no greater than 4.75 times
     S&P rating down driver adjusted debt/EBITDA
      greater than 4x for a sustained period

28     25 March 2019                                       INVESTOR ROADSHOW
FY19 guidance summary
      FY19 EBITDA                                                         $625 – 645m

      FY19 Gross capex                                                   $820 – $860m

      Fibre capex                                                       $685m - $715m

      Fibre connections & layer 2 capex   $310m - $340m (based on mass market 175,000-195,000 fibre connections,
                                                 and 19,000 backbone builds and including service desk costs)

      Copper capex                                                        $75m - $95m

      Common capex                                                        $55m - $70m

      UFB1 Cost Per Premises Passed                                     $1,500 - $1,600
      (CPPP)
      UFB2/2+ communal capex                                              $90m - $110m
                                          (based on estimated starting premises of 45,000 to 55,000 and premises handed
                                                                     over of 25,000 to 35,000)
      UFB1 Cost Per Premises Connected                                    $1,000 - $1,150
      (CPPC)                               (excluding layer 2 and including standard installations and some non-standard
                                                               single dwellings and service desk costs)

29   25 March 2019                          INVESTOR ROADSHOW
Capex: common and copper
     Common capex                      H1 FY19   H2 FY18   H1 FY18
                                         $m        $m        $m
     Information technology                 17        18         17
     Building & engineering services         7        11          9

     Other                                   1         3          0
     Subtotal                               25        32         26

     Copper capex                      H1 FY19   H2 FY18   H1 FY18
                                         $m        $m        $m
     Network sustain                        19        29         16   >   ongoing investment in poles, proactive
                                                                          maintenance and roadworks projects
     Copper connections                      1         1          1
     Copper layer 2                          6        18         16   >   reduced spend following end of ~$20m VDSL
                                                                          vectoring rollout in FY18
     Product                                 1         2          2
     Customer retention costs               12        18         29   >   reducing as incentives are more targeted and RSP
                                                                          focus shifts from VDSL to fibre uptake
     Subtotal                               39        68         64

30   25 March 2019                           INVESTOR ROADSHOW
Capex: Fibre

        Cost per UFB1 premises passed (CPPP): ~$1,662 vs $1,500 - $1,600 guidance
        38,000 premises passed (H1 FY18 32,000) included 13,000 UFB 2/2+ premises
        ~80,000 brownfields premises to be completed in H2 FY19

     Fibre capex                    H1         H2     H1
                                   FY19       FY18   FY18
                                    $m         $m    $m

     UFB communal                    119       118    113     >   UFB1 rollout $78m; UFB2/2+ rollout $41m

     Fibre connections & layer 2     161       149    145     >   95,000 new installations in H1 FY19 (H1 FY18: 77,000)

     Fibre products & systems             7      7     10
     Other fibre connections &        36        37     28     >   pole replacement programme and growing housing demand
     growth
     Customer retention costs             8      8        5   >   targeted RSP campaigns to drive fibre uptake and win back off-net
                                                                  connections
     Subtotal                        331       319    301

31   25 March 2019                              INVESTOR ROADSHOW
Capex: Fibre connections & layer 2
     Connections capex of $161m
         Cost per UFB1 premises connected (CPPC): $1,038* vs $1,000 - $1,150 guidance
          * excludes layer 2 and includes standard installations, some non-standard single dwellings and service desk costs
         95,000 single dwelling unit and apartment connections completed (includes 5,000 UFB2)
         Layer 2 spend reducing as UFB1 rollout comes to an end; ongoing spend for UFB2/2+, growth and bandwidth demand

     Fibre connections & layer 2 capex                                            H1 FY19                H2 FY18                H1 FY18

     Layer 2 (long run programme average of $100 per connection)                      $9m                  $16m                   $16m
     Premium business fibre connections                                             $4m                    $5m                     $6m
                                                                               600 connections        600 connections         800 connections
     Single dwelling units and apartments connections                              $100m                   $79m                    $84m
                                                                               95k connections        79k connections         77k connections
     Backbone build: multi-dwelling units and rights of way                         $48m                   $49m                    $39m
     * Estimated 55-60% requiring backbone build now completed                 9.5k completed         7.3k completed          5.8k completed
     TOTAL SPEND                                                                     $161m                $149m                  $145m

32   25 March 2019                                               INVESTOR ROADSHOW
Income statement
                                            H1      H2      H1
                                           FY19    FY18    FY18
                                            $m      $m      $m
 Operating revenue                           489     491       499    >    total connections decreasing

 Operating expenses                        (171)   (167)   (170)
 Earnings before interest, tax,             318     324        329
 depreciation and amortisation
 (EBITDA)
 Depreciation and amortisation             (196)   (195)   (192) >        increasing as a result of long life assets

 Earnings before interest and income tax     122     129       137
 Net interest expense                       (79)    (74)       (70) >     NZ$500 million bond issued in December, Crown
                                                                          funding notional interest increasing
 Net earnings before income tax               43      55        67
 Income tax expense                         (13)    (17)       (20)
 Net earnings for the period                  30      38        47

33   25 March 2019                         INVESTOR ROADSHOW
Revenue
                          H1      H2          H1
                         FY19    FY18        FY18
                          $m      $m          $m
Fibre broadband (GPON)     136     108          90   >   revenue growing as fibre uptake increases

Fibre premium (P2P)         37      38          40   >   some churn to lower input fibre services or other networks

Copper based voice          56      64          69
                                                         copper revenues declining as customers migrate to fibre or competing
Copper based               181     202         219
                                                         fibre/wireless networks. Annual increase in regulated copper line and
broadband                                                broadband pricing in mid December.
Data services copper        10      13          14
Field Services              39      35          35   >   increase in chargeable network relocation and subdivision activity

Value added network         16      16          17
services
Infrastructure              12      11          12
Other                       2           4        3
Total                     489     491          499

34   25 March 2019                          INVESTOR ROADSHOW
Expenses
                        H1     H2     H1
                       FY19   FY18   FY18
                        $m     $m     $m
Labour                  37     34     39    >   6% reduction in staff numbers from H1 FY18; offset partially by CPI increases

Provisioning            3      2      4
Network maintenance     38     44     43    >   fault volumes reducing overall, helped by fewer extreme weather events and
                                                retailers using API tools to reduce unnecessary truck rolls
Other network costs     18     19     15    >   increase in third party requests for network relocation activity
IT                      26     27     27
Rents, rates and        13     13     11    >   rates increasing as fibre network expands
property maintenance
Regulatory levies       8      6      7
Electricity             9      7      8
Consultants             4      2      3
Insurance               2      2      1
Other                   13     11     12
Total                  171    167    170

35   25 March 2019                   INVESTOR ROADSHOW
Our focus
      connecting more customers to fibre, while continuing to lift satisfaction levels
      growing broadband connections and enhancing our product portfolio
      continuing to shape our business for a fibre future

     To achieve our objective to return to modest EBITDA
     growth in FY20, subject to no material changes in
     expected regulatory environment or competitive
     outlook

36   25 March 2019                           INVESTOR ROADSHOW
Appendices

25 March 2019
Appendix A: Understanding network maintenance
       Fibre uptake initially reduces variable copper costs only
       ▪ Rural areas are disproportionately more expensive to maintain than                % FY18 lines             % FY18 reactive
            urban areas                                                                                             maintenance cost
       ▪    Copper costs don’t reduce in proportion to the number of connections –
            there is a significant fixed element
       ▪    Fibre share of maintenance will grow, but at a lesser rate than copper
            because variable fault rate is lower on fibre (although costlier to fix)
       ▪    In the long run, we think there is around an annual $10m saving from
            full copper to fibre migration in Chorus UFB areas                                         Chorus UFB
                                                                                                       Rural (non-UFB)
                                                                                                       LFC UFB

                                                                                             FY18 reactive maintenance
                                                                                                     spend $m
                                                                                                                8
                                                                                                                              Fibre
Copper maintenance:        Exchange + feeder   Cabinet to street   In boundary (excludes
urban (indicative)         cable               boundary            home wiring)                   36                          Copper -
                                                                                                                              fixed
Fixed                      30%                 70%                 0%                                                    31
                                                                                                                              Copper -
Variable                   20%                 40%                 40%                                                        variable

  38       25 March 2019                                  INVESTOR ROADSHOW
Appendix B: copper deregulated in fibre areas from
     January 2020
     Fibre uptake is above 71% in 10 exchange areas
     Exchange area       Region             Fibre penetration:   Fibre penetration:
     (>1,000                                % of total Chorus    % of Chorus
     connections)                           connections          broadband
                                                                 connections
     Whitby              Wellington                82%                  83%
     Corstorphine        Dunedin                   74%                  78%
                                                                                      ▪ within our UFB1 areas, there
     Lynmore             Rotorua                   73%                  78%             are ~350 nodes (approx. 200
     Ngongotaha          Rotorua                   73%                  77%             customers) with fewer than
                                                                                        10 copper connections
     Halfway Bush        Dunedin                   73%                  79%
                                                                                        remaining
     North East Valley   Dunedin                   72%                  76%
     Kelvin Grove        Palmerston North          71%                  79%
     Browns Bay          Auckland                  71%                  76%
     Belmont             Wellington                71%                  74%
     Gleniti             Timaru                    71%                  77%

39   25 March 2019                              INVESTOR ROADSHOW
Disclaimer
This presentation:
• Is provided for general information purposes and does not constitute investment advice or an offer of or invitation to purchase Chorus
securities.
• Includes forward-looking statements. These statements are not guarantees or predictions of future performance. They involve known
and unknown risks, uncertainties and other factors, many of which are beyond Chorus’ control, and which may cause actual results to
differ materially from those contained in this presentation.
• Includes statements relating to past performance which should not be regarded as reliable indicators of future performance.
• Is current at the date of this presentation, unless otherwise stated. Except as required by law or the NZX Main Board and ASX listing
rules, Chorus is not under any obligation to update this presentation, whether as a result of new information, future events or otherwise.
• Should be read in conjunction with Chorus’ audited consolidated financial statements for the year to 30 June 2018 and NZX and ASX
market releases.
• Includes non-GAAP financial measures such as "EBITDA”. These measures do not have a standardised meaning prescribed by GAAP and
therefore may not be comparable to similar financial information presented by other entities. They should not be used in substitution for,
or isolation of, Chorus' audited consolidated financial statements. We monitor EBITDA as a key performance indicator and we believe it
assists investors in assessing the performance of the core operations of our business.
• Has been prepared with due care and attention. However, Chorus and its directors and employees accept no liability for any errors or
omissions.
• Contains information from third parties Chorus believes reliable. However, no representations or warranties (express or implied) are
made as to the accuracy or completeness of such information.

  40   25 March 2019                                    INVESTOR ROADSHOW
You can also read