Invest Malaysia Kuala Lumpur 2019 - SIME DARBY PLANTATION BERHAD
←
→
Page content transcription
If your browser does not render page correctly, please read the page content below
SIME DARBY PLANTATION BERHAD
Invest Malaysia Kuala Lumpur 2019
19 – 20 March 2019
2

Disclaimer
This document is strictly confidential to the recipient. It is being supplied to you solely for your information and may not be reproduced, redistributed or passed
on, directly or indirectly, to any other person or published, in whole or in part, for any purpose. Upon request, you shall promptly return this document all other
information made available in connection with this document, without retaining any copies. The distribution of this document in other jurisdictions may be
restricted by law, and persons into whose possession this document comes should inform themselves about, and observe, any such restrictions.

This document does not constitute and is not an offer or invitation to sell, or any solicitation of any offer to subscribe for or purchase any securities of any
company referred to in this document in any jurisdiction. The companies referred to herein have not registered and do not intend to register any securities
under the US Securities Act of 1933, as amended (the “Securities Act”), and any securities may not be offered or sold in the United States absent registration
under the Securities Act or an exemption from registration under the Securities Act. By attending the presentation you will be deemed to represent, warrant and
agree that to the extent that you purchase any securities in any of the companies referred to in the presentation, you either (i) are a “qualified institutional
buyer” within the meaning of Rule 144A under the Securities Act, or (ii) you will do so in an “offshore transaction” within the meaning of Regulation S under the
Securities Act

By attending this presentation and accepting a copy of this document, you represent and warrant that (i) you have read and agreed to comply with the contents
of this notice; (ii) you will maintain absolute confidentiality regarding the information contained in this document including information presented orally or
otherwise in accordance with your confidentiality obligation; and (iii) you are lawfully able to receive this document and attend this presentation under the laws
of other jurisdiction in which you are subjected and other applicable laws.

This document is for the purposes of information only and is not intended to form the basis of any investment decision. This presentation may contain forward-
looking statements by Sime Darby Plantation that reflect management’s current expectations, beliefs, intentions or strategies regarding the future and
assumptions in light of currently available information. These statements are based on various assumptions and made subject to a number of risks, uncertainties
and contingencies and accordingly, actual results, performance or achievements may differ materially and significantly from those discussed in the forward-
looking statements. Such statements are not and should not be construed as a representation, warranty or undertaking as to the future performance or
achievements of Sime Darby Plantation and Sime Darby Plantation assumes no obligation or responsibility to update any such statements.

No representation or warranty, express or implied, is given by or on behalf of Sime Darby Plantation or its related corporations (including without limitation, their
respective shareholders, directors, officers, employees, agents, partners, associates and advisers) (collectively, the “Parties”) as to the quality, accuracy,
reliability, fairness or completeness of the information contained in this presentation or its contents or any oral or written communication in connection with the
contents contained in this presentation (collectively, the “Information”), or that reasonable care has been taken in compiling or preparing the Information. None
of the Parties shall be liable or responsible for any budget, forecast or forward-looking statements or other projections of any nature or any opinion which may
have been expressed or otherwise contained or referred to in the Information.

The Information is and shall remain the exclusive property of Sime Darby Plantation and nothing herein shall give, or shall be construed as giving, to any
recipient(s) or party any right, title, ownership, interest, license or any other right whatsoever in or to the Information herein. The recipient(s) acknowledges and
agrees that this presentation and the Information are confidential and shall be held in complete confidence by the recipient(s).

All the images, pictures and photos including design drawings in relation to the company’s property development projects contained in this document are artist
impression only and are subject to variation, modifications and substitution as may be recommended by the company’s consultants and/or relevant authorities.
Table of Contents
 SECTION                                    PA G E
 1   Company Overview                         4
 2   Key Investment Highlights                9

 3   Business Strategies & Future Plans       25

 4   Industry Outlook                         39

 5   Financial Overview                       46
     Snapshot of Financial Performance in
 6                                            53
     FP December 2018
 7   Appendix                                 58
Company Overview
5
Business Overview
Integrated Plantation Company Involved in the Entire Palm Oil Value Chain
Upstream Downstream Others
Oil palm estate Mill Refinery Food application High-yielding Renewables
genome seeds
Oil palm, rubber & sugarcane estates Bulk and refined oils & fats R&D
Developing, cultivating and managing Production and sales of refined oils Focused on yield and productivity
oil palm, rubber and sugarcane and fats (which includes specialty and improvements, increasing revenue
plantation estates end-user oils and fats) streams and developing sustainable
practices while pursuing innovative
Milling of FFB and processing & sales Oleochemicals, biodiesel products & strategies
Milling of FFB into CPO and PK derivatives
Production and sales of Renewables business
Processing and sales of rubber and
sugarcane oleochemicals, biodiesel products Development of green technology
and derivatives and renewable energy which includes
biogas and composting
Others
Cattle rearing and beef production
Agribusiness
Hectarage Provision of agriculture products and
as at 31 December 2018 services
Rubber 14,725 ha of rubber estates
Cattle 9,560 ha of grazing pasture
Sugarcane 5,613 ha of planted area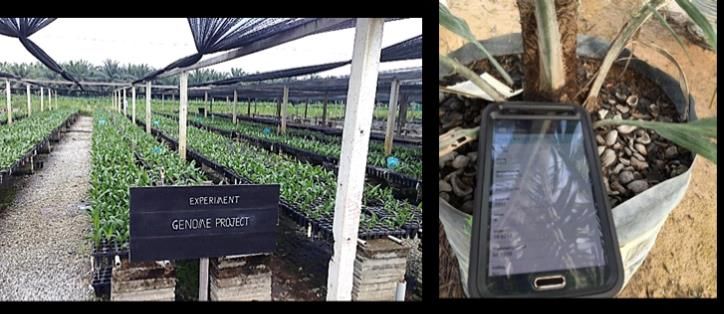
6

   Snapshot of Oil Palm Plantation Operational Statistics
 As at 31 December 2018
 unless otherwise stated
                                          Malaysia            Indonesia       Liberia    PNG & SI                   Total

 Total oil palm planted
                                          304,731              201,072        10,263      91,080                   607,146
 area (ha)
 Mature area (ha)                         248,964              158,791        9,975       79,125                   496,855

                                          9%       18%         11%               3%           5% 13%               9%       18%
 Palm tree age profile &                                                21%             13%
 average tree age                   16%
                                                                                                             22%
 (Years)                                  11.8 yrs             13.6 yrs 13%   5.4 yrs     11.8 yrs     24%         12.3 yrs
                                                     22%   38%                                                                21%
   22 yrs        35%                              17%              45%
                                                                              97%                                  30%

 FFB production*
                                           5.373                2.892         0.086        1.980                   10.331
 (mn MT/year)
 CPO production* (Total)
                                           1.332                0.787         0.020        0.571                    2.710
 (mn MT/year)
 PK production* (Total)
                                           0.335                0.178         0.005        0.148                    0.665
 (mn MT/year)
FFB yield* (MT/ha)                          21.9                18.1           8.7            25.1                  20.9

OER*                                        20.8                21.1           21.1           22.4                  21.2

KER*                                         5.2                 4.8           5.5            5.8                    5.2
Average CPO selling price*
                                           2,262                1,920         1,989        2,412                    2,184
(RM/MT)
Average PK selling price*
                                           1,780                1,376          481             -                    1,678
(RM/MT)

* For the January – December 2018 period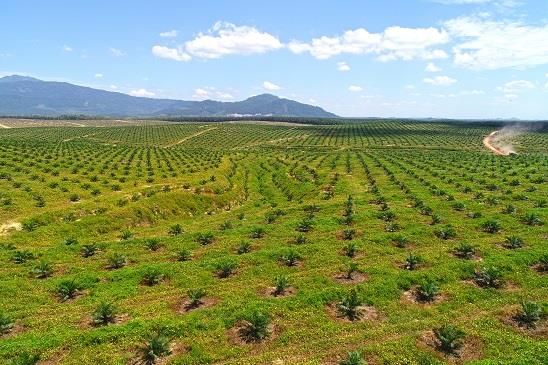
7

   Snapshot of Downstream Operations

                                                                                                               3.8 million MT
                                                                                                                         Refining Capacity

                                                                                                                                                           11
                                                                                                                                                Refineries

                                                                                                                                                    75%*
                                                                                                                                  Average Refinery
                                                                                                                                        Utilisation

                                                                                                                                Key Products

Legend:      Bulk Processing     Differentiated Food
                                                                                    Refined bulk products       Ingredients produced by         Non-food products
* Excluding Industrial Enterprises (IE) Soya in Thailand
                                                                                produced by the Group’s bulk     the Group’s refineries:      produced by the Group’s
Note:
▪ Figures as at 31 December 2018                                                  refineries: RBD Olein, RBD   Bakery fats, specialty oils,   biodiesel, oleochemicals
▪ Names of refineries in brackets refers to the respective proposed new names   Stearin, CPKO, RBD PKO, etc.   confectionery fats, health       and nutrition plants
8

Downstream – Forging the Pathway to Global
Consumers to Establish Lasting Relationships
  Region         Refinery                   Ingredient            Customer   End Product

 Malaysia      Jomalina
            (SD Oils Langat Refinery)
                                          Premium Quality Olein

 Europe         Unimills
            (SD Oils Zwijndrecht
                Refinery B.V)                Palm Olein

  South       Hudson &
               Knight                        Vema 37
  Africa      (SD Oils South Africa        Refined Palm Oil
                  Pty Limited)

 Malaysia       Biodiesel
            (SD Oils Biodiesel Sdn Bhd)
                                            Refined Palm Oil

                 New
              Britain Oil                    Refined
 Europe
             (SD Oils Liverpool              Palm Oil
              Refinery Limited)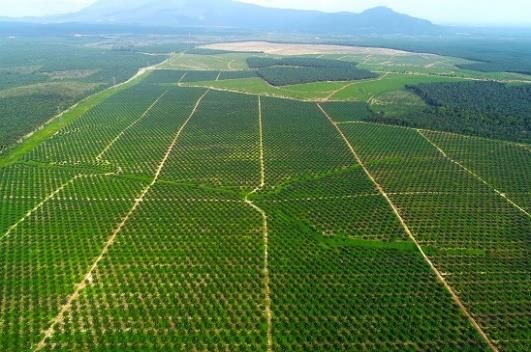
Key Investment Highlights
10

Investment Highlights

            1    Strong Investment Proposition

                    2   The World’s Largest Oil Palm Plantation Company by Oil Palm
                        Planted Area, with Established Reputation as the World’s
                        Largest Producer of Certified Sustainable Palm Oil

                        3   Well Positioned to Benefit from Sound Industry
                            Fundamentals & Strong Demand Growth Trends

                        4 Fully Integrated Business Model with Diversified
                          Operations Along the Palm Oil Value Chain

                   5 Innovative & Market Leading R&D Supports Operational
                     Efficiency & Productivity

        6
                Experienced and Sound Board & Management Team
11
1 Sime Darby Plantation’s Strong Investment
Proposition
23
21 61%
MT/ha
MT/ha
46%
As at 30 Jun As at 31 Dec
2017 2018
Jan - Dec FY23 of Net Profit
2018 Target
GROSS
FFB YIELD GEARING
FFB STRENGTHENING LOWERING IMPROVING HIGH
PRODUCTION DOWNSTREAM COST GEARING & DIVIDEND
GROWTH CONTRIBUTIONS & CASH FLOW POLICY
POTENTIAL MARGINS12
2 World’s Largest Oil Palm Plantation Company with
More Than 600,000 Hectares of Planted Area
~600,000 hectares We are the world’s largest oil palm
World’s Largest Oil Palm Plantation Company (by planted area) plantation company by oil palm planted
area with total landbank of more than
20% of Global CSPO
Production Capacity1
997,000 hectares across Malaysia,
Leader in Sustainability – Indonesia, PNG & Liberia
World’s Largest Producer of CSPO
2.71 mn MT2
Jan-Dec 2018 Total CPO Production
(~4% of Global Market Share3)
250 71 11
Estates Mills Crushing Plants
(inclusive of soy crushing plant)
3.8 mn MT p.a.
Total Refining Capacity (11 Refineries)
Market Leading R&D
Edison Award 2017 under the Energy and Sustainability category
(Genome Select Oil Palm Project)
Note: Figures as at 31 December 2018 unless stated otherwise
1 Estimated based on global planted area of 21.5 mn ha worldwide
2 Forthe January – December 2018 period
3 Based on global CPO production of 70.46 mn MT in 2017/201813
2 Our Journey to Sustainability
Moving Forward
• Compliant to the RAC &
2016 HRC
• Launched the • 100% RSPO certified
Responsible • Low carbon/carbon neutral
Agriculture Charter Palm Products
(RAC) • 100% Traceability
2014 • Commitment to • Best-in-class HCV/HCS,
• Founding the HCS water conservation
2012 member of the Convergence
• Became largest HCS Science Agreement 2018
producer of CSPO Study
onwards
2002 2008 globally
1992 • Founding • Achieved first
• EUNEP Global 500 member RSPO
Roll of Honour for of RSPO certification
commercialisation of • POME 2017
Zero Burning utilisation as 2015 • Launch of the
1985 practice compost • Acquisition of a fully Human Rights
2013 RSPO certified &
• Introduced Charter (HRC)
• First KKPA traceable palm oil
Zero burning 2010
smallholders producer, New • Commitment to
• First
certified to Britain Palm Oil balanced
2004 certification
RSPO in development
• First Global GAP of SCCS and
Indonesia
1990 1994 certification ISCC
• Biological • EMS-ISO
14001 • Pioneered the Zero Burning Policy in 1985
control for
• One of the founding members of RSPO
IPM
• Largest producer of CSPO: Malaysia 100%, PNG 100% & Indonesia 96% certified
• No deforestation of primary and virgin forest
• No new development on peatlands
• No development of HCS areas, once defined
• Committed to Environmental and Social Principles – HCV, Human Rights & FPIC14
2 Sustainability – Committed to Good Agriculture
Practices
C E R T I F I C AT I O N S TAT U S
As at 31 December 2018
R 97%
S RSPO-certified
P
100% 96% 100%
O MALAYSIA INDONESIA PNG & SI
M I
S 100% S
96%
MSPO-certified ISPO-certified
P P
O O
High Carbon Stock Responsible Agriculture Human Rights Innovation &
(HCS) Commitment Charter (RAC) Charter (HRC) Productivity Charter (IPC)
As a signatory to the Launched in Sep’16, the RAC is a Sime Darby launched it’s The charter states our
Sustainable Palm Oil summary of SDP’s commitments Human Rights Charter to aspirations across the
Manifesto, we are committed surrounding: articulate its commitment in value chain in achieving
to implementing leading • Human rights & social respecting human rights in prosperity, via enabling
industry practices around development line with the United Nations high levels of productivity
High Conservation Value and • The environment Guiding Principles on Business in delivering sustainable
HCS in new developments • Corporate integrity and Human Rights development15
2 Sustainability – Supply Chain Sustainability
Proactively managing risks and grievances within our global supply chain…
Identify and manage risks throughout our supply
OpenPalm - 2016
chain…
Supply Chain Risk
OpenPalm Assessment
Our global supply chain is currently 97% … and effectively respond to grievances of our
traceable to the mill supply chain
Satellite monitoring from
stakeholder reports Supplier Grievances and our
Global Mill List of all our
refineries publicly available actions taken publicly available16
2 Sustainability – Supply Chain Sustainability
Going beyond our boundaries to uplift the practices and livelihoods of our suppliers,
communities and the industry
Examples of some of our
efforts within the region
• Responsible Sourcing Guidelines
• MSPO certification
• Entire Sabah state RSPO certified by 2025
• Nestle and ELEVATE to develop an independent 3rd party
grievance hotline
• Our outgrowers’: ~40,000 ha of area,
supporting ~25,000 families
• Decent Rural Living Initiative
• Community Fire Prevention program
• 100% RSPO certification: 16,000 smallholder blocks
• SAN Standard by Rainforest Alliance17
2 Sustainability – Driving Market Demand
CSPO PRODUCTION CAPACITY NURI REFINERY (MALAYSIA)
NEW BRITAIN OILS (UK)
13.9mn MT
Global CSPO
Production Capacity
(as of January 2019)
All of SD Plantation’s refineries are RSPO-
certified
New Britain Oils’ refinery in Liverpool is a fully
Certified Segregated Refinery
We have modified and expanded our milling
and refinery capacity to increase production of
Premium Quality (PQ) oil
PQ oil offers low free fatty acid oil blends
Source: Company18
2 Sustainability
Strengthening our position as the world’s #1 producer of certified sustainable palm oil (CSPO)
Sustainable Business Awards
(SBA) Malaysia 2019
SD PLANTATION EMERGED AS ONE OF
Recognises companies in THE BIGGEST WINNERS WITH 5 AWARDS
Malaysia which have
demonstrated extraordinary OVERALL WINNER
performance in the field of
OVERALL CHAIN MANAGEMENT
sustainability to the long term
benefit of the Malaysian society STRATEGY AND SUSTAINABILITY
and economy, in line with EU MANAGEMENT
sustainable development values BEST SUSTAINABILITY IN THE
and United Nations Sustainable COMMUNITY
Development Goals (SDGs) BEST LAND USE AND BIODIVERSITY
The SBA is a regional platform intended to
BEST SUSTAINABLE PALM OIL LEADER share good sustainability practices across
SIME DARBY PLANTATION companies in SEA and demonstrate how
based on initiatives which have made a positive contribution sustainable business benefits companies, the
to the environment, communities and societies during the year environment and all stakeholders19
3 Well Positioned to Benefit from Sound Industry
Fundamentals & Strong Demand Growth Trends
Our wide & diverse geographical reach of business operations will
allow us to leverage on strong industry fundamentals
Upstream Operations
Presence in 5 countries
Developing, cultivating and managing oil palm,
rubber & sugarcane plantation estates MALAYSIA INDONESIA LIBERIA
Operates and manages 250 plantation estates
and 71 palm oil mills
PAPUA NEW SOLOMON
Cattle rearing & beef production GUINEA ISLANDS
Downstream Operations
Mainly operating across 7 countries
Production & sales of bulk & refined oils and fats, MALAYSIA INDONESIA NETHERLANDS
oleochemicals, biodiesel products and derivatives
Manages and operates 11 refineries with a total
refinery capacity of 4 mn MT per year THAILAND UNITED PAPUA NEW
SOUTH AFRICA
KINGDOM GUINEA
Source: Frost & Sullivan, company20
3 Well Positioned to Benefit from Sound Industry
Fundamentals & Strong Demand Growth Trends (cont’d)
Sime Darby Plantation is well positioned to tap into the fast growing demand in Asia Pacific
Rising personal wealth and consumption are GDP Growth Rates (%) – 2017 - 2023 2017 2018F 2021F 2022F 2023F
transforming Asia’s economies and markets
7.7
7.7
7.7
7.3
6.9
6.7
6.6
6.5
6.5
6.3
6.2
6.1
6.0
5.9
5.8
5.6
5.4
5.3
5.3
5.1
5.1
4.8
4.8
4.8
4.7
4.1
3.9
3.9
3.7
3.7
3.6
3.6
3.6
2.9
2.7
3.1
2.7
2.2
1.6
1.6
1.6
1.7
1.7
1.6
1.5
1.4
2.2
1.7
1.7
1.4
Malaysia Indonesia China India Emerging & Sub-Saharan United Kingdom EU U.S. World
Developing Asia Africa
Malaysia and Indonesia represents
Global Vegetable Oil Consumption is Vegetable Oil in Food Consumption
85% of global CPO production. SDP
expected to grow at 2.8% by 2030 will be driven by Asia
has strong presence in these countries
2017 – 2030 CAGR
2017 – 2030 CAGR 270 2013 – 2019 CAGR
Global: 2.8%
Asia: 3.1% 10.5 10.6
241 Europe: 0.5% Global: 4.2% 9.7
74
214 64 64 8.1 8.3 8.6 0.6
189 199 U.S.: 0.9% 8.0 0.6
59 56 0.5 0.7
173 50 52 12 0.5 0.6
54 46 11
44 48 10 11 18 19 0.5 19.68320.5
136 37 38 10 10 18 19.9 18.9
31 18 17.7
106 10
9 17 18 19.3 20.2
26 15 101
205 15 76 89
12 183 63 68 71
160 38 48
136 146 151 36.0 38.5 40.5
111
94 28.5 30.5 33.0 32.0
2005 2010 2015 2017 2018 2020 2025 2030
2005 2010 2015 2017 2018 2020 2025 2030 in mil MT Asia Europe US RoW
12/13 13/14 14/15 15/16 16/17 17/18F 18/19F
in mn MT Food Non Food Given Asia’s population density and the Indonesia Malaysia
growing income of its populace, additional Papua New Guinea RoW
demand growth from the region will be strong 84.8% 85.5% 85.6% 84.4% 84.1% 84.0% 84.4%
Source: LMC Oilseeds & Oils Report 2018, USDA, IMF October 2018 as a % of global production21
4 Fully Integrated Business Model with Diversified
Operations Along the Palm Oil Value Chain
With a fully integrated business model, we are able to diversify our earnings risk from
volatility of commodity price and leverage on operational synergies
Key Benefits of a Fully Integrated Business Model
1 Economies of scale & cost synergies 2 Diversification of commodity price volatility
Shared use of integrated processing facilities & infrastructure Allows diversification of upstream operations which are susceptible to
volatile commodity prices
Extensive sales and distribution network
More stable and resilient earnings as volatilities in segment margins are
Flexibility to channel products & resources to markets with greater demand
mitigated
Ability to convert by-products (palm fibres, sludge oil, palm oil mill effluent, empty
Ability to better manage commodity price volatility
fruit bunches, palm kernel expeller) into applications such as animal nutrition and
tocotrienols Flexibility to channel CPO to various segments of downstream
process by capitalizing on the different price characteristics and
Strengthen our ability to trade around our own assets
feedstock types in the downstream segment22
5 Market Leading R&D Supports Operational Efficiency
and Productivity
Market Leading Research & Development
• Global network of 5 R&D centres in Malaysia, Indonesia & PNG,
and 3 innovation centres in Malaysia, the Netherlands and South
Africa
• Supports operational efficiency and improvements to upstream
productivity, and we develop sustainable practices while pursuing
transformational innovative strategies
• Development of new palm oil breed via a genomic selection and
prediction process
• Malaysia’s first company to win the coveted Edison Award,
which recognised its groundbreaking genome initiative
• Research and production of high yield planting material such as
new Dami seeds progenies which are expected to deliver better
oil yield improvements than its predecessors
Adopt best agro-management practices
• Precision agriculture to improve yield
• Efficient water management and irrigation system
• Integrated pest management programmes
• Mechanisation initiatives to improve manpower ratio, cost
efficiency and productivity
• Digitisation initiatives23
6 Experienced and Sound Board & Management Team
Our Board and management team have the ability to drive our Group through transformation
into the next phase of growth which is to innovate, execute and create value
Board members Board of Directors
have held
prominent Tan Sri Dato’ Abdul Tan Sri Dato’ Seri
Tan Sri Datuk Dr. Yusof Datuk Zaiton Mohd
Ghani Othman Mohd Bakke Salleh Muhammad Lutfi
positions and Basiran Hassan
Chairman and Non- Executive Deputy Independent Non-
directorships in Independent Non- Senior Independent Non-
Independent Non- Chairman and Executive Director
areas such as Executive Director Managing Director
Executive Director Executive Director
plantation,
banking and
finance sectors Dato’ Mohd Nizam Dato’ Mohamad Nasir
Zainal Abidin Jamal Tan Ting Min John Lou Leong Kok
and in Zainordin Ab. Latif
Non-Independent Non- Independent Non- Independent Non-
governmental, Non-Independent Non- Non-Independent Non-
Executive Director Executive Director Executive Director
regulatory and Executive Director Executive Director
professional
bodies
Management Team
Tan Sri Dato’ Seri Mohamad Helmy
Datuk Franki Mohd Haris Zulkifli Zainal
Mohd Bakke Othman Basha Renaka Dr. Simon Lord
Experienced Anthony Dass Mohd Arshad Abidin
Salleh Deputy To Ramachandran Chief
management Chief Advisor Chief Operating Chief Human
Executive Deputy Managing Director Chief Financial Sustainability
team with an Chairman and & Chief Operating Officer
and Value Officer, Resources
Officer
average of Officer Downstream Officer
Managing Director Officer, Upstream
about 15 years
of experience Dr. Harikrishna
Dr. Shariman Norzilah Eliza Mohamed Nik Maziah Nik
in the Alwani
Kulaveerasingam
Megawati Abdul
Lee Ai Leng
Mustapha Gajani Nayagi
Chief
plantation Chief Research & Rahman Group General Seeveneserajah
Chief Strategy & Communications Chief Internal Chief Risk Officer
industry Innovation Officer
Development
Group Secretary Officer
Counsel
Auditor
Officer24
6 Ensuring Smooth Leadership Transition
Appointment of Mohamad Helmy Othman Basha as Deputy to the Managing Director
Mohamad Helmy Othman Basha
Deputy To Managing Director &
Chief Operating Officer, Upstream
(with effect from 1 January 2019, until the retirement of
Tan Sri Mohd Bakke Salleh as Executive Deputy Chairman
& Managing Director in June 2019)
AGE: 51 years old
EXPERIENCE: >18 years in the plantation industry
QUALIFICATIONS/ASSOCIATION:
Fellow of the Association of Chartered Certified Accountants (ACCA)
Member of the Malaysian Institute of Accountants
President of the Malayan Agricultural Producers Association
CAREER JOURNEY:
Auditor – Wellers, Accountants, Oxford, UK
Various roles in Shell Group, Malaysia
The appointment is part of the Company’s Finance & Administration Manager – Guthrie Property Holdings Sdn Bhd
plan to ensure seamless succession of the Various leadership positions in Kumpulan Guthrie Berhad including Chief Executive
top leadership, subject to the performance Officer – Highlands & Lowlands Berhad and Guthrie Ropel Berhad (Key member of the
appraisal and final approval from the Board Guthrie team that acquired PT Minamas Gemilang Plantation in Indonesia in 2001)
of Directors. Head, Upstream Malaysia – Sime Darby Plantation Sdn Bhd (Also headed the
Company’s overseas expansion into Africa)
Sime Darby Plantation continues to strive to Founder – Xcellence Alliance Sdn Bhd and Chemara Palmea Holdings Bhd
create more value and deliver sustainable Head, Plantation Services & Special Projects – Sime Darby Plantation Berhad
results for our stakeholders. Appointed Chief Operating Officer, Upstream in 2017 – Sime Darby Plantation BerhadBusiness Strategies & Future Plans
26

The Strategy Moving Forward
  VISION

                                  ‘The Leading Integrated Global Palm Oil Player’
                                        The global brand for plantation sustainability

           1 UPSTREAM                            2 DOWNSTREAM                                3 I N T E G R AT I O N

           DRIVING OPERATIONAL                      SERVING THE                              MAXIMISING RETURNS
STRATEGY
GROWTH

           EXCELLENCE VIA                           CUSTOMERS OF THE                         ACROSS THE PALM OIL
           DIGITISATION                             FUTURE                                   VALUE CHAIN
TARGETS
BY 2023

           Towards Mission 23:23                     Higher Downstream                        Integrated economics
                                                      PBIT contribution                       across the value chain
           Achieving FFB yields of 23 MT/ha
                & OER of 23% by 2023           20% of Group’s PBIT within the next 5 years

              Relentless Focus on Execution to Drive Value Creation
27
Medium to Long Term Targets
FY2023
FY2020 23.5
FFB Yield
FY2018 22.7 (MT/ha)
FFB Yield
(MT/ha) 23.1%
20.5 OER
FFB Yield 22.7% >15%
(MT/ha) OER
reduction2
21.0% 10-15% Cost to customer
reduction2
OER
Cost to customer 15-20%
Downstream
Contribution1
11% 10-15%
Downstream
Downstream
Contribution1 Contribution1
1 % of Contribution to Group PBIT
2 Reduction in Cost to Customer as compared to FY201828
RISE to APEX
Driving performance through culture change
Accelerating Performance Sustaining Performance
PERFORMANCE HEALTH & CULTURE
Excellence Excellence
Measure: Measure:
PATAMI Growth Organisational Health Index (OHI)
“How we deliver results” “How we sustain results”
Value creation initiatives 6 Winning Mindsets
Operational excellence Organisational Practices
TRANSFORMATION OFFICE
Disciplined execution and rigour across APEX29
Value Creation
Establishment of Transformation Office to ensure effective execution of strategies
TRANSFORMATION OFFICE
Unlocking value creation
Drive execution and de-bottleneck initiatives
UPSTREAM
Track progress on value creation initiatives
RESEARCH &
DOWNSTREAM
Assess and monitor on weekly basis and DEVELOPMENT
ensure accountability
7
FINANCIAL ORGANISATION work CASH
ALIGNMENT / PEOPLE streams CONTROL
TOWER
Value creation targets
SPECIAL
DIGITAL
PROGRAM PROJECTS
MANAGEMENT PLATFORM
Improve tracking efficiency &
manage value creation progress30
SDP’s Journey to be the Leading Innovator in the
Palm Oil Industry
To protect, sustain and leap the growth of SDP’s value
>2020
LEAD IN
2020 INNOVATION
EXEMPLARY ROLE
2019 ACT WITH MODEL
INNOVATION
BELIEVE IN
INNOVATION INGRAIN & ENFORCE
2018
UPSKILL & ENHANCE
EMBEDDING
INNOVATION
AWARENESS & PLATFORM31
Upstream – Driving Operational Excellence
ELEVATING YIELD PERFORMANCE
A B C D
SUPERIOR WATER PLANTATION
REPLANTING PLANTING MANAGEMENT OF THE FUTURE
MATERIAL
• Group: 4 - 5% • Effective water • Enhancing
• High yielding
management & automation and
planting material
(e.g. Genome, Dami) conservation digitisation
practices • Advanced milling
and latest extraction
technologiesA REPLANTING B SUPERIOR PLANTING MATERIAL 32
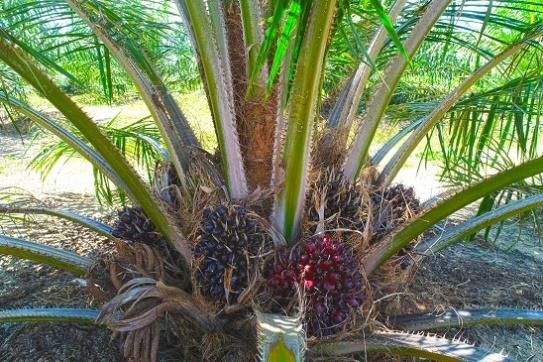
Upstream – Replanting with High Yielding Materials
GenomeSelect palms in Diamond Jubilee Estate (DJE)
Oil palm bunches on 2 year old GenomeSelect palm New GenomeSelect field in DJE planted in 2018C WATER MANAGEMENT 33
Upstream – Innovative Watering Initiatives
Innovative and cost effective irrigation techniques to ensure that
our estates and mills maintain adequate and consistent water
supply during prolonged dry months
PAPUA NEW GUINEA
MALAYSIA INDONESIA LIBERIA
& SOLOMON ISLAND
• Installing mobile pumping equipment at our plantations
• Building permanent water pumps with engines at rivers and water bodies at
some of our plantations
• Irrigation system for drier, inland soils and water management for coastal
areas and areas with high water tableD PLANTATION OF THE FUTURE 34
Upstream – Moving towards a connected, integrated,
automated and sustainable plantation
DIGITALISATION & INDUSTRY 4.0 STRATEGIC INNOVATION
Digitally-enabled value chain analytics to be Drive innovation culture to monetise
highly efficient, cost effective and sustainable internal & external ideas for value creation
SD2 System: Two-tier bin system with
mechanical buffalo Loose Fruit Collector Powered Exoskeleton
On-demand aerial analysis (non-exhaustive examples)
Hotspot Monitoring Dashboard
Normalised Vegetation Tree Count Census
Aerial Monitoring
Index (NDVI)
UAV: Unmanned Value chain analytics Drone Monitoring
aerial vehicle35
Improving Operational Efficiencies
Our strategic initiatives are yielding positive results
Replanting
with Superior Water Crop Quality Cost
Strategic Management Improvements
Priorities
Planting Management
Materials
2,071 ha
SD Premium irrigated1
Improving and Labour
Initiatives 10,867 ha streamlining rationalisation
To Improve Genome irrigated1 processes to
Operational Select 1,157 ha enhance crop Fertiliser cost
Efficiencies irrigated1 evacuation reduction via
Super Family
3,584 ha precise application
Dami
irrigated1
FFB Production 2
+2% YoY
Progress Jul-Dec’18 : 5.56 mn MT
Jul-Dec’17 : 5.46 mn MT
Cost to -3% YoY
To-date 2
OER 2
+1% YoY Customer
Jul-Dec’18 : 21.17%
Jul-Dec’17 : 20.96%
1 As at 31 December 2018
2 For the six-month financial period ended 31 December 2018 (FP December 2018)36
Downstream – To Become The Preferred Sustainable
Palm Oil & Fats Specialist & Customer Solutions Provider
HOW DO WE DELIVER VALUE ?
• Focus on differentiated, sustainable and
traceable high value products
• Explore & expand opportunities to increase
our presence in key geographical markets
Such as India, Southeast Asia, the United States, Europe, Africa, the
Middle East and China
• Create value by marketing and stronger
branding
Through achieving sustainability, quality
and food safety requirements37
Downstream – Shifting Into High Margin Specialty
Products & Deriving Full Value from CSPO
A Physical Sales vs Green Certificate
B
Differentiated vs Bulk
Jan-Dec'18 83% 17% Jan-Dec'18 45% 55%
FY17/18 84% 16% FY17/18 48% 52%
FY16/17 88% 12% FY16/17 42% 58%
FY15/16 86% 14% FY15/16 36% 64%
FY14/15 46% 54%
FY14/15 33% 67%
Physical Certificate
Differentiated Bulk
Emphasis on
Drive physical sales vs Green Differentiated : Drive production of
certificates Physical CSPO differentiated products
Commodity
Sales
C PQ Oil as the Supply Chain 1) Aggregation & Growth Partnership
D
1) Industry Average Contribution
Gateway to Niche Optimisation to Model
Margin:
(collaboration with smallholders)
and High Value Maximise Value
Functional RM1,800/MT
Food Segments of CSPO 2) Working Towards Fully Segregated &
Infant formula RM700/MT Traceable Refineries
Frying RM300/MT
Dairy fat replacer RM200/MT
2) SD Nutrition Leveraging on Waste to New Britain Nuri Refinery SD Unimills
Wealth OilsIndustry Outlook
39

  Demand Drivers of the Global Oil Palm Plantation
  and Edible Oils Industry

 Growing Demand            Competitive Pricing           Wide Range of Uses                                         Increased
                                                                                        Increased in
  for Food due to            of Palm Oil and              for Palm Oil, Palm                                        consumer
                                                                                          Biodiesel
    Increase in             Price Affordability          Kernel Oil and their                                   awareness on food
                                                                                          Demand
    Population              of Edible Palm Oil             Related Products                                       sustainability

To increase by                                               The physical and        Lower oil reserves         CSPO sales grew at
                                              Price      chemical characteristics   and increased in oil        a CAGR of
60%                        Type of Oil     (USD/MT) in
                                              2018
                                                         of oil palm products and
                                                                                     extraction cost has
By 2050 to meet            Palm Oil        535 – 709
                                                          their derivatives allow
                                                         them to be applied in a
                                                                                    driven the global demand
                                                                                        for palm oil for the
                                                                                                                21.9%
increase in energy         Soybean Oil      728 – 871     wide variety of both       production of biodiesel
                                                                                                                between 2010 and 2018,
intake demand                                            food and non-food                                      driven by a direct
                           Coconut Oil     787 – 1,394
                                                                                                                consequence of the
(from 2005 – 2007)         Palm Kernel Oil 708 – 1,265   end-user industries         By 2052, it is estimated   sustainability
                                                                                     that oil reserves may no   commitments of FMCG
                           Sunflower Oil    703 – 806
Average daily energy                                                                longer be able to support   companies
supply expected to         Rapeseed Oil     793 – 854                                  the global economy
increase by 11% during     Groundnut Oil 1,433 – 1,477                                                          By 2020, CSPO sales is
the same period                                                                                                 estimated to reach c.
                                                                                                                11.0 mm MT

Source: World Bank, RSPO
40
Global Vegetable Oil Demand & Supply
Population Growth is a Key Driver
mn MT bn
Vegetable Oil Demand & Supply vs Population
350 8.6 10.0
8.2
7.6 7.6 7.8
300 7.4
7.0 8.0
6.5
250
272
270
242
241
200 6.0
214
214
199
198
190
189
180
150
173
4.0
141
136
100
111
106
2.0
50
16.2 19.6 23.4 25.1 26.0 27.5 29.5 31.5
0 0.0
2005 2010 2015 2017 2018 2020 2025 2030
Demand Supply Population (RHS) Demand/Capita (kg)
Vegetable Oil Demand per Capita (kg) Palm Oil Demand per Capita (kg)
2016/17 2017/18 2018/19 2016/17 2017/18 2018/19
26.8
26.6
26.3
26.0
51.9
13.4
25.3
51.6
25.1
51.2
7.8
12.9
12.6
7.1
48.5
6.9
47.6
45.4
6.2
6.2
6.1
16.9
16.7
16.4
4.8
4.3
4.3
4.3
11.1
11.1
10.9
4.2
4.1
3.9
3.6
EU-28 US China Latin India Africa EU-28 US
3.4
China Latin India Africa
America America
Source: LMC Oilseeds & Oils Report 2018, United Nations, USDA41
Huge Potential for the Palm Oil Industry
Vegetable Oil Consumption in Biofuels (mn MT) Vegetable Oil Consumption in Oleochemicals
1.7 2.1 (mn MT)
1.3
1.2
1.1 9.6
1.0 7.6
41.8 5.2 5.4 5.9
0.8 38.9 39.8 4.7
29.6 33.6 4.2
23.7 3.6 8.9
0.5 5.7 6.0 6.3 6.4 7.5
14.4 3.2 4.5
2.7
2005 2010 2015 2017 2018 2020 2025 2030 2005 2010 2015 2017 2018 2020 2025 2030
Biodiesel Direct Burning Lauric Oils Palm Products
CPO Price (1970 - 2030)
RM/MT 788 1,270 784 1,179 2,900 2,869 2,362 2,405 2,457 2,727 3,019
901
755
USD/MT 667 614 682
584 590 601
260 290 310
1970 1980 1990 2000 2010 2017 2018 2019 2020 2025 2030
Notes:
1) World Bank palm oil price from 1970-2014 - 5% bulk, c.i.f. North West Europe; from 2015 onwards - Palm oil (Malaysia), f.o.b. spot
(constant price, adjusted for inflation)
2) Actual historical exchange rates used for conversion of prices from 1970-2017; constant rate of USD1:RM4.00 used for 2018-2030.
Source: LMC Oilseeds & Oils 2018, World Bank October 2018, Bloomberg42
Longer Term CPO Price Forecasts
MPOB Palm Oil Prices
MPOB Daily Price World Bank Forecast
RM/MT CAGR CAGR CAGR CAGR CAGR World Bank CAGR (2018 – 2030): 2.07%
(‘92 – ’95): (‘96 – ’00): (‘01 – ’05): (‘06 – ’10): (‘11 – ’15): Average Price 2018-2030: RM2,592/MT
4,500 17.00% -4.35% 11.43% 16.08% -9.84%
4,000
3,500
CAGR (1992 – 2017): 4.55% 2030:
RM3,019/MT
3,000
2,500
2018:
2,000 RM2,362/MT
1,500
1,000
500
1,143 1,484 1,382 2,373 2,619 2,582 2,617
0
1992
1993
1994
1995
1996
1997
1998
1999
2000
2001
2002
2003
2004
2005
2006
2007
2008
2009
2010
2011
2012
2013
2014
2015
2016
2017
2018
2019
2020
2021
2022
2023
2024
2025
2026
2027
2028
2029
2030
Average World Bank Prices for 2018-2030:
5-Year Average Prices (MPOB) 5-Year Average Prices (World Bank)
RM2,592/MT
Notes:
1) Historical MPOB prices sourced from Bloomberg
2) Forecast prices sourced from World Bank (constant price, adjusted for inflation)
3) Exchange rate of USD1:RM4.00 applies for World Bank CPO price forecasts between 2018 - 2030
Source: World Bank October 2018, Bloomberg43
Short-Term Industry Outlook
CPO production may continue its downtrend
due to seasonal cycle
• Demand for palm oil could also be driven by:
5.0
4.0 Increasing demand from China (+5% YoY
3.0 to 5.7 mil MT for 18/19F)
2.0
1.0
Higher demand from India (+7% YoY to
9.3 mil MT for 18/19F) - due to reduction
0.0
in import duties
Jan-16
Feb-16
Mar-16
Sep-16
Oct-16
Jan-17
Feb-17
Mar-17
Sep-17
Oct-17
Jan-18
Feb-18
Mar-18
Sep-18
Oct-18
May-16
Nov-16
May-17
Nov-17
May-18
Jun-16
Jun-17
Jun-18
Apr-16
Jul-16
Aug-16
Dec-16
Apr-17
Jul-17
Aug-17
Dec-17
Apr-18
Jul-18
Aug-18
Msia Inv Indo Inv Msia Prod Indo Prod
Biodiesel:
Escalating soy oil to palm oil premium Malaysia’s target to implement B10
Correlation = +0.84
900 250 from Feb 2019, possibly B20 by 2020
Soybean Oil Premium (USD/MT)
800
700 200
Price (USD/MT)
600
150
Indonesia’s implementation of B20 in
500
400 2019 could possibly absorb an
100
300 additional 2.5 million MT of CPO
200 50
100
0 0 El Niño
Jul-16
Jul-17
Jul-18
May-16
Nov-16
May-17
Nov-17
May-18
Nov-18
Jan-16
Mar-16
Sep-16
Jan-17
Mar-17
Sep-17
Jan-18
Mar-18
Sep-18
Upcoming festive seasons
SBO-CPO Premium (RHS) Soybean Oil Price CPO Price
Source : MPOB, Reuters, Oil World, RHB *PSO: Public Service Obligation44
Industry Developments – Potential Impact to SDP
REVISION OF EXPORT LEVY IN INDONESIA IMPORT DUTY FOR EDIBLE OILS IN INDIA
Indonesia’s new palm oil export levy India’s new import duty structure for both CPO &
structure w.e.f 4 Dec 2018 refined palm oils (RPO) w.e.f. 1 Jan 2019
CPO Price Export Levy (USD/MT) CPO RPO
Country of Origin
(USD/MT) CPO Processed Palm Products Old New Old New
549 20-50 20-50
The reduction will lead to higher imports of palm oil by
The removal of the export levy will raise India in the coming months, narrowing the difference
competitiveness of Indonesia palm oil products. between palm oil and competitor edible oils.
This will help in narrowing Indonesia’s CPO This could help restore palm oil’s market share of total
price discount to Malaysia, which has expanded edible oil imports in India, providing support to CPO
to RM420/MT (USD100/MT) in 3Q18. prices.
Higher demand for RPO is positive for Malaysian
Implications on Sime Darby Plantation refiners.
The removal of the CPO export levy is positive
for Sime Darby Plantation’s CPO coming out of Implications on Sime Darby Plantation
Sumatera. The reduction in duties will be positive for Sime Darby
Sime Darby Plantation’s Downstream unit will Plantation’s exports, particularly when India is one of its
continue to drive sales for both local and export major markets.
markets, whilst managing inventory and high However, the Group has also other key markets including
FFA CPO. 4 other top consuming countries (Malaysia, Indonesia,
EU and China).
Source: CIMB, Downstream Source: The Star, Hellenic Shipping News, MPOC, Cambridge Dictionary, The EdgeFinancial Overview
46

Revenue and PBIT
2018 Breakdown

                                    Revenue                                                Jan-Dec 2018 Revenue by Segment

RM’mn                                 Increase was                                                           Others
                                  primarily due to the                                                        1%
                                  increase in the sales
                                     of our palm oil
                                    products (i.e. our         Lower revenue was
  Increase was primarily                upstream              due to lower average
  due to the increase in                                                                                        Upstream
                                  operations) and our           CPO and PK prices
sales of our refined edible        refined edible oils
                                                                                                                  26%
                                                                    realised
oils and fats (downstream           and fats (i.e. our
  operations), sugar and              downstream                                                       Downstream
      beef (upstream                   operations)                                                        73%
 operations), mainly as a
   result of the full year
 consolidation of NBPOL                 14,779.4
 Group’s financial result                                 14,369.0
                                                                        13,286.0            Jan-Dec 2018 PBIT by Segment
                       11,946.5
                                                                                         TOTAL PBIT                   RECURRING PBIT
    10,304.0

                                                                                         Others
                                                                                          -13%                                 Upstream
                                                                                     Downstream                                  38%
                                                                                                                      Others
                                                                                        27%                            74%
                                                                                                  Upstream                     Downstream
                                                                                                    86%                           -12%

     FY2015             FY2016           FY2017           FY2018      Jan-Dec 2018
47
Expenses, Operating Profit & PAT
Historical Comparison
Operating Expenses Operating Profit & Operating Profit Margin
RM’mn RM’mn
Increase is mainly due Increase due to the higher Lower overall
to increased expenses The lower overall operating profit revenue and gain from the operating margin
Increase principally reflects
from our upstream margin is a result of lower FFB sale of the parcel of lands is due to lower
the increase in the
operations as well as yield. However, this was partially to KSDB CPO and PK
production of refined edible Lower
an increase in edibles offset by the improvement of the realised prices
oils and fats at our production
downstream operations and consumables operating profit margin in our
expenses from our costs from downstream operations 30.7%
where the purchase of Upstream
edible oil and consumables downstream
operations 17.9% 30.00%
for such production was operations 11000 15.2%
10.6% 8.7% 20.00%
higher, coupled with higher
plantation operating costs 6000 4,537.9 10.00%
12,991.0 1,570.9 1,268.0 2,572.8 1,156.0
and depreciation and 12,741.0 1000 0.00%
amortisation from our 12,521.0
upstream operations
FY2015 FY2016 FY2017 FY2018 Jan-Dec
2018
11,130.9
PAT & PAT Margin
9,185.3
10000
RM’mn 30.00%
24.0%
8000 25.00%
20.00%
6000 13.1%
10.0% 15.00%
4000 8.4% 3,551.9
1,885.4 10.00%
5.0%
2000 1,002.9 5.00%
1,031.4 661.0
0 0.00%
FY2015 FY2016 FY2017 FY2018 Jan-Dec 2018 FY2015 FY2016 FY2017 FY2018 Jan-Dec
201848
Key Financial Metrics
Historical Comparison
Revenue (RM'bn) PBIT (RM'mn)
FY15 10.30 FY15 1,538
FY16 11.95 FY16 1,259
FY17 14.78 FY17 1 4,455
FY18 14.37 FY18 2 2,536
FP Dec 2018 6.54 FP Dec 2018 559
Jan-Dec 2018 13.29 Jan-Dec 2018 1,138
PATAMI (RM'mn) ROIC %
FY15 997
FY15 6.7
FY16 967 FY16 4.4
1
FY17 3,507 FY17 7.9
FY18 2 1,727 FY18 8.5
FP Dec 2018 244 FP Dec 2018 4.3
Jan-Dec 2018 523 Jan-Dec 2018 4.5
1
FY17’s PBIT and PATAMI includes the non-cash gain on sale of MVV land to SD Berhad
2
FY18’s PBIT and PATAMI includes the non-cash gain on sale of land to SD Property and reversal of accrual for donation
Note: FP Dec 2018 refers to the six-month financial period ended 31 December 201849
Snapshot of Capital and Debt
Historical Comparison
Working Capital Turnover Period Indebtedness by Maturity (as at 31 Dec 2018)
Days RM’mn
Receivables Inventory Payables
3,660.0
85 81
78 75
71
52 1,804.3
46 44
39 38 40 40 1,311.7
34 35 34
520.9
Within 1 year 1-2 years 2-5 years More than 5
As at 30 Jun As at 30 Jun As at 30 Jun As at 30 Jun As at 31 Dec
years
2015 2016 2017 2018 2018
Current Ratio Gross Gearing Ratio1
(x) (x)
1.37
1.29
1.6 1.6
1.5
1.3
1.2 1.2
1.1
0.61 0.55
0.44 0.39 0.40 0.46
0.5
As at 30 As at 30 As at 30 As at 30 As at 31 As at 31 As at 30 As at 31 As at 30 As at 30 As at 30 As at 30 As at 31 As at 31 As at 30 As at 31
Jun 2015 Jun 2016 Jun 2017 Sep 2017 Dec 2017 Mar 2018 Jun 2018 Dec 2018 Jun 2015 Jun 2016 Jun 2017 Sep 2017 Dec 2017 Mar 2018 Jun 2018 Dec 2018
1 Based on Total Borrowings (including intercompany loans) divided by Total Equity50
Credit Ratings
Rating agencies affirmed SD Plantation’s credit ratings – A testament to its financial
stability
“The affirmed corporate credit rating is driven by
AAA , Stable SD Plantation’s sizeable and geographically
diversified oil palm plantations that support a
Affirmed on 14 Sep’18 strong cash flow generating ability to provide a
healthy buffer against its financial obligations”
“SD Plantation's rating reflects its position as the
world's largest palm-oil producer by planted area,
BBB+, Stable diversified plantation locations and operating
integration, which allows optimum profit
Affirmed on 15 Nov’18
retention”
“Malaysian oil palm planters, particularly
companies which comply with tighter
sustainability standards of the RSPO, will have
Baa1, Stable better support in their credit ratings. Among
Moody’s rated oil palm planter issuers, SD
Affirmed on 18 Oct’18 Plantation is best positioned for sustainable
practices as it is the largest producer globally of
certified sustainable palm oil”51
Dividend Policy
We propose to pay dividends out of cash generated from our operations after setting aside necessary funding for
capital expenditure and working capital requirements. As part of this policy, our Company targets a dividend
payout ratio of not less than 50.0% of our consolidated profit attributable to the owners of our Company under
MFRS, beginning 1 July 2017
The declaration of interim and final dividends is subject to the discretion of our Board. However, our ability to pay
dividends or make other distributions to our shareholders will depend upon a number of factors, including:
the level of our cash, gearing, return on equity and retained earnings;
our expected financial performance;
our projected levels of capital expenditure and other investment plans;
our working capital requirements; and
our existing and future debt obligations.
No inference should be made from any of the foregoing statements as to our actual future profitability or our
ability to pay dividends in the future.Snapshot of Financial Performance in FP December 2018
53

Segmental Performance in FP Dec 2018

    Impact of the lower average CPO and PK prices realised partially mitigated by
        improvements in operational efficiencies and Downstream earnings
Recurring PBIT in RM’mn

                                      UPSTREAM                                                      DOWNSTREAM
                                           385                                                                 146
                                                                                                      1H Dec 2017: 134 (+9% YoY)
                                  1H Dec 2017: 1,013 (-62% YoY)

                                 301                          68
                                1H Dec 2017: 718             1H Dec 2017: 261
                                (-58% YoY)                   (-74% YoY)

                                                                                                            OTHERS1
                                -41                           57
                                1H Dec 2017: -43
                                (+5% YoY)
                                                             1H Dec 2017: 77
                                                             (-26% YoY)                                          14
                                                                                                      1H Dec 2017: 38 (-63% YoY)

1   Others refers to Sime Darby Agri-Bio Sdn Bhd, Sime Darby Research Sdn Bhd, Sime Darby Technology Sdn Bhd, Sime Darby Biotech Lab Sdn Bhd, Sime Darby
    Seeds Sdn Bhd, as well as investment holding companies, associates and joint ventures
54
Lower recurring profits wholly due to lower CPO
and PK realised prices – PBT
in RM’mn
358
Net positive
impact on PBT
43 -12 -1,007
175 12
Others Higher
Higher
19 interest
72 Downstream
expense
37 Lower cost results
Higher
Higher sales OER to customer
Higher FFB
volume
production
1,450
1,104 457 Non-
Lower CPO 14 recurring
PBT
& PK prices
realised Recurring
443 PBT
Dec 2017 Recurring PBT Dec 2018
before the impact
Recurring of CPO/PK prices
PBT
PBT55
Lower recurring profits wholly due to lower CPO
and PK realised prices – PATAMI
in RM’mn
297
Net positive
impact on PATAMI
58 -9 -757
139 9
Higher
Higher Others interest
55 16 Downstream expense
20 results
Higher Lower cost
OER to customer
Higher FFB Higher sales
production volume
987
699
244 Non-
14 recurring
Lower CPO PATAMI
& PK prices Recurring
realised 230 PATAMI
Dec 2017 Recurring PATAMI Dec 2018
before the impact
Recurring of CPO/PK prices
PATAMI
PATAMI56
Dividend for FP Dec 2018
SD Plantation declares and maintains a dividend payout ratio of not less than
50% of the consolidated profit attributable to the owners of the Company
FP Dec 2018 FY2018
Net Per Share Total Net Dividend Net Per Share Total Net Dividend
(sen) (RM’mn) (sen) (RM’mn)
Final Cash Dividend 1.7 117 11.5 782
Special Dividend - - 6.0 408
Total Dividend 1.7 117 17.5 1,190
Payout ratio
(Based on recurring PATAMI)
~51% ~63%Appendix
58

     Financial Highlights
     Performance affected by lower Upstream profits, mitigated by improved Downstream earnings
                                                                                                                                                                1
           in RM’mn (YoY %)                                                2Q DEC 2018                                        FP DEC 2018
               Revenue                                                                  3,504
                                                                            2Q Dec 2017: 4,085 (-14%)
                                                                                                                                            6,543
                                                                                                                                1H Dec 2017: 7,626 (-14%)

               PBIT                                                                                  300
                                                                                  2Q Dec 2017: 673 (-55%)
                                                                                                                                                         559
                                                                                                                                    1H Dec 2017: 1,957 (-71%)

                   Recurring PBIT                                                                       286                                                 545
                                                                                   2Q Dec 2017: 673 (-58%)                               1H Dec 2017: 1,185 (-54%)

                   Non-Recurring PBIT                                                                     14                                                  14
                                                                                              2Q Dec 2017: 0                               1H Dec 2017: 772 (-98%)

               PBT                                                                                   245
                                                                                  2Q Dec 2017: 637 (-62%)
                                                                                                                                                     457
                                                                                                                                    1H Dec 2017: 1,876 (-76%)

               PATAMI                                                                                129
                                                                                  2Q Dec 2017: 429 (-70%)
                                                                                                                                                     244
                                                                                                                                    1H Dec 2017: 1,448 (-83%)
               Attributable to owners of the Company

                   Recurring PATAMI
                                                                                                        115                                                 230
                                                                                   2Q Dec 2017: 429 (-73%)                                 1H Dec 2017: 699 (-67%)

                   Non-Recurring PATAMI                                                                   14                                                  14
                                                                                              2Q Dec 2017: 0                               1H Dec 2017: 749 (-98%)
                                             2
               Basic EPS                                                                              1.9
                                                                                  2Q Dec 2017: 6.3 (-70%)
                                                                                                                                                           3.6
                                                                                                                                         1H Dec 2017: 21.3 (-83%)
               (RM’sen)
                   Recurring EPS
                                                                                                         1.7                                                 3.4
                                                                                    2Q Dec 2017: 6.3 (-73%)                                1H Dec 2017: 10.3 (-67%)

                   Non-Recurring EPS                                                                     0.2                                                 0.2
                                                                                              2Q Dec 2017: 0                               1H Dec 2017: 11.0 (-98%)
1   SD Plantation revised its financial year end from 30 June to 31 December w.e.f. the close of the financial year ended 30 June 2018
2   Based on weighted average number of ordinary shares post-listing of SD Plantation
59
Non-Recurring Profits
Lower non-recurring profits largely due to the gain on sale of land recorded in the
corresponding period of the previous year
2Q 2Q FP 1H
in RM’mn DEC 2018 DEC 2017 DEC 2018 DEC 2017 YoY
Non-Recurring PBIT 14 - 14 772 -98%
Gain on sale of 51% equity stake
30 - 30 -
in Golden Hope Nha-be, Vietnam
Impairment on assets in Liberia -15 - -15 -
Others -1 - -1 -
Gain on sale of land to Sime - -677
Darby Property
Reversal of accrual for donation
to Yayasan Sime Darby - -95
Non-Recurring PATAMI 14 - 14 749 -98%60
Borrowings & Cash Flow
Increased borrowings from RM6.5bn (30 Jun 2018) to RM7.3bn due to the acquisition of MFCL,
higher working capital funding and higher borrowings amid appreciation of foreign currencies
Gross
Gearing1
44% 39% 40% 43% 46% RM902mn -RM919mn RM175mn
NET CASH GENERATED NET CASH USED IN NET CASH FROM
FROM OPERATING INVESTING FINANCING
Net
Gearing2 39% 35% 38% 40% 43% ACTIVITIES ACTIVITIES ACTIVITIES
Borrowings 7,214 6,452 6,489 7,159 7,297 Borrowings as at 31 Dec 2018 increased by RM808mn
(in RM’mn)
compared to 30 Jun 2018 attributable to:
New loan drawdown for the acquisition
20% 25% of Markham Farming Company (MFCL) of RM245mn
17% 23%
18% Working capital funding, given higher inventory
balances
Internal inventory volume 31 Dec 30 Jun QoQ
(in ‘000 MT) 2018 2018
80% 82% 83% 77% 75%
Upstream – CPO 117 77 +52%
Upstream – PK 24 21 +14%
Downstream – Refined products 214 205 +4%
Total 355 303 +17%
As at 31 As at 31 As at 30 Jun As at 30 As at 31
Dec 2017 Mar 2018 2018 Sep 2018 Dec 2018 Borrowings increased due to the appreciation of USD
Long Term Debt Short Term Debt and EUR against RM by 3% and 2%, respectively
resulting in an impact of RM179mn
1 Gross Gearing is based on Total Borrowings (including intercompany loans) divided by Total Equity
2 Net Gearing is based on Total Borrowings (including intercompany loans) less Bank Balances, Deposits & Cash divided by Total Equity61
Financial Performance by Segment
Impact of the lower average CPO & PK prices realised partially mitigated by
improvements in operational efficiencies and Downstream earnings
Recurring PBIT in RM’mn (YoY %) 2Q DEC 2018 FP DEC 2018
Upstream 185 385
2Q Dec 2017: 577 (-68%) 1H Dec 2017: 1,013 (-62%)
Upstream Malaysia
176 301
2Q Dec 2017: 414 (-57%) 1H Dec 2017: 718 (-58%)
Upstream Indonesia
5 68
2Q Dec 2017: 144 (-97%) 1H Dec 2017: 261 (-74%)
Upstream PNG/SI
27 57
2Q Dec 2017: 39 (-31%) 1H Dec 2017: 77 (-26%)
Upstream Liberia
-23 -41
2Q Dec 2017: -20 (-15%) 1H Dec 2017: -43 (+5%)
Downstream 98 146
2Q Dec 2017: 64 (+53%) 1H Dec 2017: 134 (+9%)
Others 1 3 14
2Q Dec 2017: 32 (-91%) 1H Dec 2017: 38 (-63%)
1 Others refers to Sime Darby Agri-Bio Sdn Bhd, Sime Darby Research Sdn Bhd, Sime Darby Technology Sdn Bhd, Sime Darby Biotech Lab Sdn Bhd, Sime Darby Seeds Sdn
Bhd, as well as investment holding companies, associates and joint ventures62
Operational Performance – Upstream
Significant improvement in Indonesia and PNG/SI compensating the lower output from
Malaysia
in ‘000 MT (YoY %) FFB PRODUCTION
Malaysia: Lower
production YoY
attributable to the
bumper harvest
experienced in the
previous year
Indonesia: In line with
high crop production in
Indonesia and driven
by our continuous
operational
improvements
(fertiliser application,
water management &
other agro
management practices)
gave rise to higher crop
production
PNG/SI: Boost in FFB
output as it recovers
from a low harvest in
the previous year and
due to increased
maturity of planted
area63
Operational Performance – Upstream
Strong recovery of OER in Malaysia offset lower OER in Indonesia and PNG/SI
in % (YoY %) CPO EXTRACTION RATE (OER)
Malaysia & Liberia:
Higher OER as a
result of crop
quality
improvements with
better agriculture
management
Indonesia: Crop
quality was affected
slow turnaround of
barges transporting
the crop
PNG/SI: OER
declined by 1% YoY
in FP Dec 2018 due
to higher rainfall
especially in West
New Britain
affecting timely crop
evacuation64
Operational Performance – Upstream
Weaker average CPO prices realised for the last six months but has since rebounded
in RM/MT
(YoY %) AVERAGE CPO PRICE REALISED
MALAYSIA INDONESIA
-28% -24% -34% -34%
2,717 TOTAL
2,580
2,706
1,939
2,072 UPSTREAM 2,533 1,712
1,663
2Q Dec 2Q Dec 1H Dec FP Dec
-30% -26% 2Q Dec 2Q Dec 1H Dec FP Dec
2017 2018 2017 2018 2017 2018 2017 2018
2,672
2,654
PNG/SI 1,870
1,974 LIBERIA
-21% -18% 2Q Dec 2Q Dec 1H Dec FP Dec -19% -16%
2017 2018 2017 2018
2,713
2,155 2,701 2,213 2,275 1,840 2,243 1,874
2Q Dec 2Q Dec 1H Dec FP Dec 2Q Dec 2Q Dec 1H Dec FP Dec
2017 2018 2017 2018 2017 2018 2017 201865
Impact of lower average CPO and PK prices realised on our profits
For FP Dec 2018
IMPACT IMPACT ON
in RM’mn FP DEC 2018 1H DEC 2017 YoY % ON PBIT PATAMI
Recurring PBIT 545 1,185 -54% 640
Recurring PATAMI 230 699 -67% 469
CPO* 2,072 2,717 -24% 355 270
MALAYSIA PK* 1,591 2,435 -35% 141 107
CPO* 1,712 2,580 -34% 328 246
INDONESIA PK* 1,222 2,128 -43% 57 43
CPO* 2,213 2,701 -18% 117 82
PNG/SI
CPO* 1,874 2,243 -16% 9 9
LIBERIA
IMPACT OF LOWER AVERAGE CPO & PK PRICES REALISED 1,007 757
Note: * Average selling price realised (in RM/MT palm product)66
Impact of lower average CPO and PK prices realised on our profits
For 2Q Dec 2018
IMPACT IMPACT ON
in RM’mn 2Q DEC 2018 2Q DEC 2017 YoY % ON PBIT PATAMI
Recurring PBIT 286 673 -58% 387
Recurring PATAMI 115 429 -73% 314
CPO* 1,939 2,706 -28% 223 170
MALAYSIA PK* 1,434 2,694 -47% 116 88
CPO* 1,663 2,533 -34% 227 170
INDONESIA PK* 1,140 2,344 -51% 45 34
CPO* 2,155 2,713 -21% 87 61
PNG/SI
CPO* 1,840 2,275 -19% 9 9
LIBERIA
IMPACT OF LOWER AVERAGE CPO & PK PRICES REALISED 707 532
Note: * Average selling price realised (in RM/MT palm product)67
Corporate Developments – The Challenging Landscape
in Liberia
EXISTING OPERATIONS
As at FP Dec 2018
Total Planted Area Average Age Profile Average CPO Price Realised
-16%
10,383 ha 5.4 years YoY RM1,874/MT
1H Dec 2017: RM2,243/MT
Oil Palm: 10,263 ha,
Rubber: 120 ha
FFB Production FFB Yield OER
+76% +64% +1%
YoY 51,154 MT YoY 5.13 MT/ha YoY 21.06%
1H Dec 2017: 20.82%
1H Dec 2017: 29,336 MT 1H Dec 2017: 3.12 MT/ha
Despite improvements in operational efficiencies in Liberia for FP Dec 2018,
assets were impaired by USD3.5mn (RM15mn) attributable to lower future
CPO price projections. World Bank, in Oct 2018, had reduced their long term
CPO price projections by a range of USD62/MT (8% from USD806/MT) to
USD106/MT (15% from USD721/MT) between 2020 to 202568
Financial Performance – Downstream
Improved earnings as a result of higher sales volume & better margins, especially
from its APAC operations
Recurring PBIT in
RM’mn (YoY %) TOTAL DOWNSTREAM The Asia Pacific operations
reported stronger performance
mainly attributable to higher sales
+53% +9% volume and better margins from
both the bulk and differentiated
products businesses
146 The differentiated products
134 business was however impacted by
98 lower demand from Europe, the
64 Middle East and Africa
2Q Dec 2017 2Q Dec 2018 1H Dec 2017 FP Dec 2018 Stronger trading & bulk
performance was largely due to:
Increased margins in Indonesia
DIFFERENTIATED BULK TRADING primarily due to the supply glut
situation in Indonesia resulting
in lower feedstock prices from
-15% -40% +210% +59% +143% +55% aggregated oil
Higher aggregation in Indonesia
(Volume increased by 35% YoY
66 39 62 from 66,000 MT to 89,000 MT
40 33 10 31 39 14 34 29 45
in 2Q Dec 2018 and 51% YoY
2Q Dec 2Q Dec 1H Dec FP Dec 1H Dec FP Dec from 141,000 MT to 213,000
2Q Dec 2Q Dec 2Q Dec 2Q Dec 1H Dec FP Dec
2017 2018 2017 2018 2017 2018 2017 2018 MT in FP Dec 2018)
2017 2018 2017 2018
APAC – Asia Pacific
EMEA – Europe, the Middle East and AfricaYou can also read