Investigating Relationship between Google Index and Corporate Profit Using Random Forest
←
→
Page content transcription
If your browser does not render page correctly, please read the page content below
Applied Mathematics, 2018, 9, 35-43
                                                                                                http://www.scirp.org/journal/am
                                                                                                         ISSN Online: 2152-7393
                                                                                                           ISSN Print: 2152-7385

Investigating Relationship between Google
Index and Corporate Profit Using Random
Forest

Fong-Ching Yuan, Chao-Hui Lee

Department of Information Management, Innovation Center for Big Data and Digital Convergence, Yuan Ze University, Taiwan

How to cite this paper: Yuan, F.-C. and         Abstract
Lee, C.-H. (2018) Investigating Relation-
ship between Google Index and Corporate         An automatic analysis of financial figures is common way for investors to
Profit Using Random Forest. Applied Ma-         analyze financial reports. However, using solely financial statements does not
thematics, 9, 35-43.                            represent the comprehensive financial story of a company. Recently, many
https://doi.org/10.4236/am.2018.91004
                                                people express their opinions and search for information on the Internet. The
Received: December 22, 2017                     adoption of the Internet has generated another type of data for analysis, i.e.
Accepted: January 23, 2018                      Google Index. The purpose of this research is to prove Google Index is a good
Published: January 26, 2018
                                                indicator for investors to analyze companies’ status. In this study, random
Copyright © 2018 by authors and
                                                forest (RF) is used to investigate the relationship between company’s financial
Scientific Research Publishing Inc.             performance and financial ratios and Google Index. From the results of RF
This work is licensed under the Creative        model, we can see Google trend also plays a major role in determining the
Commons Attribution International
                                                company’s profit except the stock index and operating margin.
License (CC BY 4.0).
http://creativecommons.org/licenses/by/4.0/
               Open Access
                                                Keywords
                                                Internet, Google Index, Random Forest, Financial Performance

                                              1. Introduction
                                              With the development of information technology in recent years, a lot of people
                                              express their opinions and search for information on the Internet. The adoption
                                              of the Internet has generated another type of data for analysis. Google Trends is
                                              one of the best and most versatile search engine tools. As a public tool provided
                                              by Google Inc., Google Trends “analyzes a portion of Google web searches to
                                              compute how many searches have been done for the entered terms, relative to
                                              the total number of searches done on Google over time”. The search volume da-
                                              ta reported are normalized and scaled, and include volumes for all types of que-
                                              ries. Google data source has been employed in many research fields such as in

DOI: 10.4236/am.2018.91004        Jan. 26, 2018                    35                                      Applied Mathematics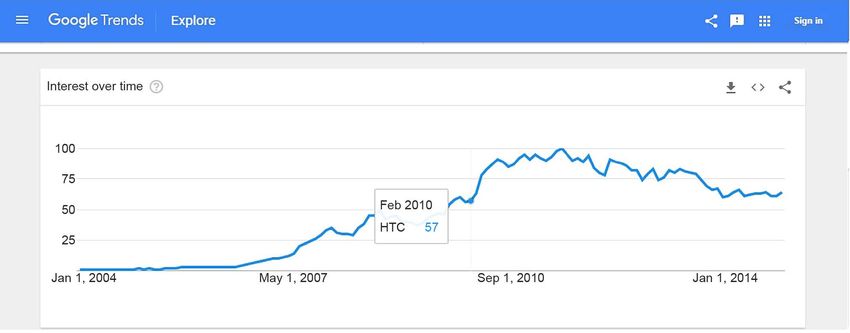
F.-C. Yuan, C.-H. Lee
forecasting diseases [1] [2] [3], ranking universities [4], gathering public opi-
nions [5], constructing an Automotive Index [6], general economic indicators
such as unemployment rates [7] [8] [9] [10] and general consumer consump-
tions [11] [12] [13] [14], housing market [15], box-office revenue [16], gun sales
[17], popularity of songs and movies [18], hotel room demand [19], as well as
tourist demand [20]. With the widespread adoption of the Internet for searching
information, a large amount of online behavioral data has been made available
to the company. Internet technology provides numerous ways to capture what
stakeholders are doing online and on which websites they are doing it. When
stakeholders conduct a search, traces of access can be captured, stored, and ana-
lyzed. When a company has something special to happen, network search vo-
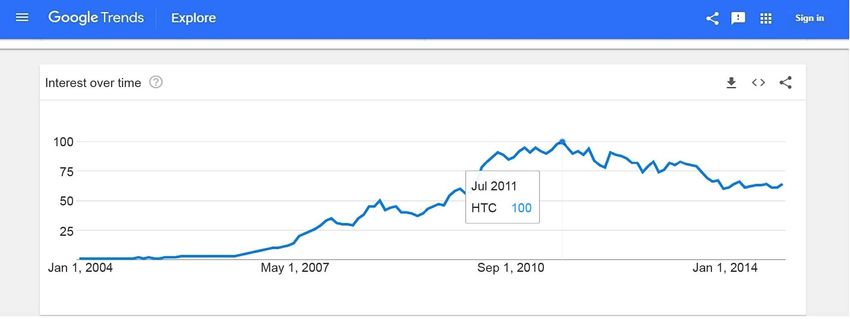
lume will increase. For example, High Tech Computer Corporation (HTC) is a
very famous telecommunication company in Taiwan. From Figure 1, we can see
(a)
(b)
Figure 1. Search volume from Google Trends using HTC as an example; (a) HTC Search Volume on 2010 Feb; (b) HTC Search
Volume in 2011 July.
DOI: 10.4236/am.2018.91004 36 Applied MathematicsF.-C. Yuan, C.-H. Lee
the search volume from Google Trends rose sharply from February 2010 and
reached its peak in July 2011. From the high search volume, we can know a lot of
people are searching what they want to know about HTC. Certainly, a large
number of media reports will be produced about the company’s information,
providing overwhelming references for the public.
In this study, we use random forest (RF) algorithm to investigate the rela-
tionship between company’s profit, financial ratios, and Google Index. The RF
model provides an effective methodology for quantitative data analysis and the
choice of appropriate quantitative data which have impact on companies’ reve-
nue.
2. Data and Methods
2.1. Financial Ratios
In order to make the quantitative data comparable, financial ratios had to be
calculated. Seven financial ratios, which fulfilled the criteria of good validity and
reliability, were selected and calculated for the analyzed company [21]. The key
ratios can be divided into four different classes: profitability ratios, liquidity ra-
tios, solvency ratios and efficiency ratios. It is common to choose ratios that
measure different aspects of financial behavior. The emphasis in the study was
on profitability, and therefore, three profitability ratios were selected; Operating
Margin, Return on Total Assets (ROTA) and Return on Equity (ROE). One li-
quidity ratio measuring the ability of a company to cover its short-term liabilities
with its current assets, Current Ratio, was used. The solvency of the companies
was measured using the ratios Equity to Capital and Interest Coverage. Finally,
Receivables Turnover was chosen to measure the efficiency of the companies.
2.2. Google Trends
Google is the largest and the most popular search engine in the world, with a
66.7% market share, providing free services of historic search engine query vo-
lume data. Google Trends (http://www.google.com.hk/trends/?hl=en) provides
Google query data, from January 2004 to the present, on a weekly or monthly
basis. The search volume data based on queries can be obtained from Google
Trends [2] [10]. It reports a query index, which displays how frequently a search
query has been searched relative to the total search volume from different areas
and different languages, reflect the popularity of a particular query and users’
interests at a given moment in time.
2.3. Random Forest
To model the relationship between financial ratios and search volume of Google
trends and profit per month of the analyzed company, we used the Random
Forest algorithm [22] implemented in the “random Forest” package [23] within
the R environment. The important variables related profit can be found by using
Random Forest.
DOI: 10.4236/am.2018.91004 37 Applied MathematicsF.-C. Yuan, C.-H. Lee
RF is an ensemble earning technique developed by Breiman (2001) based on a
combination of a large set of decision trees. As the response variable (Profit per
month) is numerical, we confine our attention to regression Random Forest
models. The algorithm is as follows:
1) ntree bootstrap samples are randomly drawn from the original data.
2) For each of the bootstrap samples, an unpruned regression tree is grown.
At each node, rather than choosing the best split among all predictors, mtry of the
predictors are randomly selected and the best split is chosen among those pre-
dictors.
3) New data (out-of-bag elements) are predicted by averaging the predictions
of the ntree trees.
An estimate of the error rate (OOBerror) can be obtained by using out-of-bag
(OOB) elements as follows:
1) At each bootstrap iteration, the OOB elements are predicted using the tree
grown with the bootstrap sample.
2) On the average, each bootstrap sample leaves out about one-third of the
examples. These left-out examples can be used to form accurate estimates. For
instance, they can be used to give much improved estimates of node probabilities
and node error rates in decision trees. Thus, the OOB predictions can be aggre-
gated, and OOBerror be calculated. Using estimated outputs instead of the ob-
served outputs improves accuracy in regression trees. They can also be used to
give nearly optimal estimates of generalization errors for bagged predictors.
As OOBerror is an unbiased estimate of the generalization error, in general it is
not necessary to test the predictive ability of the model on an external dataset
[22]. The OOBerror help prevent over fitting and can also be used to choose an
optimal value of ntree and mtry. The “random Forest” package can also produce a
measure of variable importance by looking at the deterioration of the predictive
ability of the model when each predictor is replaced in turn by random noise.
The resulting deterioration is a measure of predictor importance. The most
widely used score of importance of a given variable in regression RF models is
the increasing in mean of the error of a tree (mean square error, MSE) and
computed as follows:
1 n
( )
2
MSE
= OOB ∑ yi − y iOOB
n i =1
(1)
where y iOOB is the average of the OOB predictions for the ith observation.
In this study, we use random forest to investigate the relationship between
company’s profit and financial ratios and Google data.
3. Results
First, the correlations among the predictors and profit were analyzed using
Spearman’s rank correlation method. The Spearman’s rank correlation coeffi-
cient (or Spearman’s rho) is a nonparametric measure of rank correlation which
describes the statistical dependence between the rankings of two variables. It
DOI: 10.4236/am.2018.91004 38 Applied MathematicsF.-C. Yuan, C.-H. Lee
evaluates the relationship during which two variables can be described using a
monotonic function. The Spearman correlation coefficient is defined as the
Pearson correlation coefficient of the rank variable [24]. The procedure makes
use of the two sets of ranks that often denoted by the Greek letter ρ (rho) and
expressed as follows:
6∑ di2
ρ = 1− (2)
(
n n2 − 1 )
where n is the number of measurements in each of the two variables. The di is
the ranked difference between the ith measurements for the two variables. The
results from the correlation analysis showed that profit is strongly correlated
with Operating Margin, Stock Index, and Google Trend (Table 1). There are
strong correlations (ρ > 0.8) among some predictors, such as, Stock Index and
Current Ratio, Stock Index and Operating Margin, Receivable Turnover and
Return On Equity, Receivable Turnover and Return On Assets, Equity To Capi-
tal and Current Ratio, Return On Equity and Return On Assets, Google Trend
and Operating Margin.
The relationships among predictors are further illustrated in Figure 2. The
results showed that some relationships are linear such as Equity to Capital and
Current Ratio, Return on Equity and Return on Assets; but others are nonlinear,
such as Stock Index and Current Ratio, Stock Index and Operating Margin, Re-
ceivable Turnover and Return on Equity, Receivable Turnover and Return on
Assets, Google Trend and Operating Margin.
The relationships between company’s profit and the predictors are depicted in
Figure 3. From Figure 3, we can see high Stock Index values are typically asso-
ciated with the “high” profit. In contrast, low Stock Index values are associated
with the “low” profit. A similar pattern was observed for Google Trend and Op-
erating Margin. These relationships are typically non-linear. These variables
could potentially be good predictors of company’s profit.
Table 1. Spearman correlation coefficients (ρ) among profit and 8 predictors.
Stock Receivable Equity to Current Return on Return on Google Operating
Index Turnover Capital Ratio Equity Assets Trend Margin
Stock Index 1 −0.32 0.66 0.84 0.32 0.32 0.61 0.84
Receivable Turnover −0.32 1 0.02 −0.21 0.79 0.79 0.18 −0.14
Equity to Capital 0.66 0.02 1 0.83 0.48 0.48 0.49 0.57
Current Ratio 0.84 −0.21 0.83 1 0.36 0.36 0.44 0.69
Return on Equity 0.32 0.79 0.48 0.36 1 1 0.59 0.43
Return on Assets 0.32 0.79 0.48 0.36 1 1 0.59 0.43
Google Trend 0.61 0.18 0.49 0.44 0.59 0.59 1 0.76
Operating Margin 0.84 −0.14 0.57 0.69 0.43 0.43 0.76 1
Profit per Month 0.76 0.06 0.46 0.6 0.56 0.56 0.75 0.81
DOI: 10.4236/am.2018.91004 39 Applied MathematicsF.-C. Yuan, C.-H. Lee Figure 2. The relationships among the 8 predictors. Figure 3. The relationships between profit and 8 predictors. DOI: 10.4236/am.2018.91004 40 Applied Mathematics
F.-C. Yuan, C.-H. Lee

                             Figure 4. Predictor importance plot generated by the random forest algorithm included
                             in the random Forest package for R software.

                               Figure 4 shows the ranking of predictors by their importance measured as the
                             increased mean square error (%IncMSE), which represents the deterioration of
                             the predictive ability of the model when each predictor is replaced in turn by
                             random noise. Higher %IncMSE indicates greater variable importance.
                               Only few of the descriptors contributed noticeably to the impact of company’s
                             profit, namely stock index, operating margin and Google Trend index. In de-
                             creasing order of importance the other predictors included in the RF model
                             were: current ratio, return on equity, return on assets, equity to capital and re-
                             ceivable turnover. Partial plots representing the marginal effect of single va-
                             riables included in the RF model on impacts of company’s profit are shown in
                             Figure 3.

                             4. Discussion
                             In this paper, we showed that the application of a Random Forest model pro-
                             vides an effective methodology for identifying the variables that have an impact
                             on profits. The out-of-bag estimates of the error rate (OOBerror) were used to se-
                             lect the optimum Random Forest parameters (mtry = 3, ntree = 1000). From the
                             results of RF model, we can see Google trend also plays a major role in deter-
                             mining the company’s profit except the stock index and operating margin.
                             Therefore, Google trend index can also be one of indicators of corporate profits.

DOI: 10.4236/am.2018.91004                         41                                        Applied Mathematics
F.-C. Yuan, C.-H. Lee
References
[1] Ginsberg, J., Mohebbi, M.H., Patel, R.S., Brammer, L., Smolinski, M.S. and Brilliant,
L. (2009) Detecting Influenza Epidemics Using Search Engine Query Data. Nature,
457, 1012-1014. https://doi.org/10.1038/nature07634
[2] Carneiro, H.A. and Mylonakis, E. (2009) Google Trends: A Web-Based Tool for
Real-Time Surveillance of Disease Outbreaks. Clinical Infectious Diseases, 49,
1557-1564. https://doi.org/10.1086/630200
[3] Althouse, B.M., Ng, Y.Y. and Cummings, D.A. (2011) Prediction of Dengue Inci-
dence Using Search Query Surveillance. PLoS Neglected Tropical Diseases, 5, e1258.
https://doi.org/10.1371/journal.pntd.0001258
[4] Vaughan, L. and Romero-Frías, E. (2014) Web Search Volume as a Predictor of
Academic Fame: An Exploration of Google Trends. Journal of the Association for
Information Science and Technology, 65, 707-720.
https://doi.org/10.1002/asi.23016
[5] Baram-Tsabari, A. and Segev, E. (2011) Exploring New Web-Based Tools to Identi-
fy Public Interest in Science. Public Understanding of Science, 20, 130-143.
https://doi.org/10.1177/0963662509346496
[6] Carrière-Swallow, Y. and Labbé, F. (2013) Nowcasting with Google Trends in an
Emerging Market. Journal of Forecasting, 32, 289-298.
https://doi.org/10.1002/for.1252
[7] D’Amuri, F. (2009) Predicting Unemployment in Short Samples with Internet Job
Search Query Data. University Library of Munich, Germany.
[8] Marcucci, J. (2009) “Google it!” Forecasting the US Unemployment Rate with a
Google Job Search Index. University Library of Munich, Germany.
[9] Askitas, N. and Zimmermann, K.F. (2009) Google Econometrics and Unemploy-
ment Forecasting. Applied Economics Quarterly, 55, 107-120.
https://doi.org/10.3790/aeq.55.2.107
[10] Choi, H. and Varian, H. (2009) Predicting the Present with Google Trends.
http://google.com/googleblogs/pdfs/google_predicting_the_present.pdf
[11] Vosen, S. and Schmidt, T. (2011) Forecasting Private Consumption: Survey-Based
Indicators vs. Google Trends. Journal of Forecasting, 30, 565-578.
https://doi.org/10.1002/for.1213
[12] McLaren, N. and Shanbhogue, R. (2011) Using Internet Search Data as Economic
Indicators. Bank of England Quarterly Bulletin Q2, 134-140.
https://doi.org/10.2139/ssrn.1865276
[13] Kholodilin, K., Podstawski, M., Siliverstovs, B. and Bürgi, C. (2009) Google Searches
as a Means of Improving the Nowcasts of Key Macroeconomic Variables (No. 946).
Discussion Papers, German Institute for Economic Research.
https://doi.org/10.2139/ssrn.1507084
[14] Dzielinski, M. (2012) Measuring Economic Uncertainty and Its Impact on the Stock
Market. Finance Research Letters, 9, 167-175.
https://doi.org/10.1016/j.frl.2011.10.003
[15] Wu, L. and Brynjolfsson, E. (2015) The Future of Prediction: How Google Searches
Foreshadow Housing Prices and Sales. In: Goldfarb, A.S.M. and Tucker, C.E., Eco-
nomic Analysis of the Digital Economy, University of Chicago Press, 89-118.
https://doi.org/10.7208/chicago/9780226206981.003.0003
[16] Hand, C. and Judge, G. (2012) Searching for the Picture: Forecasting UK Cinema
Admissions using Google Trends Data. Applied Economics Letters, 19, 1051-1055.
DOI: 10.4236/am.2018.91004 42 Applied MathematicsF.-C. Yuan, C.-H. Lee
https://doi.org/10.1080/13504851.2011.613744
[17] Scott, S.L. and Varian, H.R. (2015) Bayesian Variable Selection for Nowcasting
Economic Time Series. In: Goldfarb, A.S.M. and Tucker, C.E., Eds., Economic
Analysis of the Digital Economy, University of Chicago Press, Chicago, 119-135.
https://doi.org/10.7208/chicago/9780226206981.003.0004
[18] Goel, S., Hofman, J.M., Lahaie, S., Pennock, D.M. and Watts, D.J. (2010) Predicting
Consumer Behavior with Web Search. Proceedings of the National Academy of
Sciences, 107, 17486-17490. https://doi.org/10.1073/pnas.1005962107
[19] Pai, P.-F., Hung, K.-C. and Lin, K.-P. (2014) Tourism Demand Forecasting using
Novel Hybrid System. Expert Systems with Applications, 41, 3691-3702.
https://doi.org/10.1016/j.eswa.2013.12.007
[20] Saidi, N., Scacciavillani, F. and Ali, F. (2010) Forecasting Tourism in Dubai. Dubai
International Finance Centre, Economic Note No. 8.
[21] Lehtinen, J. (1996) Financial Ratios in an International Comparison: Validity and
Reliability. UniversitasWasaensis, Vaasa.
[22] Breiman, L. (2001) Random Forests. Machine Learning, 45, 5-32.
https://doi.org/10.1023/A:1010933404324
[23] Liaw, A. and Wiener, M. (2002) Classification and Regression by Random Forest. R
News, 2, 18-22.
[24] Myers, J.L. and Well, A.D. (2003) Research Design and Statistical Analysis. 2nd Edi-
tion, Lawrence Erlbaum Associates, Mahwah.
DOI: 10.4236/am.2018.91004 43 Applied MathematicsYou can also read