INVESTIGATION OF SURFACE MORPHOLOGY OF 6H-SIC IRRADIATED WITH HE+ AND H2 - MDPI
←
→
Page content transcription
If your browser does not render page correctly, please read the page content below
materials
Article
Investigation of Surface Morphology of 6H-SiC
Irradiated with He+ and H2+ Ions
Qiang Shen 1 , Guang Ran 1, *, Wei Zhou 2 , Chao Ye 1 , Qijie Feng 2 and Ning Li 1, *
 1   College of Energy, Xiamen University, Xiamen 361102, China; shenqiang1989@126.com (Q.S.);
     kim.yc@foxmail.com (C.Y.)
 2   China Academy of Engineering Physics, Mianyang 621900, China; zhouwei_801202@163.com (W.Z.);
     fengqijie@caep.cn (Q.F.)
 *   Correspondence: gran@xmu.edu.cn (G.R.); ningli@xmu.edu.cn (N.L.); Tel.: +86-0592-2185-278 (G.R.)

 Received: 17 January 2018; Accepted: 9 February 2018; Published: 11 February 2018

 Abstract: Light ion implantation is one of the important procedures of smart cut for SiC-based
 semiconductor fabrication. This work investigated the surface morphologies and microstructures
 of single crystal 6H-SiC irradiated by one or both of H2 + and He+ ions at room temperature and
 then annealed at specific temperatures. Blisters evolved from the coalescence of H nanocracks were
 formed in the H2 + and He+ +H2 + irradiated sample surface, while circular ripples originated from
 the pressure release of helium bubbles after high temperature annealing were formed in the He+
 irradiated sample surface. The lateral radius a of the blisters in the irradiated sample with low H2 +
 fluence was larger than that in the irradiated sample with high H2 + fluence and with He+ +H2 + ions.
 About 8–58% of implanted H atoms contributed to the formation of the blisters. Compared with
 other irradiated samples, the ratio of w0 /a and the density of the blisters in the He+ +H2 + irradiated
 samples were largest. The stress field of the blisters was simulated using finite element method and
 the inner pressure in the blisters was also calculated. The corresponding mechanism was analyzed
 and discussed.

 Keywords: SiC; surface morphology; irradiation; blister

1. Introduction
      SiC-on-insulator (SiCOI) structures are considered as the most promising semiconductor materials
for high-speed, high-power and high-temperature microelectronic applications due to their superior
properties, i.e., high temperature physical and chemical stability, low power dissipation, and high
radiation resistance [1,2]. Smart cut is an efficient and economical technology for manufacturing
SiCOI structures. The process contains three main steps: (1) light ion implantation; (2) wafer bonding;
and (3) fracture to achieve thin layer transfer [3–5]. H and He ions are usually used as light ion
implantation. However, surface features induced by ion implantation, for sample, blistering and
exfoliation, have a great influence on the layer transfer and the properties of SiCOI structures [6].
Therefore, it is of great importance to investigate the irradiation-induced defects and their recovery
process during H and He ion implantation and then annealing.
      Surface blistering has been widely investigated in the various kinds of materials, e.g., Si [7,8],
W [9,10], Ge, GaAs [11], etc. However, few works study the blisters in SiC materials after gas ion
irradiation. The literature on SiC irradiated with H, D and He ions reported the formed surface
blisters [12,13]. The relationship between the efficiency of H blistering in the SiC and H ion irradiation
parameters, i.e., ion fluence and irradiation temperature, were also studied [14,15]. The average size
of H blisters decreased with the increase H+ ion fluences from 6 × 10¹⁶ H+ /cm2 to 1 × 10¹⁷ H+ /cm2
while the number density of blisters increased distinctly when the sample was irradiated with 180 keV
H+ ions and annealing at 950 ◦ C for 30 min [14]. Li [15] found that the average diameters of H blisters

Materials 2018, 11, 60; doi:10.3390/min8020060                               www.mdpi.com/journal/materials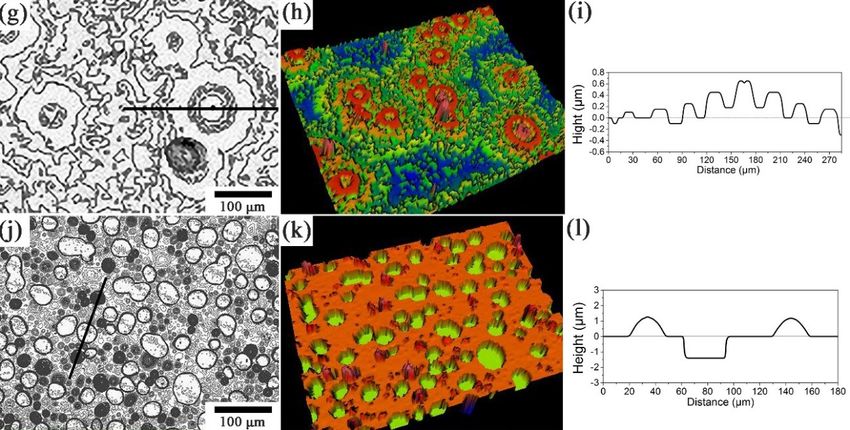
Materials 2018, 11, 60 2 of 11
increase with the increase of irradiation temperature in the range from room temperature (RT) to
773 K. The evolution of amorphous structure in the irradiated layer also affected the formation of
blisters during
Materials 2017,the
10, xannealing process [16]. Other influential blistering parameters, e.g., 2ion
FOR PEER REVIEW of 11species
and co-effects of several kinds of ions, should be further researched. Igarashi [13] compared the
shape ions and annealing at 950 °C for 30 min [14]. Li [15] found that the average diameters of H blisters
difference between H-blisters and He-blisters and reported the lateral radius of H-blisters
increase with the increase of irradiation temperature in the range from room temperature (RT) to 773 K.
was larger than that of He-blisters, and the opposite for the vertical deformation of He-blisters.
The evolution of amorphous structure in the irradiated layer also affected the formation of blisters
However,
duringthetheessential
annealing reason for[16].
process the difference needsblistering
Other influential to be further investigated.
parameters, In mostand
e.g., ion species inert gas
ion irradiated
co-effectsmaterials, blistering
of several kinds is believed
of ions, should be to be evolved
further fromIgarashi
researched. the accumulation
[13] comparedofthe gasshape
atoms and
coalescence of gas
difference bubbles
between [17–19].
H-blisters andHowever,
He-blistersin andthe H irradiated
reported SiC,
the lateral H atoms
radius were able
of H-blisters was to terminate
larger
than that
the broken Si-Cofbonds
He-blisters,
and thenand diffused
the opposite for form
in the the vertical
of H2 ,deformation
CH4 or SiHof4 ,He-blisters.
where the However, the
lateral propagation
essentialand
of H cracks reason for the
blister difference needs
deformation weretoinevitably
be further investigated. In most inert
affected [13,19,20]. gas ion
Thus, theirradiated
mechanism of
materials, blistering is believed to be evolved from the accumulation of gas atoms and coalescence of
blistering in SiC is not completely understood. Meanwhile, the exfoliation of blisters was observed
gas bubbles [17–19]. However, in the H irradiated SiC, H atoms were able to terminate the broken
after blistering while few works were done to explore the mechanism.
Si-C bonds and then diffused in the form of H2, CH4 or SiH4, where the lateral propagation of H cracks
Inand
theblister
present work, single
deformation crystal SiC
were inevitably irradiated
affected by one
[13,19,20]. Thus,orthe
both of H2 + of
mechanism and He+ ions
blistering and then
in SiC
annealing were done to investigate the surface features and microstructures. To get
is not completely understood. Meanwhile, the exfoliation of blisters was observed after blistering a better understanding
of the mechanism
while few works of blistering
were doneand exfoliation,
to explore the stress field of the blisters was simulated using finite
the mechanism.
In the and
element method present
thework,
inner single crystal
pressure SiCblisters
in the irradiated
wasbyalso
onecalculated.
or both of H 2+ and
The He+ ions and mechanism
corresponding then
annealing were
was analyzed and discussed. done to investigate the surface features and microstructures. To get a better understanding
of the mechanism of blistering and exfoliation, the stress field of the blisters was simulated using
finite element method and the inner pressure in the blisters was also calculated. The corresponding
2. Experiments
mechanism was analyzed and discussed.
The single crystal 6H-SiC samples with [0001] crystal direction from MTI Corporation were
2. Experiments
irradiated by H2+ or/and He+ ions at room temperature and subsequently annealed at some given
experiment conditions.
The The
single crystal experiment
6H-SiC samples conditions
with [0001] of ion direction
crystal irradiation
fromand
MTIannealing
Corporationwere listed in
were
irradiated
Table 1. by H2+ or/andper
The displacement He+ atom
ions at(dpa)
room and
temperature
implanted and ion
subsequently annealed
concentration of at + and
H2some He+ were
given
experiment
simulated by SRIM conditions. The experiment
2013 software (SRIM 2013,conditions of ion irradiation and annealing
http://www.srim.org/) with quick were
modelisted
inin
order to
Table 1. The displacement per + atom (dpa)+ and implanted ion concentration of H2+ and He+ were
achieve similar peak depth of H2 and He ion concentration, as shown in Figure 1. The displacement
simulated by SRIM 2013 software (SRIM 2013, http://www.srim.org/) with quick mode in order to
energies of C and Si were assumed+ to be 20 eV and 35 eV, respectively. The concentration peaks of
achieve similar peak depth of H2 and He+ ion concentration, as shown in Figure 1. The displacement
+
H2 (200 keV)ofand +
HeSi (400
energies C and were keV) ionstoappeared
assumed be 20 eV and at 35
theeV,
depth of ~1.1 The
respectively. and ~1.2 µm,
µm concentration respectively.
peaks of
The irradiated and annealed sample surface was characterized by ZeGage NewView™
H2 (200 keV) and He (400 keV) ions appeared at the depth of ~1.1 μm and ~1.2 μm, respectively.
+ + 6300 3D (three
dimension) optical and
The irradiated profiler (3D sample
annealed OP) (Zygo Corp.,
surface Middlefield,byCT,
was characterized USA)NewView™
ZeGage with 0.1 nm vertical
6300 accuracy.
3D (three
dimension) optical profiler (3D OP) (Zygo Corp., Middlefield, CT, USA) with 0.1 nm
Cross-sectional structures of the blisters in the sample surface were examined by cross-sectionalvertical accuracy.
Cross-sectional
scanning structures of
electron microscopy the blisters
(X-SEM) and in the sample surface
cross-sectional were examined
transmission bymicroscopy
electron cross-sectional
(X-TEM).
scanning electron microscopy (X-SEM) and cross-sectional transmission electron microscopy (X-TEM).
The sample surface used to X-SEM analysis was protected by epoxy glue and then polished by the
The sample surface used to X-SEM analysis was protected by epoxy glue and then polished by the
diamond paper carefully to avoid the damage of blisters. The preparation methods of X-TEM samples
diamond paper carefully to avoid the damage of blisters. The preparation methods of X-TEM samples
could could
be found in our
be found previous
in our previouswork
work[21].
[21].
(a) (b)
Figure 1. The profiles of irradiation damage and ion concentration of: 400 keV He+ with a fluence of
Figure 1. The profiles of irradiation damage and ion concentration of: 400 keV He+ with a fluence of
1 × 10¹⁷ He+/cm2 (a); and 200 keV H2+ with a fluence of 5 × 10¹⁶ H2+/cm2 (b), simulated by SRIM 2013
17 +
1 × 10software
He /cm 2 (a); and 200 keV H + with a fluence of 5 × 10¹⁶ H + /cm2 (b), simulated by SRIM
with quick mode. 2 2
2013 software with quick mode.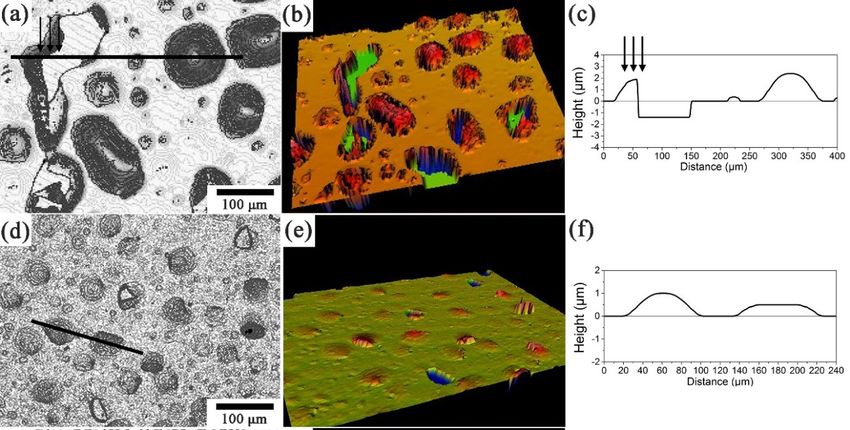
Materials 2018, 11, 60 3 of 11
Table 1. Irradiation conditions of H2 + and He+ ions.
200 keV H2 + 400 keV He+
Sample Annealing Conditions
5 × 10¹⁶ H2 + /cm2 1 × 10¹⁷ H2 + /cm2 1 × 10¹⁷ He+ /cm2
√
1 −
√ − at 900 ◦ C for 30 min
2 − −
√ at 900 ◦ C for 30 min
3 −
√ − √ at 1500 ◦ C for 30 min
4 − at 900 ◦ C for 30 min
3. Results and Discussion
Figure 2 shows the morphologies and topographies of the irradiated and annealed SiC surface
characterized by 3D optical profiler. Figure 2a,b presents the two-dimensional (2D) morphologies
and 3D topographies of 6H-SiC irradiated with a fluence of 5 × 10¹⁶ H2 + /cm2 and then annealed
at 900 ◦ C for 30 min. Blisters are formed on the sample surface. Figure 2c is the cross-sectional
profile of the blisters in the 2D OP image along the straight line in Figure 2a. The corresponding
morphology, topography and the cross-sectional profile of the blisters in Sample 2 are shown in
Figure 2d–f, respectively. Compared with the test results of Sample 1, the size of the blisters is
decreased with increasing H2 + ion fluence. The density of the formed blisters is obviously increased
when the He+ irradiated sample was then implanted with H2 + ions (Sample 4) (compare Figure 2a,b
with Figure 2j,k). Meanwhile, the blisters will exfoliate from SiC matrix when they grow up to a critical
size, which could be attributed to the high stress concentration. Approximately 50% blisters exfoliate
from the surface of the He+ and H2 + irradiated sample while very few blisters exfoliate from the H2 +
irradiated sample after annealing for 30 min at 900 ◦ C. Furthermore, the blisters in the He+ and H2 +
irradiated sample exfoliate along the boundary between the blisters and SiC substrate, as shown in
Figure 2h. However, the exfoliation shape of blisters in the H2 + irradiated samples is rather irregular.
Figure 2c shows a partially exfoliated blister. The cross-sectional profile of the blisters indicates that
a steep fracture cliff has been formed after annealing, as indicated by arrows in Figure 2a,c, which is
due to part of the blister remaining, while the other part is exfoliated. The depth of the crater is uniform
and corresponding value is approximately 1.4 µm.
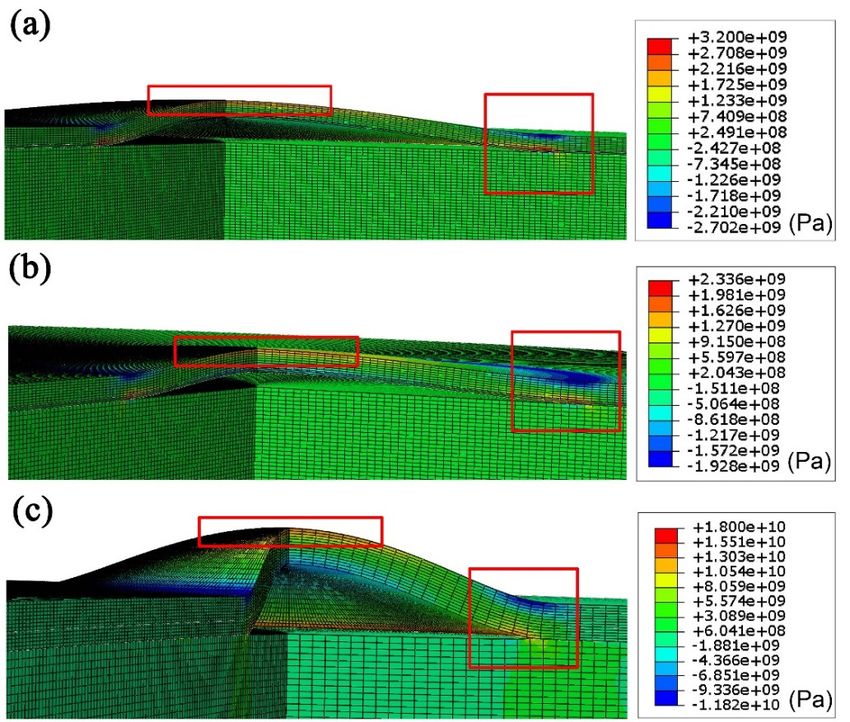
The surface morphologies and topographies of the 6H-SiC irradiated by He+ ions with a fluence
of 1 × 10¹⁷ He+ /cm2 are obviously different from other three experiment conditions. Surface features
start to be formed when the annealing temperature is over 1200 ◦ C. After be irradiated with a fluence
of 1 × 10¹⁷ He+ /cm2 and then annealed at 1500 ◦ C for 30 min, some circular ripples are formed on the
sample surface, as shown in Figure 2j–l.
X-SEM images of a typical blister in Sample 1 show the cross-sectional morphology (Figure 3a).
The blister shape is considered pure bent and the curvature is three-dimensionally successive.
The thickness of the blister is about 1.4 µm, as shown in Figure 3b. The shape of the blisters in
the H2 + and He+ irradiated samples can be considered as circular-plate shape. The function used to
describe the blister profile (Normal to the sample surface) can be expressed as [22]:
2
r2
wr = w0 ( 1 − ) (1)
a2
where a, r, w0 and wr are the maximum radius of the bottom circle of the blisters, radius, the maximum
amplitude value at the center of the blister and the amplitude of the blister at a given radius r,
respectively, which are indicated in the simplified model of the blister, as shown in Figure 3c.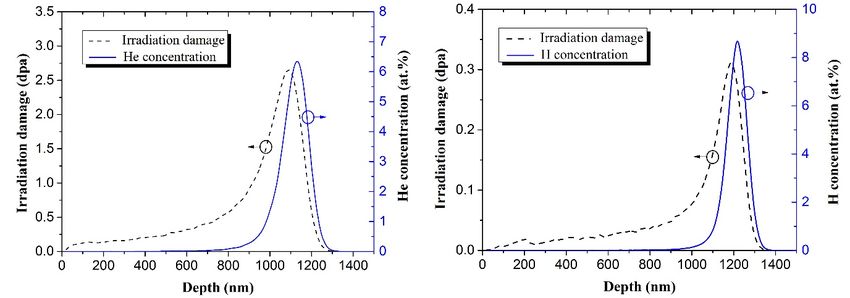
Materials 2018, 11, 60 4 of 11
Materials 2017, 10, x FOR PEER REVIEW 4 of 11
Figure 2. 2D morphologies, 3D topographies and the cross-sectional profiles of the blisters in the
Figure 2. 2D morphologies, 3D topographies and the cross-sectional profiles of the blisters in the irradiated
irradiated and annealed 6H-SiC sample surface: (a–c) Sample 1; (d–f) Sample 2; (g–i) Sample 3; and
and annealed 6H-SiC sample surface: (a–c) Sample 1; (d–f) Sample 2; (g–i) Sample 3; and (j–l) Sample 4.
(j–l) Sample 4.
According
Accordingtotothe thesimplified
simplified model
modelof the blister
of the in Figure
blister 3c, the3c,
in Figure values of lateral
the values of radius
lateral (a), the vertical
radius (a), the
deformation height (w
vertical deformation height 0 ) and the thickness of the blisters were measured in irradiated
(w0) and the thickness of the blisters were measured in irradiated Samples Samples 1, 2, and 4.
The
1, 2,statistical
and 4. The results of theresults
statistical distribution
of theof a and w0 are
distribution ofshown
a and w in0 Figure
are shown4. Thein radius
Figure of 4. the
Theblisters
radius in of
Sample 1 varies from 5 to 65 µm and the numbers of the blisters have
the blisters in Sample 1 varies from 5 to 65 μm and the numbers of the blisters have a homogeneousa homogeneous distribution in
this range. The
distribution in vertical
this range. deformation
The vertical height varies in the
deformation range
height of 0.3–2.5
varies in theµm. As the
range H2 + ionμm.
of 0.3–2.5 fluence
As theis
increased, the radius
H2+ ion fluence become smaller
is increased, the radiusin Sample
become 2. smaller
The vertical deformation
in Sample 2. Theheight decreases
vertical significantly
deformation height
in Sample 2. Irradiated with He + and H + ions in Sample+ 4, the lateral radius of the blisters is smallest
decreases significantly in Sample 2. Irradiated 2 with He and H2 ions in Sample 4, the lateral radius
+
and distributed
of the blisters inis asmallest
narrow and rangedistributed
of 1–15 µm.inHowever,
a narrowthe vertical
range of deformation
1–15 μm. However, height of the the blisters
vertical
in Sample 4 does
deformation height notofchange too much
the blisters compared
in Sample 4 doesto notthat of Sample
change too much1. That means to
compared thethat
ratioof (w 0 /a) of
Sample 1.
the blisters in Sample 4 is largest. The number distributions
That means the ratio (w0/a) of the blisters in Sample 4 is largest. The number of a and w 0 in Figure 4b–d are very
distributions of a and w0close to
normal
in Figuredistribution
4b–d are whileverytheclose
number in Figuredistribution
to normal 4a has a homogeneous
while the one. numberFor theinfurther
Figurecalculation
4a has a
of stress and inner
homogeneous one.pressure,
For the average
further values stress anda,inner
of theofparameters
calculation w0 and h are calculated
pressure, average and valuesshown in
of the
Table 2. The average values are calculated with Gaussian fitting for the data
parameters a, w0 and h are calculated and shown in Table 2. The average values are calculated with in Figure 4b–d and averaging
method
Gaussian in Figure
fitting 4a.
for Observed
the data in from the morphologies
Figure 4b–d and averagingand topographies
method inofFiguresample4a. surface,
Observed the exfoliated
from the
morphologies and topographies of sample surface, the exfoliated blisters are relatively few in the H2+
irradiated samples. However, nearly half of blisters exfoliate from the He+ and H2+ irradiated sample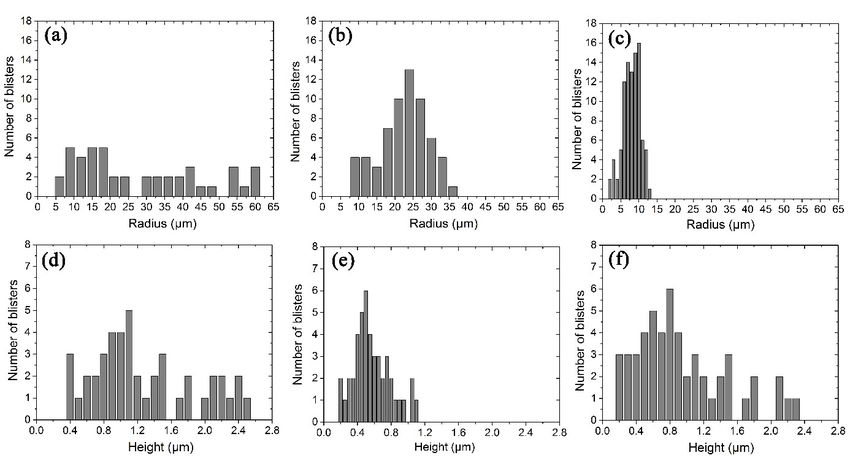
Materials 2018, 11, 60                                                                                                    5 of 11
Materials 2017, 10, x FOR PEER REVIEW                                                                                     5 of 11

surface
blisters  when
         are      they10, xgrow
              relatively
      Materials 2017,             to
                                  in athe
                             fewPEER
                            FOR         critical  size. The average
                                           H2 + irradiated
                                       REVIEW                samples.radius   (a) ofnearly
                                                                        However,      the exfoliated   blisters
                                                                                             half of blisters   in 5Sample
                                                                                                              exfoliate
                                                                                                                     of 11from 4
is approximately
the     +           +
    He and H2 irradiated15.6 μm whilesample thesurface
                                                  verticalwhen
                                                            deformation
                                                                they grow height   (w0) is size.
                                                                            to a critical  unavailable    because
                                                                                                 The average         only
                                                                                                                radius    (a)the
                                                                                                                              of
      surface
concave   pits  when
                 stayed theyon grow
                                the   to a critical
                                     sample         size. The average radius (a) of the exfoliated blisters in Sample 4
                                                surface.
the exfoliated blisters in Sample 4 is approximately 15.6 µm while the vertical deformation height (w0 ) is
      is approximately 15.6 μm while the vertical deformation height (w0) is unavailable because only the
unavailable because only the concave pits stayed on the sample surface.
      concave pits stayed on the sample surface.

            Figure 3. (a) X-SEM image of a typical blister in Sample 1; (b) the thickness of the blister; and
      Figure 3.3. (a)
                   (a)X-SEM
                       X-SEM imageofof      a typical    blister in Sample 1; (b) the thickness of the blister; and
      Figure(c) the simplifiedimage      a typical
                               model of the  blister.blister in Sample 1; (b) the thickness of the blister; and (c) the
      (c) the simplified
      simplified   model ofmodel   of the blister.
                              the blister.

            Figure 4. The distribution characteristics of the radius and height of the blisters in the cross-sectional:
            (a,d) Sample 1; (b,e) Sample 2; and (c,f) Sample 4.

      Figure 4. TheTable
                    distribution  characteristics
                          2. The parameter         of the
                                           values of   theblisters
                                                           radiusinandtheheight   of the
                                                                          irradiated  andblisters in6H-SiC.
                                                                                           annealed  the cross-sectional:
      Figure 4. The distribution characteristics of the radius and height of the blisters in the cross-sectional:
      (a,d) Sample 1; (b,e) Sample 2; and (c,f) Sample 4.
      (a,d) Sample 1; (b,e) Sample 2;Sample         a (μm)4.
                                      and (c,f) Sample            w0 (μm) h (μm)
                                         1       28.7 ± 13.0 1.1 ± 0.4 1.4 ± 0.1
               Table 2. The parameter values
                                         2      of21.6
                                                    the±blisters
                                                           8.0 0.5 in the
                                                                       ± 0.2irradiated
                                                                                1.4 ± 0.1and annealed 6H-SiC.
                                         4
                                    Sample        a9.6  ± 4.0
                                                     (μm)         0.90 ±(μm)
                                                                  w      0.4 1.4h ±(μm)
                                                                                      0.1
                                          1        28.7 ± 13.0      1.1 ± 0.4     1.4 ± 0.1
                                          2        21.6 ± 8.0       0.5 ± 0.2     1.4 ± 0.1
                                          4         9.6 ± 4.0       0.9 ± 0.4     1.4 ± 0.1
Materials 2018, 11, 60 6 of 11
Table 2. The parameter values of the blisters in the irradiated and annealed 6H-SiC.
Sample a (µm) w0 (µm) h (µm)
1 28.7 ± 13.0 1.1 ± 0.4 1.4 ± 0.1
2 21.6 ± 8.0 0.5 ± 0.2 1.4 ± 0.1
4 9.6 ± 4.0 0.9 ± 0.4 1.4 ± 0.1
The inner gas pressure, stress distribution and implanted ion fluence in the blisters were estimated
by finite element method (FEM) simulation with ABAQUS software (ABAQUS 6.13, Dassault Systèmes
Corp., Providence, RI, USA) [23–25]. An axisymmetric system is used. In fact, ion irradiation inevitably
changes the microstructure and then affects the mechanical properties of SiC [26,27]. During FEM
simulation, SiC is considered as ideal brittle material and only elastic deformation is taken into account.
Poisson’s Ratio (v) and yield strength of SiC sample are set as 0.14 [28] and 21 GPa [29], respectively.
According to our TEM observation results of the as-irradiated samples, the irradiated layer and
sandwich structure are formed near the sample surface. To simplify the irradiation effect, the sample is
divided into three layers during FEM analysis: the surface layer, the irradiated layer and the substrate
layer. The thickness measured from cross-sectional TEM images and elastic modulus referenced from
the literatures of these three layers in Samples 1, 2, and 4 are listed in Table 3. Then, an ultra-thin crack
is introduced at the depth corresponding to the measured depth of blisters (~1.4 µm). Finally, the gas
pressure value will be obtained when the deformation height of surface layer meets the experimental
value at the center of the blister (w0 ) of the blisters [23,24]. Additionally, the inner gas pressure is
also calculated according to the theoretical elastic model developed by Timoshenko [22]. The elastic
modulus E in Equation (2) is modified with thickness-weighted calculation according to the divided
layer structure. The calculating equation is shown as follows:
Es · Ts + Ei · Ti
Em = (2)
Ts + Ti
where, Em , Es , Ts , Ei , and Ti represent the modified value of elastic modulus used for calculating the
inner pressure of blisters theoretically, elastic modulus of surface layer, thickness of surface layer,
elastic modulus of irradiated layer and thickness of irradiated layer, respectively. The values of Es , Ts ,
Ei , and Ti are found in Table 3. The values of Em were calculated to be 489.4, 481.8 and 435.9 GPa for
Samples 1, 2, and 4, respectively. The inner gas pressure (p) can be calculated according to following
equation [30]:
16Em h3 w0
p= 4 (3)
3a (1 − v2 )
where, p, Em , h, w0 , a, and v represent the pressure, the modified value of elastic modulus, the thickness
of the blisters, the vertical deformation of blisters, the radius of bottom circle of blisters and Poisson’s
ratio, respectively.
Table 3. The structure parameters used in FEM analysis.
Thickness (µm)
Sample Elastic Modulus (GPa) [31,32]
1 2 4
Surface layer 1.200 1.15 0.850 520
Irradiated layer 0.20 0.250 0.550 306
Substrate layer * 30 30 30 520
* The same thickness ~30 µm of substrate layer was used for all the samples during FEM modeling.
Table 4 lists the gas pressure inside the blisters calculated from theoretical model and FEM
simulation. The data show that the FEM simulation results are comparable with these obtained from
theoretical model. For the only H2 + irradiated and then annealed Samples 1 and 2, the inner gas
pressure stays at tens of MPa. However, in the He+ and H2 + irradiated and annealed Sample 4, the innerMaterials 2018, 11, 60 7 of 11
pressure researches several hundreds of MPa. Muto’s work indicated that the inner gas pressure was
about 400 MPa in the Si sample after irradiation with a fluence of 1 × 10¹⁸ H+ /cm2 [23]. Hong gave
10–1000 MPa pressure range in the Si sample irradiated with a fluence of 1 × 10¹⁷ H+ /cm2 [33].
The calculated pressures in our work is reasonably in this range.
Table 4. Inner gas pressure and stress from theoretical calculation and FEM simulation.
Gas Pressure, p (MPa)
Sample (œr )r=0 (GPa) (œr )r=a (GPa)
Theoretical Calculation FEM Simulation
1 11.8 13.4 0.74 2.8
2 16.5 14.2 0.8 2.1
4 689.5 573 6.3 15.2
Figure 5 shows the stress contours of the blisters on the surfaces of Samples 1, 2, and 4 derived
from FEM. The stress concentrates at the center and the boundary of blisters, marked with red
boxes in Figure 5. The maximum values of concentrated stress are distributed on the lower face of
blisters and the extreme stress (r = 0 and r = a) on the lower surface of the blister, as listed in Table 4.
The concentrated stress stays small for the H2 + irradiated samples. In the He+ and H2 + irradiated
blisters, the stress at the boundary increased rapidly to 15.2 GPa. The FEM simulation also reveals that
when the inner pressure for the exfoliated blisters (with lateral radius of ~15.6 µm) reaches 372 MPa,
the stress would exceed the theoretical yield strength (equals to fracture strength of brittle materials)
of 21 GPa [29]. Consequently, the formed blisters can easily fracture and exfoliate along the boundary
between the blisters and SiC matrix in Sample 4, which is the reason that approximately ~50% blisters
exfoliate from the H2 + and He+ irradiated sample surface.
The number of gas molecules inside the blister are calculated using van der Waals equation
as following:
V γpV 2 + RTV 2 PV 3
n3 − n2 + n− =0 (4)
γ βγ βγ
where, n, V, P, T and R are the number of molecules, blister volume, pressure, kelvin temperature,
and gas constant, respectively. The parameters “β” and “γ” in Equation (3) are van der Waals
constants (for H2 : β = 0.245 × 10⁻⁶ atm·m6 /mol2 and γ = 0.0267 × 10⁻⁶ atm·m6 /mol2 ; and for He:
β = 0.034 × 10⁻⁶ atm·m6 /mol2 and γ = 0.0238 × 10⁻⁶ atm·m6 /mol2 ). Considered the delamination
depth of blisters, the parameters of H2 are used in Equation (3). The blister volume can be obtained
from Equation (4):
πa2 w0
V= (5)
3
Table 5 lists the calculated molecules (n) and ion fluences (N) inside the blisters. The pressure
used in Equation (3) is calculated by FEM simulation, as shown in Table 3. In the H2 + irradiated
Sample 1, the percentage of H atoms inside the blisters is as high as 58% of total implanted H atoms.
In the H2 + of 1 × 10¹⁷ H2 + /cm2 irradiated samples, the calculated hydrogen molecule and fluence
are smaller. Only 8% of implanted H2 + ions contribute to the blister formation. Previous literature
reported that 20–40% of total implanted gas ions were contributed to the H-blisters in the Si [34] and
W [35,36] materials. Thus, the calculated molecules in the blisters are reasonable in the present work.
Table 5. Average values of blisters estimated by FEM.
Sample V (m3 ) S (m2 ) n N (Ions/cm2 )
1 9.5 × 10⁻¹⁶ 2.6 × 10⁻⁹ 7.6 × 10¹¹ 2.9 × 10¹⁶
2 2.4 × 10⁻¹⁶ 2.9 × 10⁻¹⁰ 2.1 × 10¹¹ 8.0 × 10¹⁵
4 8.7 × 10⁻¹⁷ 1.5 × 10⁻⁹ 1.2 × 10¹² 4.7 × 10¹⁶Materials 2018, 11, 60 8 of 11
Materials 2017, 10, x FOR PEER REVIEW 8 of 11
Figure 5. FEM simulation results showing the stress distribution in the blisters in irradiated: (a) Sample 1;
Figure 5. FEM simulation results showing the stress distribution in the blisters in irradiated: (a) Sample 1;
(b) Sample 2; and (c) Sample 4.
(b) Sample 2; and (c) Sample 4.
Figure 6a–c shows the bright field X-TEM images of SiC Samples 1, 2, and 4, respectively. It can
Figure 6a–c
be observed thatshows
a thinthe bright
layer field X-TEM
distributed withimages of SiC Samples
gas bubbles 1, 2, and(defined
and nanocracks 4, respectively. It can
as irradiated
be observed that a thin layer distributed with gas bubbles and
layer) with approximately 70 nm thickness were formed in SiC sample. The nanocracks mainlynanocracks (defined as irradiated layer)
with approximately
distribute 70 nm thickness
in the approximately 1.4 μmwere formed
depth. in SiC sample.
However, The nanocracks
with increasing mainly distribute
H2+ ion fluence, the widthin of
the approximately 1.4 µm depth. However, with increasing H + ion fluence, the width of irradiated
irradiated layer is increased. In Sample 2, the width of irradiated 2 layer is up to about 170 nm, which
layer
is about is increased.
two and In Sample
a half fold2,ofthe width
that of irradiated
in Sample layer is up
1. In addition, theto middle
about 170 nm, of
region whichbubbleis about
layer
two and a half fold of that in Sample 1. In addition, the middle
maintains amorphous state after annealing for 30 min. The distribution width of the nanocracks in region of bubble layer maintains
amorphous state +
the He+ and H2+after annealing
irradiated for 30ismin.
sample The distribution
approximately 20 nm, width
which of the nanocracks
is larger than inthattheinHe theandH2+
H + irradiated sample is approximately 20 nm, which is larger than that in the H + irradiated samples.
2
irradiated samples. A large amount of helium bubbles are formed far away the nanocracks region at 2
Aa large
depthamountof ~1.2 ofμmhelium
as shown bubbles are formed
in Figure 6c. far away the nanocracks region at a depth of ~1.2 µm as
shown in Figure 6c.
The distribution depth of these nanocracks is exactly equal to the thickness of the blisters, which
The distribution
indicates that the blisters depth of these
originate nanocracks
from is exactlyThe
these nanocracks. equal to the
blister thickness
evolution of the
should blisters,
include the
which indicates that the blisters originate from these nanocracks.
growth of the maximum radius of the blister (a) and the maximum amplitude deformation value The blister evolution should include at
the growth of the maximum radius of the blister (a) and the maximum
the center of the blister (w0). The increment of a value can be achieved through the interconnection amplitude deformation value at
the
andcenter
coalesceof the ofblister
these (w 0 ). The increment
nanocracks. of a value
The density andcanthebeslender
achieved through
shape of Hthenanocracks
interconnectionaffectandthe
coalesce of these nanocracks. The density and the slender shape of
coalescence of these H nanocracks. In the H2+ irradiated samples, the concentrated distribution H nanocracks affect the coalescence
of these H nanocracks. In the H +
characteristics of the formed 2 irradiated
nanocracks samples,
make the concentrated
the blister grow easily, distribution
as shown incharacteristics
Figure 6a. When of
the formed nanocracks make the blister grow easily, as shown in
the samples were irradiated with higher H2+ fluences, the density of nanocracks is larger. These Figure 6a. When the samples were
irradiated with higher + fluences, the density of nanocracks is larger. These blisters are more likely
blisters are more likelyHto2 be connected and the inner pressures between the blisters were balanced
to be connected
before the blisterand grewthebigger.
inner pressures
Thus, the between
average size the blisters were balanced
of the blisters of Samplebefore the blister
2 (including a andgreww0)
bigger. Thus, the average size of the blisters of Sample 2 (including
is relatively smaller than that of Sample 1. Additionally, the existence of 0amorphous region and a and w ) is relatively smaller than
the
that of Sample
inadequate 1. Additionally,
annealing the existence
of the damaged layerofmayamorphous
also affect region and the inadequate
the evolution of the blisters annealing
[16]. The of He
the+
damaged layer may also affect the evolution of the blisters [16]. The He + and H + irradiated Sample 4
and H2 irradiated Sample 4 has larger number density of the blisters. Meanwhile, the blisters have
+ 2
has larger number
extremely high inner density of theasblisters.
pressure listed inMeanwhile,
Table 4. The thewider
blistersvertical
have extremely
distribution highofinner pressure
H nanocracks
as listedthe
makes in lateral
Table 4.propagation
The wider vertical
and coalescedistribution of H nanocracks
of H nanocracks difficult.makes
Thesethe lateralthat
explain propagation
the lateral
and
radius a (9.6 μm) of Sample 4 is smaller than that of Samples 1 and 2. Meanwhile, the HeSample
coalesce of H nanocracks difficult. These explain that the lateral radius a (9.6 µm) of 4 is
+ irradiation
reduces the elastic modulus of the irradiated layer, which gives a relatively big value of vertical
deformation w0. Therefore, larger ratio of w0/a of the blisters is achieved.Materials 2018, 11, 60 9 of 11
smaller than that of Samples 1 and 2. Meanwhile, the He+ irradiation reduces the elastic modulus of
Materials 2017, 10, x FOR PEER REVIEW 9 of 11
the irradiated layer, which gives a relatively big value of vertical deformation w0 . Therefore, larger
of w0 /a6d
ratio Figure of shows
the blisters is achieved.
the microstructure of bright field X-TEM image of Sample 3 (only He+ ion
+
irradiation). Large helium bubbles, which havefield
Figure 6d shows the microstructure of bright radiiX-TEM image
of several of Sample
tens 3 (only He
of nanometers, areion irradiation).
formed in the
Large helium bubbles, which have radii of several tens of nanometers, are formed
He concentration peak region at the depth of ~1.2 μm. The growth of helium bubbles driven by the in the He concentration
peak region
mobility of at the depth
vacancies of ~1.2 significant
become µm. The growth whenofthe helium bubbles
annealing driven by the
temperature mobility
is over 1000of°Cvacancies
[37,38].
become significant when the annealing temperature is over 1000 ◦ C [37,38]. The formation of circular
The formation of circular ripples in the sample surface, as shown in Figure 3g–i, is believed to initiate
ripples
from the in the sample surface,
coalescence of these as bubbles.
shown in Our Figure 3g–i, is believed
previous researchtoalsoinitiate from the
revealed coalescence
a rapid growthofofthesethe
bubbles.
helium bubbles during the first 30 min as the annealing temperature was above 1200 °C first
Our previous research also revealed a rapid growth of the helium bubbles during the [21].30
It min
can
as ◦ C [21]. It can be speculated that the release of extremely
be the annealing
speculated temperature
that the releasewas above 1200high
of extremely internal pressure in the bubbles is achieved in this
high internal
annealing pressure
stage in the bubbles
by creating an exitisinachieved in this
the center area annealing stageThis
of bubbles. by creating
phenomenonan exit is
in similar
the center to
area of bubbles. This phenomenon is similar to volcanic eruption, which
volcanic eruption, which induces the formation of the circular ripple structure that is proved byinduces the formation of the
the
circular ripple structure
surface topography of 3DthatOPisanalysis.
proved by Tothe
thesurface
best oftopography
our knowledge,of 3DtheOPcircular
analysis. To the best
structure of our
of surface
knowledge, the circular structure +
ripples is first observed in theofHesurface ripples is
+ irradiated andfirstthen
observed in theSiC
annealed He material.
irradiatedHowever,
and then annealed
further
SiC material. However, further research on the detailed mechanisms
research on the detailed mechanisms and building models to explain this formation on and building models to explain this
the surface
formation
topography onisthe surface topography is needed.
needed.
Figure 6. Bright field X-TEM images of: (a) Sample 1; (b) Sample 2; (c) Sample 4; and (d) Sample 3.
Figure 6. Bright field X-TEM images of: (a) Sample 1; (b) Sample 2; (c) Sample 4; and (d) Sample 3.
4. Conclusions
4. Conclusions
The microstructure of the single crystal 6H-SiC samples with [0001] crystal direction irradiated
The microstructure of the single crystal 6H-SiC samples with [0001] crystal direction irradiated by
by one or both of H2+ and He+ ions and then annealed were investigated by 3D optical profiler,
one or both of H2 + and He+ ions and then annealed were investigated by 3D optical profiler, scanning
scanning electron microscopy and transmission electron microscopy. Blisters evolved from the
electron microscopy and transmission electron microscopy. Blisters evolved from the coalescence of
coalescence of H nanocracks were formed +
in the+H2+ and
+
He++H2+ irradiated sample surface, while the
H nanocracks were formed in the H2 and He +H2 irradiated sample surface, while the circular
circular ripples originated from the pressure release of helium bubbles after high temperature
annealing were formed in the He+ irradiated sample surface. The lateral radius a of the blisters in the
irradiated sample with low H2+ fluence was larger than that in the irradiated sample with high H2+
fluence and with He+-H2+ ions. Fracture and exfoliation of the blisters in the He++H2+ irradiated sample
were attributed to the stress concentration that exceeded the theoretical yield strength. ComparedMaterials 2018, 11, 60 10 of 11
ripples originated from the pressure release of helium bubbles after high temperature annealing were
formed in the He+ irradiated sample surface. The lateral radius a of the blisters in the irradiated
sample with low H2 + fluence was larger than that in the irradiated sample with high H2 + fluence and
with He+ -H2 + ions. Fracture and exfoliation of the blisters in the He+ +H2 + irradiated sample were
attributed to the stress concentration that exceeded the theoretical yield strength. Compared with other
irradiated samples, the ratio of w0 /a and the density of the blisters in the He+ -H2 + irradiated samples
were largest, which should be attributed to: (i) the widened distribution of H nanocracks in vertical
direction; and (ii) the He+ implantation induced the reduction of elastic modulus of the irradiated
layer. In addition, about 8–58% of implanted H atoms contributed to the formation of the blisters.
Acknowledgments: The work was supported by NPL, CAEP, through Project 2015AB001 and National major
scientific research equipment development of China, through Grant No. 11227804.
Author Contributions: Guang Ran conceived and designed the experiments; Qiang Shen and Chao Ye performed
the experiments and analyzed the data; and Qiang Shen wrote the manuscript under the supervision of Guang Ran.
All authors contributed to the scientific discussion of the results and reviewed the manuscript.
Conflicts of Interest: The authors declare no conflicts of interest.
References
1. Celler, G.K.; Cristoloveanu, S. Frontiers of silicon-on-insulator. J. Appl. Phys. 2003, 93, 4955–4978. [CrossRef]
2. Ishimaru, M.; Dickerson, R.M.; Sickafus, K.E. Scanning Transmission Electron Microscopy-Energy Dispersive
X-ray/Electron Energy Loss Spectroscopy Studies on SiC-on-Insulator Structures. J. Electrochem. Soc. 2000,
147, 1979–1981. [CrossRef]
3. Bruel, M. Application of hydrogen ion beams to silicon on insulator material technology. Nucl. Instrum.
Methods Phys. Res. B 1996, 108, 313–319. [CrossRef]
4. Tong, Q.-Y.; Lee, T.-H.; Werner, P.; Gosele, U. Fabrication of Single Crystalline SiC Layer on High Temperature
Glass. J. Electrochem. Soc. 1997, 144, L111. [CrossRef]
5. Liang, J.H.; Hsieh, H.Y.; Wu, C.W.; Lin, C.M. Dependence of implantation sequence on surface blistering
characteristics due to H and He ions co-implanted in silicon. Nucl. Instrum. Methods Phys. Res. B 2015, 365,
128–132. [CrossRef]
6. Agarwal, A.; Haynes, T.E.; Venezia, V.C.; Holland, O.W.; Eaglesham, D.J. Efficient production of
silicon-on-insulator films by co-implantation of He+ with H+ . Appl. Phys. Lett. 1998, 72, 1086–1088. [CrossRef]
7. Igarashi, S.; Muto, S.; Tanabe, T.; Aihara, J.; Hojou, K. In-situ observation of surface blistering in silicon by
deuterium and helium ion irradiation. Surf. Coat. Technol. 2002, 158–159, 421–425. [CrossRef]
8. Cherkashin, N.; Daghbouj, N.; Darras, F.X.; Fnaiech, M.; Claverie, A. Cracks and blisters formed close to
a silicon wafer surface by He-H co-implantation at low energy. J. Appl. Phys. 2015, 118, 245301. [CrossRef]
9. Alimov, V.K.; Roth, J.; Mayer, M. Depth distribution of deuterium in single- and polycrystalline tungsten up
to depths of several micrometers. J. Nucl. Mater. 2005, 337–339, 619–623. [CrossRef]
10. Ueda, Y.; Funabiki, T.; Shimada, T.; Fukumoto, K.; Kurishita, H.; Nishikawa, M. Hydrogen blister formation
and cracking behavior for various tungsten materials. J. Nucl. Mater. 2005, 337–339, 1010–1014. [CrossRef]
11. Giguère, A.; Terreault, B. Systematics of the giant isotope effect in hydrogen ion blistering of materials.
Surf. Coat. Technol. 2007, 201, 8205–8209. [CrossRef]
12. Muto, S.; Matsui, T.; Tanabe, T. Observation of surface blistering by grazing incidence electron microscopy.
Jpn. J. Appl. Phys. 2000, 39, 3555–3556. [CrossRef]
13. Igarashi, S.; Muto, S.; Tanabe, T. Surface blistering of ion irradiated SiC studied by grazing incidence electron
microscopy. J. Nucl. Mater. 2002, 307–311, 1126–1129. [CrossRef]
14. Amarasinghe, V.P.; Wielunski, L.; Barcz, A.; Feldman, L.C.; Celler, G.K. Properties of H+ Implanted 4H-SiC
as Related to Exfoliation of Thin Crystalline Films. ECS J. Solid State Sci. Technol. 2014, 3, 37–42. [CrossRef]
15. Li, B.S.; Wang, Z.G.; Jin, J.F. Implantation temperature and thermal annealing behavior in H2 + -implanted
6H-SiC. Nucl. Instrum. Methods Phys. Res. B 2013, 316, 239–244. [CrossRef]
16. Zhang, L.; Li, B.S. Study of surface exfoliation on 6H-SiC induced by H2 + implantation. Phys. B Condens. Matter
2017, 508, 104–111. [CrossRef]Materials 2018, 11, 60 11 of 11
17. Terreault, B. Hydrogen blistering of silicon: Progress in fundamental understanding. Phys. Status Solidi.
Appl. Mater. Sci. 2007, 204, 2129–2184. [CrossRef]
18. Scherzer, B. Sputtering by Particle Bombardment II. Top. Appl. Phys. 1983, 52, 271–355.
19. Feng, X.; Huang, Y. Mechanics of Smart-Cut technology. Int. J. Solids Struct. 2004, 41, 4299–4320. [CrossRef]
20. Muto, S.; Tanabe, T.; Maruyama, T. Cross Sectional TEM Observation of Gas-Ion-Irradiation Induced Surface
Blisters and Their Precursors in SiC. Mater. Trans. 2003, 44, 2599–2604. [CrossRef]
21. Shen, Q.; Zhou, W.; Ran, G.; Li, R.; Feng, Q.; Li, N. Evolution of Helium Bubbles and Discs in Irradiated
6H-SiC during Post-Implantation Annealing. Materials 2017, 10, 101. [CrossRef] [PubMed]
22. Timoshenko, S.; Woinowsky-krieger, S. Theory of Plates and Shells; McGraw-Hill: New York, NY, USA, 1959.
23. Muto, S.; Enomoto, N. Substructures of gas-ion-irradiation-induced surface blisters in silicon studied by
cross-sectional transmission electron microscopy. Mater. Trans. 2005, 46, 2117–2124. [CrossRef]
24. Enomoto, N.; Muto, S.; Tanabe, T.; Davis, J.W.; Haasz, A.A. Grazing-incidence electron microscopy of surface
blisters in single- and polycrystalline tungsten formed by H+ , D+ and He+ irradiation. J. Nucl. Mater. 2009,
385, 606–614. [CrossRef]
25. Knapp, J.A.; Follstaedt, D.M.; Myers, S.M.; Barbour, J.C.; Friedmann, T.A.; Knapp, J.A.; Follstaedt, D.M.;
Myers, S.M.; Barbour, J.C.; Friedmann, T.A. Finite-element modeling of nanoindentation. J. Appl. Phys. 1999,
85, 1463–1474. [CrossRef]
26. Snead, L.L.; Nozawa, T.; Katoh, Y.; Byun, T.-S.; Kondo, S.; Petti, D.A. Handbook of SiC Properties for Fuel
Performance Modeling. J. Nucl. Mater. 2007, 371, 329–377. [CrossRef]
27. Snead, L.L.; Katoh, Y. Radiation Effects in SiC and SiC–SiC. Compr. Nucl. Mater. 2012, 215–240.
28. Kreith, F.; Goswami, D.Y. The CRC Handbook of Mechanical Engineering, 2nd ed.; CRC Press: Boca Raton, FL,
USA, 2004.
29. Petersen, K.E. Silicon as a Mechanical Material. Proc. IEEE 1982, 70, 420–457. [CrossRef]
30. Hong, J.W.; Cheong, S. A crack model for the onset of blisters using finite surface thicknesses. J. Appl. Phys.
2006, 100, 1–5. [CrossRef]
31. Barbot, J.F.; Leclerc, S.; David, M.-L.; Oliviero, E.; Montsouka, R.; Pailloux, F.; Eyidi, D.; Denanot, M.-F.;
Beaufort, M.-F.; Declémy, A.; et al. Helium implantation into 4H-SiC. Phys. Status Solidi 2009, 206, 1916–1923.
[CrossRef]
32. Snead, L.L.; Zinkle, S.J.; Hay, J.C.; Osborne, M.C. Amorphization of SiC under ion and neutron irradiation.
Nucl. Instrum. Methods Phys. Res. B 1998, 141, 123–132. [CrossRef]
33. Huang, L.-J.; Tong, Q.-Y.; Chao, Y.-L.; Lee, T.-H.; Martini, T.; Gösele, U. Onset of blistering in hydrogen-implanted
silicon. Appl. Phys. Lett. 1999, 74, 982. [CrossRef]
34. Muto, S.; Matsui, T.; Tanabe, T. Non-destructive structural analysis of surface blistering by TEM and EELS in
a reflection configuration. J. Nucl. Mater. 2001, 290–293, 131–134. [CrossRef]
35. Hino, T.; Yamauchi, Y.; Hirohata, Y. Helium retention of plasma facing materials. J. Nucl. Mater. 1999, 266–269,
538–541. [CrossRef]
36. Fu, Z.; Yoshida, N.; Iwakiri, H.; Xu, Z. Thermal desorption and surface modification of He+ implanted into
tungsten. J. Nucl. Mater. 2004, 333, 692–696. [CrossRef]
37. Miyazaki, H.; Suzuki, T.; Yano, T.; Iseki, T. Effects of thermal annealing on the macroscopic dimension
and lattice parameter of heavily neutron-irradiated silicon carbide. J. Nucl. Sci. Technol. 1992, 29, 656–663.
[CrossRef]
38. Itoh, H.; Hayakawa, N.; Nashiyama, I.; Sakuma, E. Electron spin resonance in electron-irradiated 3C-SiC.
J. Appl. Phys. 1989, 66, 4529. [CrossRef]
© 2018 by the authors. Licensee MDPI, Basel, Switzerland. This article is an open access
article distributed under the terms and conditions of the Creative Commons Attribution
(CC BY) license (http://creativecommons.org/licenses/by/4.0/).You can also read