Investment futu r e - Greenpeace
←
→
Page content transcription
If your browser does not render page correctly, please read the page content below

futu[r]e
                   investment
                   A SUSTAINABLE INVESTMENT PLAN FOR THE POWER SECTOR TO SAVE THE CLIMATE
                           © GP/MIZUKOSHI

                                            © DREAMSTIME
© GP/SIMANJUNTAK

                                                           EUROPEAN RENEWABLE
                                                           ENERGY COUNCIL

report global financial energy investment
introduction                                                       4
                                                                                executive summary                                                  6

                                                                                1   installed capacity by technology                             11
                                                                                2   development of power plants: investment costs                13
                                                                                3   fuel costs                                                   18
                                                                                4   renewable energy investments - status quo                    20
                                                                                5   investment in new power plants                               27
                                                                                6   (more) costs for fossil fuels                                33
                                                                                7   policy recommendations                                       35
                                                                                8   case studies                                                 41

                                                                                appendix                                                         46

                                                                                                                     e]r[ut uf
                                                                          tnemtsevni

      Greenpeace International, European Renewable Energy Council (EREC)
      date June 2007
      “Futu[r]e Investment” is based on the Global Energy Scenario report “Energy [R]evolution”, published in January 2007.
      “Futu[r]e Investment” takes a step further by looking at the changes needed in investment by the power sector into renewable energy
      to fully realise the outcomes of the “Energy [R]evolution”. For further information about the “Energy [R]evolution”
      please see the full report at www.energyblueprint.info.
      institute DLR, Institute of Technical Thermodynamics, Department of Systems Analysis and Technology Assessment, Stuttgart,
      Germany: Dr.Wolfram Krewitt, Sonja Simon, Stefan Kronshage. P.O. Box 8408, NL-3503 RK Utrecht, Kanaalweg
      16-G, NL-3526 KL Utrecht, The Netherlands: Wina Graus, Mirjam Harmelink
      European Renewable Energy Council (EREC) Arthouros Zervos, Oliver Schäfer
      Greenpeace International Sven Teske (Global Project Manager)
      authors Athena Ronquillo Ballesteros, John Coequyt, Marcelo Furtado, Jasper Inventor, Dr. Wolfram Krewitt, Daniel Mittler, Oliver Schäfer,
      Sonja Simon, Sven Teske, Arthouros Zervos.
      editor Tony Hare
      design & layout Tania Dunster, Jens Christiansen, onehemisphere, Sweden www.onehemisphere.se
      printing PrimaveraQuint, The Netherlands
      contact sven.teske@int.greenpeace.org
              schaefer@erec.org
                                                                                                                                                         © DREAMSTIME

      for further information about the global, regional and national scenarios please visit the energy [r]evolution website: www.energyblueprint.info
      GPI REF 068. Published by Greenpeace International and EREC. Printed on 100% post consumer recycled chlorine-free paper.

cover image SOLAR AND WIND ENERGY GENERATION.
image WIND TURBINE.

2
foreword

2007 has seen unpre-           Renewable energies, from wind and solar to biomass     The attraction of renewables goes beyond their
cedented momentum on           and geothermal will have an important role to play     simplicity and their greenhouse gas emission
the issue of climate change,   in switching the globe’s economies onto a more         reduction potential. In many rural areas of
from an unequivocal            climate-friendly trajectory if intelligent market      developing countries they offer a rapid chance for
conclusion by scientists       instruments continue to be deployed and expanded.      poorer communities to gain access to electricity
that it is underway to the     Meanwhile increased investment in research and         without waiting for a grid.
sobering impacts and the       development could see other kinds of renewables
                                                                                      A United Nations Environment Programme report
cautiously optimistic          such as ocean thermal energy conversion, tidal and
                                                                                      on the world’s deserts noted that there is enough
economics of what it might     wave power becoming commercial and widespread
                                                                                      solar power in an 800 by 800 km area of a desert,
cost to curb climbing          over the decades to come.
                                                                                      such as the Sahara to generate all the world’s
temperatures. A big part of
                               The scale and pace of investments in commercial        electricity needs and more. Part of this could be
the economics—of the
                               forms of renewables has been rising in recent years    used to generate electricity directly or to produce
transition to a low carbon
                               at an exceptional speed. Wind, solar and biomass are   hydrogen—a promising alterative fuel. Over the
global GDP—will be
                               now in some areas, independent of oil prices.          coming few months we will gain an insight into
technology including
                               Around 18 per cent of global investment, or about      whether the political world is ready to back the deep
energy generation systems
                               $100 billion in power generation in 2006, was in       emission reductions urgently needed post 2012
allied to the enormous
                               renewables by some estimates. Much of this is in       which will stimulate renewable energy investments
energy efficiency gains
                               OECD countries, but there is also emerging interest    even further.
possible in homes,
                               in developing countries, in particular in China and
workplaces, power plants                                                              The European Union has set a 20 per cent emission
                               India, where new renewable corporations are
and in the transportation                                                             reduction for 2020 and positive signals are
                               emerging as global players.
sector.                                                                               emerging from other quarters including Japan and
                               The growth is also spawning a new generation in        the United States. Some countries, from Costa Rica
                               high-tech industries and jobs with some experts        and New Zealand to Norway have pledged to go
                               estimating that by 2020 more people in Germany,        carbon neutral by mid century. The speed at which
                               for example, will be employed in environmental         the transition to a low, perhaps even de-carbonised
                               industries like renewables than in the automotive      economy will occur, will depend on serious and
                               industry.                                              sustained political will if we are to achieve the
                                                                                      ultimate goal of an up to 80 per cent cut in
                               There are many factors driving this surging interest
                                                                                      greenhouse gases. It will also depend on creative
                               including energy security concerns. But above all it
                                                                                      thinking and a dispassionate assessment of all the
                               is the issue of climate change and the need to
                                                                                      options available.
                               address greenhouse gas emissions which is at the
                               heart of the renewable investment rush. The United     This new report is just the kind of publication that
                               Nations, via the Kyoto Protocol emission reductions    will strike a thoughtful chord with the expert and
                               treaty and its flexible mechanisms, can take some      the novice in the field of renewable energy. I am sure
                               credit for establishing innovative markets that are    it will spark even greater interest and action
                               accelerating deployment of renewables in developed     towards a more sustainable, climate friendly, energy
                               and developing countries. Indeed the Clean             mix and allow renewables to achieve their full and
                               Development Mechanism is set to deliver financial      very exciting potential.
                               flows in part to renewable energy schemes of some
                               $100 billion, perhaps more over the coming years.
                                                                                      Achim Steiner
                                                                                      UNEP
                                                                                      JUNE 2007

                                                                                                                                           3
FUTU[R]E INVESTMENT
A SUSTAINABLE INVESTMENT PLAN TO SAVE THE CLIMATE

introduction
THIS REPORT SHOWS THAT INVESTMENT IN RENEWABLES PAYS OFF QUITE QUICKLY DUE TO MASSIVE SAVINGS IN FUEL COSTS. IN
FACT, A ‘BUSINESS AS USUAL’ MIX IN THE WORLD GLOBAL POWER GENERATION SECTOR WOULD RESULT IN 10 TIMES HIGHER FUEL
COSTS, WHEN COMPARED TO THE ADDITIONAL INVESTMENT NEEDED TO IMPLEMENT THE ENERGY [R]EVOLUTION PATHWAY.

                                                                                                                                                             © DREAMSTIME
image HARNESSING NATURE’S SUSTAINABLE ELEMENTS.

Since “Energy [R]evolution” was first published at the end of January 2007,     Energy policy options and future pathways are naturally influenced to a huge
Greenpeace and EREC have received an overwhelming wave of support.The           extent by political decision makers. Decisions need to be made now. Plans
Energy [R]evolution Scenario is a real alternative to the IEA´s world energy    made by power utilities over the next few years will define the energy supply
outlook – and the only practical blueprint for how to cut global energy         of the next generation.We strongly believe that this should be the “solar
related CO2 emission by 50% by 2050 to avoid dangerous climate change,          generation”.The current energy supply structure can clearly not be
while maintaining global economic growth.                                       maintained in a sustainable way.The economic, social and environmental
                                                                                costs would be unacceptable to humanity.
The Energy [R]evolution report shows that renewable energy is not a dream
for the future – it is real, mature and can be deployed on a large scale.       Over the coming two decades we will witness the largest turnover in
Decades of technological progress have seen renewable energy technologies       electricity generating technology the world has ever seen. Existing plants will
such as wind turbines, solar photovoltaic panels, biomass power plants,         need to be retired, in addition new plants will have to be built to satisfy the
geothermal power and solar thermal collectors move steadily into the            increasing global demand for power - not least from India and China.We
mainstream.The global market for renewable energy is growing dramatically;      must use this opportunity to change our energy supply structure to include a
in 2005 its turnover was US$38 billion, 26% more than the previous year.        much larger share of indigenous, renewable resources, so we can develop our
                                                                                economies on the basis of known and predictable costs of electricity.
The time window for making the shift from fossil fuels to renewable energy is
very short.Within the next decade many of the existing power plants in the      During the last few months, as we have presented the Energy [R]evolution
OECD countries will come to the end of their technical lifetime and will need   Scenario at press conferences, energy conferences and one-to-one interviews
to be replaced. But a decision taken to construct a coal power plant today      with politicians, financial experts and utilities, it has become clear that
will result in the production of CO2 emissions until 2050.                      detailed investment figures for our scenario are of great interest.Therefore,
                                                                                this report takes a close look at the investment pathways of the power sector.
                                                                                We concentrate on the power sector, because comparative figures were more
4                                                                               easily available.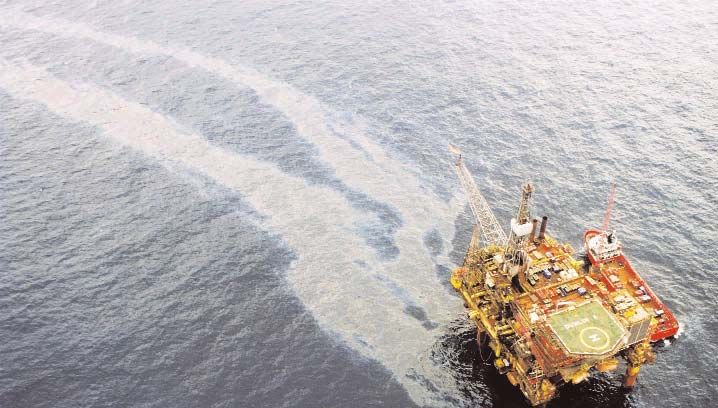
image UTTARADIT, THAILAND, 26 MAY
                                                                                   2006. DESTRUCTION ENGULFS THE
                                                                                   DISTRICT OF LABLAE IN UTTARADIT
                                                                                   PROVINCE AFTER A MUDSLIDE SWEPT
                                                                                   THROUGH THE DISTRICT AND
                                                                                   DESTROYED EVERYTHING ON ITS PATH.
                                                                                   MORE THAN A HUNDRED ARE FEARED
                                                                                   DEAD AND MISSING AS THE PROVINCE
                                                                                   OF UTTARADIT AND OTHER NORTHERN
                                                                                   THAI PROVINCES WERE SUBMERGED IN

                                                                                                                                                                  © VINAI DITHAJOHN
                                                                                   THE AREA'S WORST FLOODS IN RECENT
                                                                                   HISTORY. SCIENTISTS WARN THAT
                                                                                   EXTREME WEATHER EVENTS DUE TO
                                                                                   CLIMATE CHANGE WILL HIT HARD AND
                                                                                   MORE OFTEN IN THE COUNTRY, ALONG
                                                                                   WITH OTHER PARTS OF ASIA.

First positive developments                                                        The battle for energy in this century will not be won by following the strategy
                                                                                   that proved to be the winning one in the 20th century, i.e. of either producing
Wind provides an example of what is possible if technological development
                                                                                   fuel or of controlling fuel supplies. It will be won by those regions of the world
accompanies favourable political development.Wind energy had a record year
                                                                                   that have the foresight to act now to protect their economies and the global
in 2006. Global demand for wind power capacity grew by 32%, following an
                                                                                   climate. It will be won by the regions that excel in developing, deploying and
increase in the market of more than 40% in 2005.The value of wind
                                                                                   exporting renewable energy technologies to a world that cannot afford to do
turbines sold last year was €18 billion. In Europe, for the seventh consecutive
                                                                                   without them. A well-known consultancy has just produced a report saying
year, wind power was second only to gas in terms of new capacity. New wind
                                                                                   that by 2020 in Germany, environmental technologies will be the major
power installations in 2006 amounted to 7588 MW, seriously challenging gas
                                                                                   industry, ahead of the automobile and steel industries for which Germany is
(approximately 8500 MW in 2006) as the preferred European choice in
                                                                                   famous.
electricity generating capacity. A similar pattern is emerging in the US, where
wind was second only to gas in terms of new installations in 2005, according
to the US Energy Information Administration.The same is expected for               Long term energy policy will attract investors
2006. A similar success story could be told for other technologies such as
                                                                                   In order to build up a large scale renewable industry – big enough to satisfy
solar PV which has shown average growth rates above 30% during the last
                                                                                   the growing demand for power supply globally – long term energy policies are
few years. Between 2001 and 2005, 35% of all new capacity installed in the
                                                                                   needed. Short term thinking – aimed at ‘the next election’ - will have dire
EU was based on renewables.
                                                                                   consequences for future generations.Those countries with long term policies
For the majority of countries experiencing high and increasing energy              for renewable power generation such as Germany, Spain and Denmark have
imports, the coming years will be a balancing act between reducing import          been able to build up strong renewable industries.The weaker the policy, the
dependence and exposure to fluctuating and unpredictable fuel import prices        smaller the renewable industry and the higher the prices for power generation
on the one hand, while simultaneously working to curb emissions of                 equipment.
greenhouse gases and other pollutants from electricity generation on the
                                                                                   We have shown two best practice examples for renewable power policy:The
other.We have a 10-year window to avoid irreversible damage to the world as
                                                                                   German Feed-in law and the Texas Renewable Portfolio Standard – just two
a result of man-made climate change. Deploying indigenous wind energy and
                                                                                   out of numerous good examples around the world.The money is available, so
building new gas plants, while securing gas supplies, is certainly not the worst
                                                                                   it’s just a matter of lowering the risk for RE investors and making RE invest-
response importing countries can make when trying to navigate through the
                                                                                   ments commercially viable through a defined and stable return that can only
increasingly challenging climate and energy situation.
                                                                                   be provided by appropriate government policies.The bottleneck therefore is
As mentioned, the global market for wind turbines was worth some                   not because there is no money for renewables but because there is either a
€18 billion in 2006.The amount comes very close to the increase in the EU’s        total absence of policy to encourage major investment in renewable energy, or
gas bill every time the price of oil increases by US$20.The European               weak policies that result in smaller scale investments, hence the impression
Commission has calculated that for every US$20 increase in the price of oil,       that renewables can only work on a much smaller scale.
the price of Europe’s gas imports rises by €15 billion annually, given the
                                                                                   This report shows that investment in renewables pays off quite quickly due to
unfortunate link between gas and oil prices. For comparison, the cost of wind
                                                                                   massive savings in fuel costs. In fact, a ‘business as usual’ mix in the world
turbines installed in Europe in 2007 was approximately €9 billion. A tripling
                                                                                   global power generation sector would result in 10 times higher fuel costs,
of oil prices from US$20 to US$60, as we have experienced in the past few
                                                                                   when compared to the additional investment needed to implement the Energy
years, thus adds €30 billion annually to Europe’s gas import bill, and
                                                                                   [R]evolution pathway.
constitutes a transfer of wealth from Europe to gas-exporting countries.
Europe is not an isolated case.Very few countries are net exporters of fuel,       Today’s politicians can change the energy supply for the next generation –
and even fewer will be in the future. Due to the concentration of the              a good argument for the next election! As more and more people will say:
remaining reserves, most countries will be transferring an ever-increasing         “I love renewable energy – and I vote!!”
share of their wealth abroad if imports continue to grow and prices continue
to rise. And there is only one long-term direction for oil and gas prices: up!
The dependence on few fossil fuel sources is of particular concern in many
developing countries. Some developing countries spend nearly all their
development aid on coping with increasing - and volatile - oil prices. Europe,
as well as North America, Japan, India, China and many other importing             Oliver Schäfer                             Sven Teske
countries will have to accept a transfer of wealth to fuel exporters in the        EUROPEAN RENEWABLE                         CLIMATE & ENERGY UNIT
medium term. But the impact on their economies and the global environment          ENERGY COUNCIL (EREC)                      GREENPEACE INTERNATIONAL
can be limited, in the short, medium and long term, through much-needed            JANUARY 2007
energy efficiency measures and the deployment of renewables.                                                                                                               5
FUTU[R]E INVESTMENT
A SUSTAINABLE INVESTMENT PLAN TO SAVE THE CLIMATE

executive summary
THE AVERAGE ANNUAL FUEL COST SAVINGS OF THE ENERGY [R]EVOLUTION SCENARIO ARE 10 TIMES HIGHER THAN THE ADDITIONAL
INVESTMENT COST OF THIS SCENARIO.

                                                                                                                                                         © GP/VINAI DITHAJOHN
image 30TH OCTOBER 2006 - NONTHABURI, THAILAND - VILLAGERS PADDLE A BOAT AT A VILLAGE IN KOH KRED ISLAND WHICH WAS ENGULFED BY RECENT FLOODING. KOH KRED IS
A TINY ISLAND IN THE CHAO PHRAYA RIVER, LOCATED IN NONTHABURI PROVINCE OUTSKIRT OF BANGKOK. EARLIER IN THE YEAR, SCIENTISTS WARNED THAT THAILAND WOULD
EXPERIENCE MORE FREQUENT EXTREME WEATHER EVENTS DUE TO THE IMPACTS OF CLIMATE CHANGE.

climate threats and solutions                                                  One reason for the price increases is that supplies of all fossil fuels -
                                                                               especially oil and gas - are becoming scarcer and more expensive to
Global climate change, caused by the relentless build-up of greenhouse
                                                                               produce. The days of “cheap oil and gas” are coming to an end. This
gases in the Earth’s atmosphere, is already disrupting ecosystems and
                                                                               opens the door for the use of unconventional sources like oil shale or tar
causing about 150,000 additional deaths per year. An average global
                                                                               sands with huge environmental impacts. Coal also faces rising prices.
warming of 2°C threatens millions of people with an increased risk of
                                                                               China, a former coal exporting country will soon import increasing
hunger, malaria, flooding and water shortages.
                                                                               amounts of coal to satisfy its booming economy. In addition, the outlook
If rising temperatures are to be kept within tolerable limits then we need     for capturing and storing CO2 after 2020 (irrespective of whether this is
to significantly reduce our greenhouse gas emissions. This makes both          realistic or just wishful thinking) is encouraging industrialised countries
environmental and economic sense. The main greenhouse gas is carbon            to built new coal power plants in the coming years.
dioxide (CO2) produced by using fossil fuels for energy and transport.
                                                                               Uranium, the fuel for nuclear power, is also a finite resource.
Recent large increases in the price of oil and gas; the ‘weaponisation’ of
                                                                               By contrast, the reserves of renewable energy that are technically
energy supplies for political purposes (i.e., Russia/Ukraine, Russia/EU,
                                                                               accessible globally are large enough to provide about six times more
Venezuela/US, Argentina/Chile, etc.); and the dependence of many
                                                                               energy than the world currently consumes - forever.1
economies on sources of supply in some of the most unstable regions of
the world, have brought the issue of security of supply to the top of the      Renewable energy technologies vary widely in their technical and
energy policy agenda.                                                          economic maturity, but there are a range of sources which offer
                                                                               increasingly attractive options. These sources include wind, biomass,
                                                                               photovoltaic, solar thermal, geothermal, ocean and hydroelectric power.
references
1 ISES / DR. STRADMANN / DR. NITSCH                                            Their common feature is that they produce little or no greenhouse

6
image GEOTHERMAL ACTIVITY.

                                                                                                                                                         © DREAMSTIME
gases, and rely on virtually inexhaustible natural sources for their          energy demand under the Energy [R]evolution Scenario shows that an
“fuel”. Some of these technologies are already competitive. Their             increase of average world GDP of 0.1% (over the time period 2003-
economics will further improve as they develop technically, as the price      2050) leads to an increase in final energy demand of about 0.2%.
of fossil fuels continues to rise and as their saving of carbon dioxide
                                                                              The Energy [R]evolution Scenario sets a target for the reduction of
emissions is given a monetary value globally.
                                                                              worldwide emissions by the power sector of 60% below current levels by
At the same time there is enormous potential for reducing our                 2050. A second objective is the global phasing out of nuclear energy.To
consumption of energy, while providing the same level of energy ‘services’.   achieve these targets, the scenario is characterised by significant efforts
                                                                              to fully exploit the large potential for energy efficiency. At the same time,
Nuclear power plants pose multiple threats to people and the
                                                                              all cost-effective renewable energy sources are accessed for electricity
environment from their operation. These include the risks and
                                                                              generation, and cogeneration from both fossil fuels and renewable energy
environmental damage from uranium mining, processing and transport;
                                                                              sources (such as geothermal and bio energy) is expanded.
the risk of nuclear weapons proliferation; the unsolved problem of
nuclear waste; and the potential hazard of a serious accident. Therefore      Today, renewable energy sources account for 18% of the world’s
nuclear is not considered in this analysis. The solution to our future        electricity demand. Large hydro power plants are currently the largest
energy needs lies instead in greater use of renewable energy sources for      renewable source, but wind energy is rapidly picking up. The share of
both heat and power.                                                          new renewable energy (e.g. solar energy, biomass, and geothermal) in
                                                                              electricity generation is currently well under 1%, but with double digit
Carbon dioxide capture and storage (CCS) is a technology still under
                                                                              growth rates in the past decade. The Energy [R]evolution Scenario
development. Although the number of pilot projects under development
                                                                              describes a development pathway which transforms the present
is increasing, no project including a coal power plant with CO2 storage
                                                                              situation into a sustainable energy supply:
has so far been realised. The earliest CCS will begin is 2020, it will
probably not become commercially viable until 2030. CCS is expensive          • Exploitation of the large energy efficiency potential will slow down
and increases the costs of power generation between 40% and 80%                 the rapidly growing electricity demand from the current 13,675
compared with conventional power plants, depending on the location of           TWh/a (billion kWh per year) to 26,000 TWh/a by 2050. Under the
the plant, the storage site, and the transport and capture technology           Reference Scenario there would be an increase to 39,000 TWh/a.
used. CCS also further reduces the efficiency of power plants and thus          Commitment to a successful efficiency strategy within the power
requires more resources. In addition, all CCS technologies require that         sector is a crucial prerequisite for achieving a significant share of
between 11% and 40% more fossil fuel resources are used to generate             renewable energy sources, compensating for the phasing out of
the same amount of electricity2, also incurring proportional additional         nuclear energy and reducing the consumption of fossil fuels.
environmental damage from air and water pollution associated with
                                                                              • The increased used of combined heat and power generation (CHP)
extraction of that extra fuel. CCS produces additional long-term costs.
                                                                                also improves the supply system’s energy conversion efficiency,
Monitoring and verification over the years is necessary to guarantee the
                                                                                increasingly using natural gas and biomass. In the long term,
retention of the stored carbon dioxide. Even then, opportunities to
                                                                                decreasing demand for heat and the large potential for producing
intervene in order to prevent or control unexpected leakage are likely
                                                                                heat directly from renewable energy sources limits the further
to be limited. Therefore CCS is not considered in this analysis.
                                                                                expansion of CHP.
                                                                              • The electricity sector will be the pioneer of renewable energy
the energy [r]evolution of the power sector
                                                                                utilisation. By 2050, around 70% of electricity will be produced
Two scenarios up to the year 2050 are outlined in this report. The              from renewable energy sources, including large hydro. An installed
Reference Scenario is based on the Reference Scenario published by              capacity of 7,100 GW will produce 21,400 Terawatt hours per year
the International Energy Agency in World Energy Outlook 2004,                   (TWh/a) of electricity in 2050.
extrapolated forward from 2030. Compared to the 2004 IEA
                                                                              • By 2050, 16% of electricity generation will be covered by combined
projections, the new World Energy Outlook 2006 assumes a slightly
                                                                                heat and power plants - roughly half of those plants will run on
higher average annual growth rate of world GDP of 3.4%, instead of
                                                                                biomass, and more than 40% will use gas as a fuel.
3.2%, for the 2004-2030 time horizon. At the same time, WEO 2006
expects final energy consumption in 2030 to be 4% higher than in              To achieve an economically attractive growth of renewable energy
WEO 2004. A sensitivity analysis on the impact of economic growth on          sources, a balanced and timely mobilisation of all renewable technologies
                                                                              is of great importance. This depends on technical potentials, actual costs,
                                                                              cost reduction potentials and technological maturity.
references
2 IPCC SR ON CCS TECHNICAL SUMMARY TABLE TS.3

                                                                                                                                                               7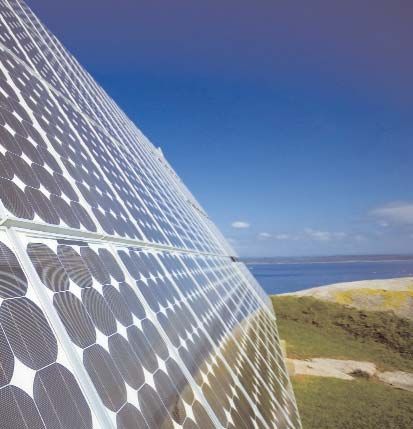
FUTU[R]E INVESTMENT
A SUSTAINABLE INVESTMENT PLAN TO SAVE THE CLIMATE

development of CO2 emissions by the power sector                                 investment in power plants
                                                                                 The global market for new power generation equipment is - after years
Worldwide CO2 emissions by the power sector will almost double under the
                                                                                 of stagnation - booming. While most existing power plants are ageing
Reference Scenario by 2050 - far removed from a sustainable development
                                                                                 and need to be replaced (= “repowering”), developing countries such as
path. But under the Energy [R]evolution Scenario, power sector emissions
                                                                                 China and India are building up new infrastructures for rapidly
will decrease from 10,200 million tonnes in 2003 to 4,200 m/t in 2050. In
                                                                                 increasing electricity demand.
spite of the phase-out of nuclear energy, and increasing electricity demand,
CO2 emissions in the electricity sector will decrease enormously due to the      There is huge opportunity in the next 5 to 15 years to invest in new
use of renewable energy and energy efficiency. With a share of 36% of            sustainable and climate-friendly power generation. Every decision taken
total CO2 emissions in 2050, the power sector will fall behind the transport     about new power plants today, will influence the energy mix of the next
sector as the largest source of emissions.                                       30 to 40 years.
                                                                                 Renewable energy sources - with the exception of bioenergy power
generation costs                                                                 plants - do not need any fuel, which makes operation costs independent
                                                                                 of fluctuating world market fossil fuel prices, and generation costs
Due to the growing demand for power, we are facing a significant
                                                                                 predictable over a period of 20 years and longer.
increase in society’s expenditure on electricity supply. Under the
Reference Scenario, the undiminished growth in demand, the increase in           In the Reference Scenario there will be almost 10,000 new fossil fuel
fossil fuel prices and the costs of CO2 emissions all result in electricity      power plants3 by 2030. Roughly half of those power plants will be run
supply costs rising from today’s US$1,130 billion per year to more               on gas, the other half on coal. Lignite power plants remain a niche
than US$4,300 billion per year in 2050.                                          market. New renewable energy capacity may be in the same range as
                                                                                 new coal. However 70% of the new installed power plants in the
The Energy [R]evolution Scenario not only complies with global CO2
                                                                                 Reference Scenario would be based on fossil fuel, 25% renewable and
reduction targets, but also helps to stabilise energy costs and thus relieves
                                                                                 5% nuclear. As new nuclear capacity would replace mainly old existing
the economic pressure on society. Increasing energy efficiency and shifting
                                                                                 power plants, nuclear will remain marginal on the global scale.
energy supply to renewable energy resources leads to long term costs for
electricity supply that are one third lower than in the Reference Scenario.
Following stringent environmental targets in the energy sector pays off in
economic terms.

figure 1: development of global electricity generation                           figure 2: development of global co2 emissions by sector
under the energy [r]evolution scenario                                           under the energy [r]evolution scenario
‘EFFICIENCY’ = REDUCTION COMPARED TO THE REFERENCE SCENARIO                      ‘EFFICIENCY’ = REDUCTION COMPARED TO THE REFERENCE SCENARIO

 50,000                                                                                     50,000
 45,000                                                                                     45,000
 40,000                                                                                     40,000
 35,000                                                                                     35,000
 30,000                                                                                     30,000
 25,000                                                                                     25,000
 20,000                                                                                     20,000
 15,000                                                                                     15,000
 10,000                                                                                     10,000
  5,000                                                                                      5,000
TWh/a 0                                                                          million tonnes/a 0
                2000    2010     2020    2030     2040    2050                                            2003    2010    2020     2030       2040   2050

     ‘EFFICIENCY’                            GEOTHERMAL             CHP FOSSIL                         ‘EFFICIENCY’              INDUSTRY

     OCEAN ENERGY                            WIND                   GAS & OIL                          TRANSPORT                 PUBLIC ELECTRICITY AND CHP

     CONCENTRATING SOLAR POWER               HYDRO                  COAL                               OTHER SECTORS

     PV                                      BIOMASS                NUCLEAR
8
                                                                                 references
                                                                                 3 ASSUMING THAT THE AVERAGE SIZE IS 500 MW PER POWER PLANT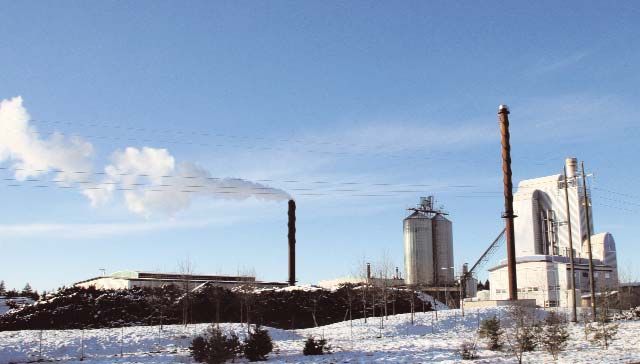
image SOLAR AND WIND-FACILITY
                                                                                NEAR ROSTOCK.

                                                                                                                                                          © BERNHARD NIMTSCH/GP
In the Energy [R]evolution Scenario, however, there will be just 4,000          US$/tCO2 in 2050, which is twice as high as the IEA’s projection, but still
new fossil fuel power plants by 2030. A large percentage of those               conservative compared with other studies.We assume that CO2 emission costs
power plants are currently under construction or have gone online               will be accounted for in Non-Annex B countries only after 2020.
between 2004 and January 2007. Gas power plants - especially
                                                                                Besides the conventional fossil based technologies, which still show a
cogeneration - play an important role. More than half of the new power
                                                                                significant potential for cost reduction and improvement of efficiencies,
plants run on gas, the remainder on coal. Lignite power plants will not
                                                                                there is a broad range of renewable energy technologies available today,
be built under the Energy [R]evolution Scenario. However, two thirds of
                                                                                which differ in terms of their technical maturity, costs, and development
new installed power capacity in the Energy [R]evolution Scenario
                                                                                potentials. Most of the renewable technologies employed today are at an
would be based on renewable energy sources, leaving one third to fossil
                                                                                early stage of market development. Accordingly, their costs are generally
fuels - around half of these power plants will be efficient combined heat
                                                                                higher than for competing conventional systems - particularly also
and power plants (CHP). Nuclear capacity would cease by 2030 when
                                                                                because it is still virtually free to destroy the environment by emitting
old existing power plants will be replaced by renewable power plants.
                                                                                greenhouse gases (GHG). If a polluter-pays principle were to be in
                                                                                operation, and CO2 already had a price according to the damages it
future energy prices and power plant investment costs                           causes, the competitiveness of renewables would be greatly strengthened.
The recent dramatic increase in global oil and gas prices has resulted          Stimulating market introduction would drive these technologies through
in much higher forward price projections. Under the 2004 ‘high oil and          their learning curves, thus exploiting the large potential for cost
gas price’ scenario by the European Commission (2004), for example,             reduction. Table 2 shows the expected development of specific investment
an oil price of just US$34/bbl in 2030 was assumed, and under a                 costs for key electricity generation technologies. The prerequisite for this
‘soaring oil and gas prices’ scenario the oil price reached US$50/bbl in        cost development is the further dynamic market uptake of renewable
2030. Only two years later, the IEA-WEO expects the oil price to be at          energy technologies to facilitate technical learning.
US$52/bbl in 2030 (IEA 2006a), and in the ‘high’ projections of the
US Department of Energy’s Annual Energy Outlook the oil price
                                                                                fuel costs versus investment costs
reaches US$90/bbl in 2030 ($54 in the reference case) (US DoE
2006). Considering the IEA’s continuous underestimation of oil prices           The total costs for fossil fuels in the Reference Scenario between 2004
in the past and the growing global oil and gas demand, which goes               and 2030 add up to a total of US$18,6 trillion - compared to
along with the expected passing of the global oil mid depletion point,          US$13,1 trillion in the Energy [R]evolution Scenario. This means fuel
we assume a price development path in which the price of oil reaches            costs in the Energy [R]evolution Scenario are already 30% lower in
US$85/bbl by 2030 and US$100/bbl in 2050 (Table 1). Gas prices are              the year 2030 (in 2050, the fuel costs are more than 70% lower). The
assumed to increase to US$9-10/GJ by 2050.                                      “gas bill” remains roughly at the same level - in the Energy
                                                                                [R]evolution Scenario it is 10% below the Reference Scenario. Equally
Compared to fossil fuels, biomass prices are highly variable, ranging
                                                                                importantly, the money spent on the alternative scenario for oil and
from no or low costs for residues or traditional biomass in Africa or
                                                                                coal to generate electricity is also 50% below the Reference Scenario.
Asia to comparatively high costs for biofuels from energy crops. Despite
this variability, this paper assumes an aggregated price for biomass in         The total fuel cost savings in the Energy [R]evolution Scenario are as
Europe. The increasing biomass prices reflect the link between biofuel          high as US$5.4 trillion or US$202 billion dollar per year.
and fossil fuel prices and a rising share of energy crops. For other
regions prices are assumed to be lower, considering the large amount of         table 1: total global fuel cost savings in the energy
traditional biomass use in developing countries and the high potential          [r]evolution scenario compared to the reference scenario
of as yet unused residues in North America and the Transition
Economies.                                                                                                             CUMULATIVE COST           AVERAGE
                                                                                                                        IN BILLION $2000          ANNUAL
Projections of CO2 emission costs are even more uncertain than energy prices.                                                                SAVINGS FOR
IEA (2006b) assumes a CO2 reduction incentive of 25 US$/tCO2 in 2050. A                                                                           FUEL IN
                                                                                                                                            BILLION $2000
study commissioned by the German Advisory Council on Global Change
(WBGU 2003) suggest that under a 450 ppm CO2 stabilisation scenario the         FOSSIL FUELS                2003 - 2011 - 2021 - 2004 -               2004 -
                                                                                                             2010   2020   2030   2030                 2030
price for global CO2 emission allowances will rise to around 50 US$/tCO2 in
2030, and - depending on the scenario - to more than 100 US$/tCO2 in 2050.      Hard coal Mill t                134   780 1,753 2,667                    99
We assume that CO2 costs rise linearly from 10 US$/tCO2 in 2010 to 50           Natural gas in E+9m3             19   148   663   831                    31
                                                                                Crude oil in Mill barrel        127   700 1,135 1,962                    73
                                                                                Total                           281 1,628 3,551 5,459                   202
                                                                                                                                                                     9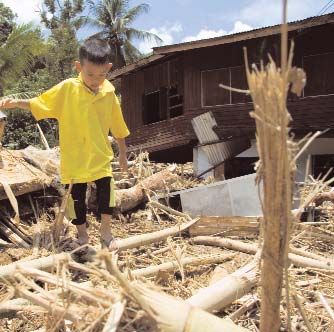
FUTU[R]E INVESTMENT
A SUSTAINABLE INVESTMENT PLAN TO SAVE THE CLIMATE

                                                                           reform of global finance institutions
table 2: Investment Costs Energy [R]evolution
                                                                           Demand for energy, particularly electricity, is increasing worldwide.
versus Reference
                                                                           This is especially the case in developing countries, which rely heavily on
                                                                           export credit agencies (ECAs) and multi-lateral development banks to
ENERGY [R]EVOLUTION                             BILLION $      AVERAGE
VERSUS REFERENCE                                              PER YEAR
                                                                           provide financing for energy and other industrial projects.
                                                              BILLION $
                                                                           To be consistent with the emerging international regime for limiting
INVESTMENT                 2003 - 2011 - 2021 - 2004 -            2004 -   greenhouse gas emissions, ECAs and other international financial
                            2010   2020   2030   2030              2030    institutions which support or underwrite projects around the world
Nuclear power plant          -222 -190 -168 -581                     -22   must have policies consistent with the need for limiting greenhouse gas
Fossil fuels                 -325 -628 -762 -1,714                   -63   emissions and climate protection. At the same time there needs to be a
Renewables                    113 1,105 1,672 2,890                  107   transition plan and flexible timeframes to avoid imposing undue
                                                                           adversity on developing countries’ economies that are overly reliant on
Total                        -434   287   742   595                   22
                                                                           conventional energy sources and exports. There also needs to be
                                                                           recognition that meeting the development goals of the world’s poorest
The comparison between the extra fuel costs in the Reference Scenario
                                                                           will require significant support for the foreseeable future.
and the extra investment costs of the Energy [R]evolution Scenario
shows that the average annual additional fuel costs of the Reference       Policies to address these issues must include:
Scenario are about 10 times higher than the additional investment          • A defined and increasing percentage of overall energy sector lending
requirement of the Energy [R]evolution Scenario.                             directed towards renewable energy and energy efficiency projects.
In fact the additional costs for coal from today till the year 2030 are    • A rapid phase out of explicit and implicit subsidies for conventional,
as high as US$100 billion, which would cover 92.5% of the total              polluting energy projects.
annual investments needed in renewable power generation required to
implement the Energy [R]evolution Scenario.                                to implement the Energy [R]evolution in the power sector
                                                                           and to avoid dangerous climate change, Greenpeace and
But these renewable energy sources will produce electricity without any    EREC demand the following from the power sector:
further fuel costs beyond 2030, while the fuel costs for coal and gas
will continue to be a burden on national economies.                        • Phase out of all subsidies for fossil fuels and nuclear energy and the
                                                                             internalisation of external costs
                                                                           • Set legally binding targets for renewable energy
                                                                           • Provide defined and stable returns for investors
                                                                           • Guaranteed priority access to the grid for renewable generators
                                                                             - and clear and simple administrative procedures
                                                                           • Strict efficiency standards for all electricity consuming appliances

10
installed capacity by technology
THERE IS HUGE OPPORTUNITY IN THE NEXT 5 TO 15 YEARS TO INVEST IN NEW SUSTAINABLE
AND CLIMATE-FRIENDLY POWER GENERATION
1
© GREENPEACE/KATE DAVISON
image MAN USING METAL GRINDER ON PART OF A WIND TURBINE MAST IN THE VESTAS FACTORY, CAMPBELLTOWN, SCOTLAND, GREAT BRITAIN.
WIND TURBINES ARE NOT ONLY A SOURCE OF RENEWABLE ENERGY, BUT ALSO OF EMPLOYMENT.
The global market for new power generation equipment is - after years on gas, the other half on coal. Lignite power plants remain a niche
of stagnation - booming. While most existing power plants are ageing market. New renewable energy capacity may be in the same range as
and need to be replaced (= “repowering”), developing countries such as new coal. However 70% of the new installed power plants in the
China and India are building new infrastructure for rapidly increasing Reference Scenario would be based on fossil fuel, 25% renewable and
electricity demand. 5% nuclear. As new nuclear capacity would mainly replace old existing
power plants, nuclear will remain marginal on the global scale.
There is huge opportunity in the next 5 to 15 years to invest in new
sustainable and climate-friendly power generation. Every decision about
new power plants taken today, will influence the energy mix of the next energy [r]evolution
30 to 40 years. In the Energy [R]evolution Scenario, however, there will be just 4,000
new fossil fuel power plants by 2030. A large percentage of those
Renewable energy sources - with the exception of bioenergy power
power plants are currently under construction or have gone online
plants - do not need any fuel, which makes operation costs independent
between 2004 and January 2007. Gas power plants - especially
of fluctuating world market fossil fuel prices, and generation costs
cogeneration - play an important role. More than half of the new power
predictable over a period of 20 years and longer.
plants run on gas, the remainder on coal. Lignite power plants will not
be built under the Energy [R]evolution Scenario. However, two thirds of
new installed capacity (global) new installed power capacity in the Energy [R]evolution Scenario
reference scenario would be based on renewable energy sources, leaving one third to fossil
In the Reference Scenario there will be almost 10,000 new fossil fuel fuels - around half of these power plants will be efficient combined heat
power plants4 by 2030. Roughly half of those power plants will be run and power plants (CHP). Nuclear capacity would cease by 2030 when
old existing power plants will be replaced by renewable power plants.
references 11
4 ASSUMING THAT THE AVERAGE SIZE IS 500 MW PER POWER PLANTFUTU[R]E INVESTMENT
A SUSTAINABLE INVESTMENT PLAN TO SAVE THE CLIMATE
figure 3: new capacity in GW - REF Scenario figure 4: new capacity in GW - energy
[r]evolution scenario
2,000 2,000
1,750 1,750
1,500 1,500
1,250 1,250
1,000 1,000
750 750
500 500
250 250
GW 0 GW 0
2004-2010 2011-2020 2021-2030 2004-2010 2011-2020 2021-2030
FOSSIL FOSSIL
NUCLEAR NUCLEAR
RENEWABLES RENEWABLES
table 3: total new installed capacity till 2030 table 4: total new installed capacity till 2030
by technology - REF by technology - E[R]
TECHNOLOGY GW 2004 - 2011 - 2021 - 2004 - TECHNOLOGY GW 2004 - 2010 - 2021 - 2004 -
2010 2020 2030 2030 2010 2020 2030 2030
Fossil GW 1,027 1,568 1,669 4,264 Fossil GW 608 720 623 1,950
- Lignite GW 24 27 29 80 - Lignite GW 0 0 1 7
- Coal GW 399 619 679 1,697 - Coal GW 196 163 62 420
- Oil GW 172 202 195 568 - Oil GW 39 41 50 130
- Gas GW 432 720 766 1,918 - Gas GW 367 516 511 1.394
Nuclear GW 126 107 94 327 Nuclear GW 17 0 0 17
Renewables GW 415 489 633 1,536 Renewables GW 477 1,371 2,023 3,872
- PV power GW 6 16 38 61 - PV power GW 22 176 551 750
- Solar thermal GW 1 1 3 5 - Solar thermal GW 2 27 109 138
- Wind power GW 89 126 249 464 - Wind power GW 138 809 1,026 1,972
- Biomass and waste GW 16 18 28 61 - Biomass and waste GW 12 21 27 60
- Geothermal GW 11 8 17 36 - Geothermal GW 10 11 20 41
- Hydro power GW 291 319 296 906 - Hydro power GW 289 316 274 879
- Ocean energy GW 0 1 1 3 - Ocean energy GW 2 11 16 30
Total GW 1,568 2,163 2,396 6,127 Total GW 1,101 2,101 2,647 5,849
12development of power plants: investment costs
WITH RENEWABLE ENERGY TECHNOLOGIES LARGE COST REDUCTIONS CAN BE ACHIEVED DUE TO TECHNICAL LEARNING,
MANUFACTURING IMPROVEMENTS AND LARGE-SCALE PRODUCTION, UNLIKE CONVENTIONAL TECHNOLOGIES.
2
© PAUL LANGROCK/ZENIT/GREENPEACE
image TWO TECHNICIANS WORKING INSIDE THE TURBINE OF TEST WINDMILL N90 2500, BUILT BY THE GERMAN COMPANY NORDEX, IN THE HARBOUR OF ROSTOCK. THIS WINDMILL
PRODUCES 2,5 MEGA WATT AND IS TESTED UNDER OFFSHORE CONDITIONS. AT LEAST 10 FACILITIES OF THIS TYPE WILL BE ERECTED 20 KM OFF THE ISLAND DARSS IN THE BALTIC SEA
BY 2007. TWO TECHNICIANS WORKING INSIDE THE TURBINE.
fossil fuel technologies and carbon capture The power company, Siemens, estimates that CO2 capture costs for oxyfuel
and storage (CCS) coal combustion is US$20-50 per tonne of CO2.The IEA estimates capture
costs between US$30-60 per tonne of CO2 not emitted into the atmosphere.
While the fossil fuel power technologies employed today for the
The costs include CO2 compression but do not include the costs of CO2
utilisation of coal, gas, lignite and oil are established and at a very late
transport and storage. If CO2 is transported 300 km from a single power
stage of market development, further cost reduction potentials are
plant, and is stored in an onshore reservoir that does not produce economic
assumed. However the overall potential for cost reductions is rather
revenue, the additional cost may be around US$8 per tonne of stored CO2.
limited and will be achieved mainly via an increase in efficiency, which
If CO2 is transported a greater distance or stored in a distant offshore
will bring down specific investment costs.5
reservoir, the additional costs may be higher, up to US$20 per tonne of
There is much speculation about the potential of carbon capture and stored CO2. As long as the price per tonne of CO2 is below US$25-30, CCS
storage (CCS) technology as a solution to mitigate climate change even might never take off - except with heavy subsidies and incentives, distorting
though the technology is still under development. competition for the best available technology including renewables: increase
of end-use efficiency, gas-fired electricity generation and wind are already
CCS is a means of trapping CO2 from fossil fuels, either before or after they
commercially available and have lower costs than future coal-fired
are burned, and “storing” (effectively disposing of) it in the sea or beneath
electricity generation with CCS. In plants with CCS, about 10-15% of the
the surface of the earth.There are currently three different methods of
CO2 would still be emitted into the atmosphere. In addition, all of the power
capturing CO2: ‘pre-combustion’, ‘post-combustion’, and ‘oxyfuel combustion’.
generation technologies emit some CO2 and other pollutants indirectly,
However, the earliest CCS could be implemented is 2020, and it will probably
during fuel production and transportation and power plant production.
not become commercially viable until 2030.
Life-Cycle Assessments (LCA) covers such indirect emissions.
For the above reasons, CCS power plants are not included
reference in our financial analysis.
13
5 GREENPEACE INTERNATIONAL BRIEFING: CARBON CAPTURE AND STORAGE, DR. GOERNE, 2007FUTU[R]E INVESTMENT
A SUSTAINABLE INVESTMENT PLAN TO SAVE THE CLIMATE
table
POWER development of efficiency and
5:PLANT investment
POWER PLANT costs for selected power plant technologies 2010 2030 2050
Coal-fired condensing power plant Efficiency (%) 41 45 48
Investment costs ($/kW) 980 930 880
Electricity generation costs including CO2 emission costs ($ cents/kWh) 6.0 7.5 8.7
CO2 emissions a)(g/kWh) 837 728 697
Oil fired condensing power plant Efficiency (%) 39 41 41
Investment costs ($/kW) 670 620 570
Electricity generation costs including CO2 emission costs ($ cents/kWh) 22.5 31.0 46.1
CO2 emissions a)(g/kWh) 1,024 929 888
Natural gas combined cycle Efficiency (%) 55 60 62
Investment costs ($/kW) 530 490 440
Electricity generation costs including CO2 emission costs ($ cents/kWh) 6.7 8.6 10.6
CO2 emissions a)(g/kWh) 348 336 325
source DLR, 2006 a) REFERS TO DIRECT EMISSIONS ONLY,
LIFE-CYCLE EMISSIONS ARE NOT CONSIDERED HERE.
investment cost projections for renewable No learning curves for technologies for the use of renewables have been
energy technologies as closely investigated as those for the photovoltaic (PV) sector, and
there is scarcely any other technology for which one can find such
Many of the technologies employed today for the utilisation of
agreement in the literature on the findings: the learning factor for PV
renewable energy sources are at a relatively early stage of market
modules, taken as the mean of the figures for various module types, is
development. Accordingly, the costs of electricity, heat and fuel
fairly constant over a period of 30 years at around 0.80, which is
production are as a rule higher today than the costs of competing
relatively high. This optimistic estimate is supported by the fact that it
conventional systems - a reminder that external costs of conventional
is still possible to achieve ongoing increases in the efficiency of PV
power production are not calculated within the prices. It is expected,
modules both in the laboratory and under real conditions. In the long
however, that compared with conventional technologies large cost
run, however, it must be assumed that the photovoltaic sector too will
reductions can be achieved due to technical learning, manufacturing
see a decline in the opportunities for cost reductions through technical
improvements and large-scale production. Especially when developing
learning, and that the learning rate will fall.
long-term scenarios spanning periods of several decades, the dynamic
trend of cost developments over time plays a crucial role in identifying In the last 20 years the development of wind energy markets has taken
economically sensible expansion strategies. very different courses in different regions. Accordingly, various studies have
observed relatively large regional differences in the individual learning
The correlation between specific investment costs and cumulative
factors. In England, for example, a country where expansion of wind energy
production volume of a technology that is empirically observed for
has been very hesitant to date, the learning factor is still around 0.75,
many products can be represented in the form of so-called learning
which points to a sharp downward trend in costs. In Germany, by contrast,
curves. The cost reduction that can be achieved by doubling cumulative
a learning factor of 0.94 was determined for wind energy systems built
production is known as the progress ratio (or learning factor; a
between 1990 and 2000.The low learning rate of 0.06 can be explained by
progress ratio f = 0.9 means that costs fall by 10% if cumulative
the high level of advance investment by the manufacturers, who kept on
production doubles; this corresponds to a learning rate of 0.1).
putting new performance classes on the market at very short intervals.
Technology-specific progress ratios are derived from a literature review.
Although expectations are that the existing cost reduction potential is not
yet exhausted, the low learning rate found for onshore systems in Germany
is adopted here and taken as constant for the period under consideration.
Owing to the relative lack of experience in the offshore sector, however, a
greater cost reduction potential is expected here and it is assumed that the
learning rate will be correspondingly higher.
14table 6: investment cost projections for renewable
energy technologies
2003 2010 2020 2030 2040 2050
Photovoltaic
capacity GW 0.56 22.9 202 511 735 894
cumulated capacity GW 2.88 25.4 214 604 1,032 1,485
progress ratio 0.8 0.8 0.85 0.9 0,92
investment costs €/kWp 5,750 2,853 1,436 1,126 1,038 994
Generation costs ct/kWh 0.37- 0.21- 0.11- 0.07- 0.06- 0.05-
Owing to the small number of concentrated solar power plants built to (min/max) 0.76 0.45 0.22 0.14 0.11 0.1
date, it is particularly difficult to arrive at reliable learning factors for Concentrating solar
this sector. Here it is assumed that the learning factor of 0.88 derived thermal
from the data for parabolic trough reflectors built in California will capacity GW 0.3544.6 72 273 459 628
change to 0.95 in the course of market introduction up to 2050. cumulated capacity GW 0.3544.7 74 311 634 1,032
For geothermal power generation systems there are no learning curves progress ratio 0.88 0.88 0.93 0.95 0.95
in the literature despite a worldwide installed capacity of around investment costs €/kWp 2,300 1,426 858 738 701 676
10,000 MWel. Since a large proportion of the costs in the geothermal Generation costs ct/kWh 0.18- 0.08- 0.06- 0.06- 0.06- 0.05-
field is due to deep drilling, the figures for the oil production sector can (min/max) 0,20 0.12 0.09 0.09 0.09 0.09
be used for drawing analogies here. Scenarios drawn up by the IPCC Wind
work on the basis that geothermal power generation costs will fall by capacity GW 41 256 1,024 1,509 1,884 2225
nearly 50 percent by 2050. cumulated capacity GW 41 270 1,166 2,163 3,293 4,576
A learning factor of 0.986 was determined for hydropower plants built progress ratio 0.94 0.94 0.94 0.94 0.94
in the OECD countries between 1975 and 1993. Recent experience investment costs €/kWp 1,350 1,141 1,001 948 913 886
however shows that as a result of compensating measures for nature Generation costs ct/kWh 0.08- 0.07- 0.06- 0.05- 0.05- 0.05-
conservation, which can amount to as much as 30 % of the investment (min/max) 0.1 0.08 0.07 0.06 0.06 0.06
volume, the specific costs for hydropower plants will tend to rise. We Biomass
(no CHP applications)
thus assume a progress ratio of 1.1, leading to an increase of specific
investment costs. capacity GW 28 85 177 261 352 433
cumulated capacity GW 28 95 229 402 623 880
progress ratio 0.85 0.86 0.87 0.9 0.92
investment costs €/kWp 3,850 2,893 2,387 2,132 1,995 1,914
Generation costs ct/kWh 0.06- 0.06- 0.06- 0.06- 0.07- 0.07-
(min/max) 0.10 0.11 0.11 0.12 0.12 0.12
Geothermal
capacity GW 10 17 26 39 54 69
cumulated capacity GW 10 21 38 64 99 141
progress ratio 0.8 0.8 0.85 0.9 0.9
investment costs €/kWp 8,000 6,349 5,205 4,606 4,314 4,087
Generation costs ct/kWh 0.12- 0.11- 0.10- 0.08- 0.07- 0.07-
(min/max) 0.23 0.19 0.15 0.12 0.10 0.10
Hydro
capacity GW 800 938 1,089 1,193 1,285 1,358
cumulated capacity GW 800 1,218 1,838 2,487 3,175 3,891
progress ratio 1.1 1.1 1.1 1.1 1.1
investment costs €/kWp 2,200 2,331 2,467 2,571 2,659 2,734
Generation costs ct/kWh 0.03- 0.04- 0.05- 0.05- 0.06- 0.06-
(min/max) 0.07 0.09 0.10 0.10 0.10 0.11
Ocean energy
capacity GW 0.24 3.4 13 36 70 104
cumulated capacity GW 0.24 3.5 15 44 96 165
progress ratio 0.85 0.85 0.87 0.9 0.92
investment costs €/kWp 6,000 3,204 2,276 1,830 1,626 1,524
Generation costs ct/kWh 0.49- 0.11- 0.07- 0.06- 0.05- 0.04-
(min/max) 0.55 0.36 0.19 0.17 0.13 0.10
15FUTU[R]E INVESTMENT
A SUSTAINABLE INVESTMENT PLAN TO SAVE THE CLIMATE
figure 5: maximum and minimum electricity generating costs of renewable and non renewable energy sources.
PV vs Oil/Diesel including peak power and residential power prices
OIL/DIESEL MAXIMUM ELECTRICITY GENERATING COST
PV MINIMUM ELECTRICITY GENERATING COST
UTILITY PEAK POWER
BULK POWER
MAXIMUM RETAIL PRICES FOR END CONSUMER
MINIMUM RETAIL PRICES FOR END CONSUMER
16figure 6 & 7: maximum and minimum electricity generating costs of renewable and non renewable energy sources
MAXIMUM ELECTRICITY GENERATING COST
MINIMUM ELECTRICITY GENERATING COST
NATURAL GAS CC WIND BIOMASS (NO CHP APPLICATIONS)
COAL GEOTHERMAL CHP CONCENTRATING SOLAR THERMAL
gas vs concentrating solar thermal, wind, biomass and geothermal
coal vs concentrating solar thermal, wind, biomass and geothermal
17FUTU[R]E INVESTMENT
A SUSTAINABLE INVESTMENT PLAN TO SAVE THE CLIMATE
fuel costs
THE RECENT DRAMATIC INCREASE IN GLOBAL OIL PRICES HAS RESULTED IN MUCH HIGHER FORWARD PRICE PROJECTIONS.
3
© LES GIBBON/GREENPEACE
image FLARE STACK AT AN OIL REFINERY IN IMMINGHAM, UK.
fossil fuel price projections Current projections of oil prices in 2030 range from the IEA’s
US$52/bbl up to over US$100. As the supply of natural gas is limited
The recent dramatic increase in global oil prices has resulted in much
by the availability of pipeline infrastructure, there is no world market
higher forward price projections. Under the 2004 ‘high oil and gas
price for natural gas. In most regions of the world the gas price is
price’ scenario by the European Commission, for example, an oil price
directly tied to the price of oil. Current projections of gas prices in
of just US$34/bbl was assumed in 2030. Ongoing modelling funded by
2030 range from the US Department of Energy’s US$4.5/GJ up to the
the Commission (CASCADE-MINTS 2006), on the other hand,
highest figure of US$6.9/GJ. Taking into account the recent
assumes an oil price of US$94/bbl in 2050, a gas price of US$15/GJ
development of energy prices, these projections might be considered too
and an international coal price of US$95/t.
conservative. Considering the growing global demand for oil and gas we
have assumed a price development path for fossil fuels in which the
price of oil reaches US$85/bbl by 2030 and US$100/bbl in 2050. Gas
prices are assumed to increase to US$9-$10/GJ by 2050.
18image A COW IN FRONT OF A
BIOREACTOR IN THE BIOENERGY
VILLAGE OF JUEHNDE. IT IS THE FIRST
COMMUNITY IN GERMANY THAT
PRODUCES ALL OF ITS ENERGY NEEDED
FOR HEATING AND ELECTRICITY,
WITH CO2 NEUTRAL BIOMASS.
© LANGROCK/ZENIT/GP
biomass price projections
table 7: assumptions on fossil fuel price development
Compared to fossil fuels, biomass prices are highly variable, ranging
from no or low costs for residues or traditional biomass in Africa or
FOSSIL FUELS 2003 2010 2020 2030 2040 2050 Asia to comparatively high costs for biofuels from energy crops. Despite
this variability, this paper assumes an aggregated price for biomass in
Crude oil in $2000/bbl 28.0 62.0 75.0 85.0 93.0 100.0 Europe. The increasing biomass prices reflect the link between biofuel
Natural gas in $2000/GJ and fossil fuel prices and a rising share of energy crops. For other
- America 3.1 4.4 5.6 6.7 8.0 regions prices are assumed to be lower, considering the large amount of
9.2
traditional biomass use in developing countries and the high potential
- Europe 3.5 4.9 6.2 7.5 8.8 10.1
of as yet unused residues in North America and the Transition Economies.
- Asia 5.3 7.4 7.8 8.0 9.2 10.5
Hard coal $2000/t 42.3 59.4 66.2 72.9 79.7 86.4
cost of CO 2 emissions
Projections of CO2 emission costs are even more uncertain than energy
table 8: assumptions on biomass price development prices. IEA (2006b) assumes a CO2 reduction incentive of 25 US$/tCO2
$2000/GJ in 2050. A study commissioned by the German Advisory Council on
Global Change (WBGU 2003) suggests that under a 450 ppm CO2
stabilisation scenario the price for global CO2 emission allowances will
BIOMASS 2003 2010 2020 2030 2040 2050
rise to around 50 US$/tCO2 in 2030, and - depending on the scenario -
to more than 100 US$/tCO2 in 2050. We assume that CO2 costs rise
Biomass in $2000/GJ
linearly from 10 US$/tCO2 in 2010 to 50 US$/tCO2 in 2050, which is
- Europe 4.8 5.8 6.4 7.0 7.3 7.6 twice as high as the IEA’s projection, but still conservative compared
- other Regions 1.4 1.8 2.3 2.7 3.0 3.2 with other studies. We assume that CO2 emission costs will be
accounted for in Non-Annex B countries only after 2020.
Assigning a price to CO2 emissions we implicitly assume the
table 9: assumptions on CO 2 price development
introduction of a global CO2 tax, which further increases the economic
($/TCO2)
competitiveness of renewable energies compared to fossil fuels.
COUNTRIES 2010 2020 2030 2040 2050
Kyoto Annex B countries 10 20 30 40 50
Non-Annex B countries 20 30 40 50
19You can also read