INVESTMENT UPDATE - SBI Mutual Fund

Page created by Virginia Oconnor
 
CONTINUE READING
INVESTMENT UPDATE - SBI Mutual Fund
INVESTMENT UPDATE
              st
Report as on 31 May 2021
INVESTMENT UPDATE - SBI Mutual Fund
INDEX
 Content                                                                          Category                                                                    No.

 From the Managing Director’s Desk                                                                                                                              04
......................................................................................................................................................................
 Market Overview                                                                                                                                                05
......................................................................................................................................................................
 From the Chief Business Officer's Desk                                                                                                                         08
......................................................................................................................................................................
 Snapshot of Equity Funds & Other Categories                                                                                                                    09
......................................................................................................................................................................
 SBI Blue Chip Fund                                                               Equity - Large Cap                                                            12
......................................................................................................................................................................
 SBI Magnum Equity ESG Fund
 (Previously known as SBI Magnum Equity Fund)                                     Equity - Thematic Fund                                                        13
......................................................................................................................................................................
 SBI Flexicap Fund                                                                                                                                              14
 (Previously known as SBI Magnum Multicap Fund)                                   Equity - Flexicap Fund
......................................................................................................................................................................
 SBI Contra Fund                                                                  Equity - Contra Fund                                                          15
......................................................................................................................................................................
 SBI Large & Midcap Fund                                                                                                                                        16
 (Previously known as SBI Magnum Multiplier Fund)                                 Equity - Large & Mid Cap Fund
......................................................................................................................................................................
 SBI Focused Equity Fund                                                                                                                                        17
 (Previously known as SBI Emerging Businesses Fund)                               Equity - Focused Fund
......................................................................................................................................................................
 SBI Magnum MidCap Fund                                                           Equity - Mid Cap Fund                                                         18
......................................................................................................................................................................
 SBI Magnum Global Fund                                                           Equity - Thematic Fund                                                        19
......................................................................................................................................................................
 SBI Small Cap Fund                                                                                                                                             20
 (Previously known as SBI Small & Midcap Fund)                                    Equity - Small Cap Fund
......................................................................................................................................................................
 SBI Long Term Equity Fund                                                                                                                                      21
 (Previously known as SBI Magnum Taxgain Scheme)                                  Equity - ELSS
......................................................................................................................................................................
 SBI Healthcare Opportunities Fund                                                                                                                              22
 (Previously known as SBI Pharma Fund)                                            Equity - Sectoral Fund
......................................................................................................................................................................
 SBI Banking And Financial Services Fund                                          Equity - Sectoral Fund                                                        23
......................................................................................................................................................................
 SBI PSU Fund                                                                     Equity - Sectoral Fund                                                        24
......................................................................................................................................................................
 SBI Magnum Comma Fund                                                            Equity - Sectoral Fund                                                        25
......................................................................................................................................................................
 SBI Infrastructure Fund                                                          Equity - Sectoral Fund                                                        26
......................................................................................................................................................................
 SBI Consumption Opportunities Fund
                                                                                                                                                                27
 (Previously known as SBI FMCG Fund)                                              Equity - Thematic
......................................................................................................................................................................
 SBI Technology Opportunities Fund
                                                                                                                                                                28
 (Previously known as SBI IT Fund)                                                Equity - Sectoral Fund
......................................................................................................................................................................
 SBI Equity Minimum Variance Fund                                                 Equity - Thematic                                                             29
......................................................................................................................................................................
  SBI Gold Fund                                                                    Fund of Funds                                                                30
......................................................................................................................................................................
 SBI International Access - US Equity FoF                                         Fund of Funds                                                                 31
......................................................................................................................................................................
 SBI Nifty Index Fund                                                             Index Fund                                                                    32
......................................................................................................................................................................
 Snapshot of Hybrid Funds & Solution Oriented Scheme                                                                                                            33
......................................................................................................................................................................
 SBI Equity Hybrid Fund
                                                                                                                                                                35
 (Previously known as SBI Magnum Balanced Fund)                                   Hybrid - Aggressive Hybrid Fund
......................................................................................................................................................................
 SBI Dynamic Asset Allocation Fund                                                Hybrid - Dynamic Asset Allocation Fund                                        36
......................................................................................................................................................................
 SBI Debt Hybrid Fund
                                                                                                                                                                37
 (Previously known as SBI Magnum Monthly Income Plan)                             Hybrid - Conservative Hybrid Fund
......................................................................................................................................................................
 SBI Multi Asset Allocation Fund
 (Previously known as SBI Magnum Monthly                                                                                                                        38
 Income Plan - Floater)                                                           Hybrid - Multi Asset Allocation Fund
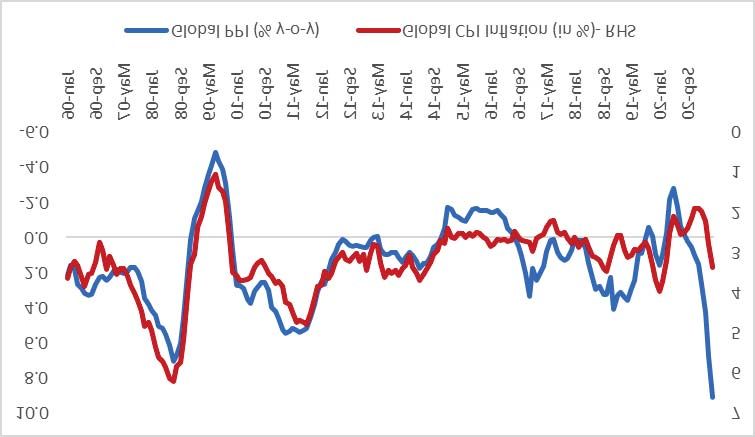
INVESTMENT UPDATE - SBI Mutual Fund
INDEX
 Content                                                                                   Category                                                              No.
 SBI Magnum Children's Benefit Fund - Savings Plan                                                                                                                39
 (Previously known as SBI Magnum Children's Benefit Fund)                                  Solutions Oriented Scheme - Children’s Fund
......................................................................................................................................................................
 SBI Equity Savings Fund                                                                   Hybrid - Equity Savings Fund                                           40
......................................................................................................................................................................
 SBI Arbitrage Opportunities Fund                                                          Hybrid - Arbitrage Fund                                                41
......................................................................................................................................................................
 SBI Magnum Children’s Benefit Fund – Investment Plan                                      Solutions Oriented Scheme - Children’s Fund                            42
......................................................................................................................................................................
 SBI Retirement Benefit Fund – Aggressive Plan                                             Solutions Oriented Scheme - Retirement Fund                            43
........................................................................................................................................................................
 SBI Retirement Benefit Fund – Aggressive Hybrid Plan                                      Solutions Oriented Scheme - Retirement Fund                            44
......................................................................................................................................................................
 SBI Retirement Benefit Fund – Conservative Hybrid Plan                                    Solutions Oriented Scheme - Retirement Fund                            45
......................................................................................................................................................................
 SBI Retirement Benefit Fund – Conservative Plan                                           Solutions Oriented Scheme - Retirement Fund                            46
......................................................................................................................................................................
 Snapshot of Debt Funds & Other Categories                                                                                                                        47
......................................................................................................................................................................
 SBI Magnum Gilt Fund
                                                                                                                                                                  49
 (Previously known as SBI Magnum Gilt Fund - Long Term Plan)                               Debt - Gilt Fund
......................................................................................................................................................................
 SBI Magnum Income Fund                                                                    Debt - Medium To Long Duration Fund                                    50
......................................................................................................................................................................
 SBI Dynamic Bond Fund                                                                     Debt - Dynamic Bond Fund                                               51
......................................................................................................................................................................
 SBI Corporate Bond Fund                                                                   Debt - Corporate Bond Fund                                             52
......................................................................................................................................................................
 SBI Credit Risk Fund
                                                                                                                                                                  53
 (Previously known as SBI Corporate Bond Fund)                                             Debt - Credit Risk Fund
......................................................................................................................................................................
 SBI Magnum Medium Duration Fund
                                                                                                                                                                  54
 (Previously known as SBI Regular Savings Fund)                                            Debt - Medium Duration Fund
......................................................................................................................................................................
 SBI Short Term Debt Fund                                                                  Debt - Short Duration Fund                                             55
......................................................................................................................................................................
 SBI Magnum Constant Maturity Fund
                                                                                                                                                                  56
 (Previously known as SBI Magnum Gilt Fund - Short Term Plan)                              Debt - Gilt Fund With 10 Year Constant Duration
......................................................................................................................................................................
 SBI Magnum Low Duration Fund
                                                                                                                                                                  57
 (Previously known as SBI Ultra Short Term Debt Fund)                                      Debt - Low Duration Fund
......................................................................................................................................................................
 SBI Savings Fund                                                                          Debt - Money Market Fund                                               58
......................................................................................................................................................................
 SBI Banking and PSU Fund
                                                                                                                                                                  59
 (Previously known as SBI Treasury Advantage Fund)                                         Debt - Banking And PSU Fund
......................................................................................................................................................................
 SBI Liquid Fund
                                                                                                                                                                  60
 (Previously known as SBI Premier Liquid Fund)                                             Debt - Liquid Fund
......................................................................................................................................................................
 SBI Magnum Ultra Short Duration Fund
                                                                                                                                                                  61
 (Previously known as SBI Magnum InstaCash Fund)                                           Debt - Ultra Short Duration Fund
......................................................................................................................................................................
 SBI Floating Rate Debt Fund                                                               Debt – Floater Fund                                                    62
......................................................................................................................................................................
 SBI Overnight Fund
                                                                                                                                                                  63
 (Previously known as SBI Magnum InstaCash Fund -
 Liquid Floater)                                                                           Debt - Overnight Fund
......................................................................................................................................................................
 Comparative Performance for all Schemes                                                                                                                          64
......................................................................................................................................................................
 Systematic Investment Plan (SIP)                                                                                                                                70
......................................................................................................................................................................
 Total Expense Ratios                                                                                                                                            74
......................................................................................................................................................................
 IDCW History Of Debt & Hybrid Funds                                                                                                                              75
......................................................................................................................................................................
 Disclaimer                                                                                                                                                      78
......................................................................................................................................................................
 SBI Funds Management Pvt Ltd Branches                                                                                                                           79
......................................................................................................................................................................
 How to read the Factsheet                                                                                                                                       80
From the Managing Director’s Desk

Vinay M. Tonse
MD & CEO

        Dear Investors,
        Summer is on its way out and the south-west monsoons are almost upon us. While the lockdown may have spared
        most of us from the scorching heat this year, what is worrisome is the temperatures that have been consistently
        on the rise over the past few years. Proof of that is in the two cyclones we saw in the month of May which were said
        to be caused by excessive heating of ocean waters.
        Cyclone Tauktae and Yaas, which hit the western and eastern coasts respectively, caused severe damage to
        property and lives in many parts of the country. In all, we have seen 8 severe cyclones since 2019 in India alone.
        That climate change has led to these frequent, off-season cyclones cannot be denied. No natural disaster, be it
        cyclones, forest fires, avalanches or floods can be seen as being caused by nature alone. Human action is directly
        or indirectly responsible for the frequency and the magnitude of it. Therefore, it is crucial that we start taking
        measures today, no matter how big or small.
        As a fund house, we have already started taking our responsibility seriously. In fact, we were the first fund house
        to launch an ESG-themed mutual fund in India and were among the earliest asset managers to adopt a
        responsible investment strategy apart from being the first Indian AMC to adopt the Stewardship Code. While at
        the moment we may not be contributing much directly to impact investment areas, our deep-rooted commitment
        to the Sustainable Development Goals pushed us to support the impact investing ecosystem in the country from
        the outside. *Consequently, we became the only Indian AMC to support budding entrepreneurs working for
        environment and society through the SDG Cart Innovation contest. We were also among the first Indian
        signatories to UNPRI and Ca100+. Our voluntary Integrated Report is a testimony to our transparency
        commitment.
        Much as we have a responsibility towards the environment and society at large, our first responsibility is towards
        our investors. Given the uncertainty on growth and market movement, we have been looking to offer financial
        solutions that make the most of the current circumstances. We have been, at regular intervals, launching Fixed
        Maturity Plans (FMPs) which are close-ended funds debt funds to give investors an opportunity to lock-in
        investments at current yields. Market view is that rates are likely to remain subdued in the near-term and with the
        RBI leaving rates unchanged in their June 2021 policy meet announcement, the signal from the central bank is
        one of caution and concern on growth and inflation front.
        We cannot have a one-size-fits-all concept when it comes to investment strategy for investors. A good investment
        strategy varies based on the investor’s investment horizon and risk appetite. Looking at the current market
        scenario, we believe new investors can look at investing in hybrid funds with debt-orientation as it endeavours to
        provide optimum and potential tax efficient returns Debt hybrid funds could provide some stability in returns
        through debt exposure and a kicker - though with a little bit of risk – through exposure to equities. It must be
        noted that both these funds are slightly more sophisticated than plain vanilla mutual fund schemes and investors
        could consider consulting a financial advisor before investing in them.
        Lastly, as lockdown restrictions are gradually lifted, businesses will take their time coming back to some
        semblance of normalcy. The same is true for us and until then we are available across all online platforms our
        website, app, WhatsApp, partner portal, among others. We are here for our clients and partners and feel free to
        reach out to us at any time. Continuing investments through the volatility today will help in wealth creation for
        the future.
        On that note, wish you a productive and pleasant June! Stay safe, stay healthy, and stay invested.

        Warm Regards,
        Vinay M. Tonse
        Managing Director & CEO
        *Source: Internal
                                                                                                                               04
Market Overview

The debate surrounding the long-awaited revival of inflation and its implications on monetary policy
settings has re emerged in recent times. At the same time, global central banks have so far firmly resisted
any discussions about unwinding the extraordinary support measures. Central to the cautious approach
has been the experience of the years since the global financial crisis, wherein developed markets central
banks have consistently failed to achieve the 2% inflation target inspite of large monetary accommodation
and unconventional policy measures including large scale asset purchases. At the same time, there
remains the challenge in terms of disentangling the "durable" from the "transient" elements in the current
phase of inflation upswing considering the pandemic induced supply shocks. Central Banks such as the US
FED have also made material changes in their policy framework that allows an overshoot of inflation over
the target.

The wedge between wholesale and consumer prices have been evident across most geographies. Higher
commodity prices have fed into higher producer prices globally. US PPI inflation surged to 6.2% in April (vs.
2.8% two months ago). China posted 6.8% (vs. deflation through 2020). Indian WPI, proxy for producer
prices, surged to 10.5%. This has not been passed onto consumer prices to similar strength and extent.

Until around 2013, there was a reasonably close correlation between headline CPI and PPI inflation.
However, this has changed over the last seven-eight years: the correlation has weakened. What accounts
for this is hard to say, but structural changes are likely at work, such as increased competition within
industries that limit the pass-through from higher producer to consumer prices. Therefore, the latest
spike in the PPI, largely driven by higher commodity prices, has not fed entirely into a major surge in
consumer prices. Within consumer prices, the momentum appears to be faster for developed market
economies vis-a-vis emerging market economies, as the former sees demand support from fiscal stimulus
and faster vaccination. Emerging market economies, on the other hand, have a relatively contained
Consumer price inflation (compared to their own history).

Source: SBIMF Research

                                                                                                                05
The overwhelming presence of large fiscal stimulus apart from the recent trends of supply chain realignment
and increasing use of tariffs present a new dynamic to monitor with respect to its impact on long term
inflation formation. Whether these represent a turning point in the inflation cycle is yet to be known.
However, given the role of low interest rates supporting asset prices, how central banks respond to signs of
any durable pickup in inflation in terms of "tapering" the support currently being provided is crucial to
monitor.

Equity

Indian equities had a strong month as the Nifty and the Sensex surged about 6.5% apiece with the former
recording fresh all time high and the latter in touching distance of it buoyed by moderation in Covid
infections. Covid cases peaked in early May and continued to see a significant reduction through the month.
Not surprisingly the up move has been led by pro-economy segments with Financials, Small caps, and
Services and hospitality outperforming. There were other supportive trends at play too as global yields stayed
moderate, the dollar weakened, and Emerging Market equities found a bid again. The ongoing result season
has been strong as expected with the Nifty companies having reported so far suggesting nearly 18% and 40%
year on year growth on sales and operating profits respectively off a weak base. The year has shaped up well
too with net profit for Nifty rising in high teens. In a year when the economy contracted by 7.3% on a real basis
and 3% even in nominal terms, this growth in earnings is quite remarkable and supports the thesis that
corporate profits to GDP in India may finally be reverting higher after having plunged to multi-year lows.

A key factor driving profits for corporate India this year has been a significant expansion in margins driven by
cost efficiencies. While some of the cost may come back as operations resume in full swing and raw material
prices continue to see upward pressure, on the other hand as growth normalizes, operating leverage benefits
should kick in and support margins. In addition, several sectors that have adversely impacted corporate
profits over the past few years such as corporate banks, telecom, and metals appear to have turned the
corner. Policy backdrop continues to be extremely favourable. Aggressive fiscal expansion in addition to
super accommodative monetary policy in the West, most notably the US, should augur well for a reflation in
the global economy. Stronger balance sheets for banks, healthier corporate balance sheets, leaner cost
structures and reforms around formalization of the economy, corporate taxes, PLIs, GST, real estate, etc
augur well. We therefore continue to believe that we are in early stages of a new earnings cycle.

Yet the path, at least in the near term, is unlikely to be linear. While the worst of second wave appears to be
behind, how long does it take for the scars of the crisis to heal and how quickly does consumer and corporate
confidence return on the other side of the current crisis is still a question mark. Distress in the unorganized
sector and unemployment have soared. Whether and to what extent can the government provide fiscal relief
to dampen the impact is yet to be seen. The progress on vaccination is another key monitorable as that will
determine the true extent of reopening as well as the probability of another harsh wave. Globally, rates and
dollar have stayed benign so far, even with rising inflation prints as central banks as well as markets see these
as transient. However, continued high inflation prints may cause near term jitters. Above all, the most
important near-term risk in our view comes from an elevated reading on our proprietary equity sentiment
index which suggests overheated sentiment and may limit upsides in the short term. However, given our
positive structural view, we continue to see any tactical corrections as welcome opportunities to add pro-
economy assets and stocks.

                                                                                                                    06
Fixed Income:

The RBI's GSAP auctions and the continuing implicit yield curve control strategy has kept the benchmark 10y
sovereign bond yield anchored around 6% in the recent period. This has come at the cost of the cumulative
fiscal year to date gross dated securities borrowings being lower by around `180 bn over the notified
amounts. The RBI has had to reject auction bids/ devolve auctions on Primary dealers in its endeavour to hold
the benchmark around 6%. Large cash balances from the previous fiscal year as well as a larger than budgeted
surplus transfer by the RBI have provided sufficient cushion for the same in Q1 FY22. The RBI surplus transfer
amounting to `991 Bn is higher than the budgeted amounts by around `450-500 Bn. At the same time, the
impact of the second wave on overall government finances, both on the revenue side as well as additional
expenditures is uncertain currently. Alongside the supply side reform measures and additional Government

capex that has been budgeted, there may still be a case to provide more targeted income support or fiscal
relief to mitigate the economic and social impact of the pandemic. The provision of additional liquidity or
monetary policy support may be incrementally less effective and potentially create issues with respect to
asset market distortion and financial stability.

In this context, the central bank would find it extremely challenging to hold the line on bond yields in the
absence of robust natural demand at levels targeted so far. Additional GSAP / other market interventions
would remain a necessary requirement for a while. While the overall indirect taxes had shown steady growth
since the second half of FY21, the impact of recent regional lockdowns on account of the second wave could
lead to a slowdown in Q1FY22. The gap between protected revenues to states and the compensation cess
collection is likely to be bridged through market borrowings intermediated by the central government as in
the previous fiscal year.

From a market perspective, the continuation of excessively surplus liquidity and ongoing RBI intervention
remains important to support or validate the existing market levels and credit spreads. This remains a key
vulnerability factor. The market reaction in January 20 after the RBI initiated the resumption of the revised
liquidity management framework through 14D reverse repo auctions is sufficient evidence of the potential
vulnerability.

As the second wave subsides and activity levels start to normalise, there would sufficient reasons to start the
normalisation of crisis era liquidity and monetary support. The liquidity impact of interventions in
Government securities market, that may still be required in view of the larger borrowing requirements, may at
the margin needs to be sterilised. Incremental GSAP auctions from the second quarter may well be
accompanied by longer term variable rate reverse repo auctions. This may provide a signal for a gradual
normalisation of money market rates away from the reverse repo floor.

Data Source: Bloomberg, SBI MF research,

                                                                                                                  07
From the Chief Business Officer's Desk

D.P. Singh
Chief Business Officer

         Dear Friends,

         The heartening news right now, as I write this, is that cases across the country are tapering off.
         However, we must continue to exercise caution as we resume, and activities are ‘unlocked’ once
         again. Our country’s GDP contracted 7.3% in the pandemic hit FY21 however Q4 gross GDP saw a 1.6%
         growth just before the second wave hit to disrupt the recovery momentum. Equity Markets have been
         buoyant for some time, with the S&P BSE Sensex rising almost 3000 points in May and continue their
         upward trajectory amidst expectations of further easing of restrictions and falling cases.

         Equity Oriented schemes saw net inflows in most categories last month as mutual funds are being
         seen as a better option than traditional saving options to deliver better inflation-adjusted returns. As
         a fund house we launch Fixed Maturity Plans (FMPs) from time to time and it allows investors to lock-
         in their investments at current yields and stand a chance to get a potentially better tax-adjusted
         return than traditional saving investments of a comparable time horizon due to the indexation
         benefits.

         As the wait for a proper normalcy persists, we must use this phase to ‘right the wrongs’ with our own
         personal finances. An uptick in the equity market might have changed your desired asset allocation
         and many of us might have saved more due to lower discretionary spends during the last year. We
         must allocate such ‘surplus’ to ultrashort, money market or short-term debt funds for emergencies
         and other potential short-term needs while investing the rest in equity-based funds, if available, for
         medium and long-term needs. The changes I am recommending also extend to other areas of your
         investments like having a nominee in place, ensuring bank accounts are linked and contact
         information is updated for your investments and savings.

         The current scenario has also brought into spotlight funds which are value-oriented in nature and
         ESG-compliant funds or those which invest in Environmentally, Socially and Responsible companies.
         These funds merit a place in your portfolio if you or a financial adviser deems fit after assessing your
         individual financial situation.

         I urge you all to stay safe and take due precautions when you step out. Stay Healthy and Stay Safe.

         Warm Regards,

         D.P.Singh

         Chief Business Officer

         Source: National Statistical Office Press Note (May 31, 2021) for GDP estimates, AMFI as of May 31, 2021, for
         Mutual Fund Industry data

                                                                                                                         08
Snapshot of Equity Funds & Other Categories
                                                                      SBI Magnum Equity                                                                                SBI Large &
                                                                           ESG Fund                                                                                    Midcap Fund                   SBI Magnum                      SBI Magnum
Scheme Name                               SBI Blue Chip Fund                                          SBI Flexicap Fund               SBI Contra Fund
                                                                      (Previously known as SBI                                                                    (Previously known as SBI           Midcap Fund                     Global Fund
                                                                        Magnum Equity Fund)                                                                       Magnum Multiplier Fund)

Ideal Investment Horizon                       4 years +                     3 years +                     4 years +                         5 years +                   4 years +                      5 years +                      5 years +

Inception Date                               14/02/2006                    01/01/1991                    29/09/2005                      05/07/1999                    28/02/1993                     29/03/2005                     30/09/1994

                                                                                                                                    Mr. Dinesh Balachandran                                                                      Mr. Anup Upadhyay
Fund Manager                               Ms. Sohini Andani             Mr. Ruchit Mehta            Mr. Anup Upadhyay            & Mohit Jain (investments in       Mr. Saurabh Pant             Ms. Sohini Andani
                                                                                                                                   foreign securities portion)

Managing Since                                 Sep-2010                      May-2018                      Feb-2017                       May-2018                       Sep-2016                       July-2010                      May-2018

                                                                       Nifty 100 ESG Index                                        S&P BSE 500 Index (TRI)        Nifty Large MidCap 250        Nifty Midcap 150 Index            Nifty MNC Index (TRI)
Benchmark                               S&P BSE 100 Index (TRI)                (TRI)               S&P BSE 500 Index (TRI)                                              Index (TRI)                     (TRI)
                                                                                                    Fund Details as on 31 May 2021
Month End AUM (` in Crores)               `28,241.54 Crores              `3,771.06 Crores             `13,368.10 Crores               `2,250.98 Crores               `4,085.65 Crores              `5,248.46 Crores                `4,793.49 Crores

Portfolio Turnover                                0.13                          0.75                          0.54                             1.60                         0.79                           0.25                           0.23
Standard Deviation#                             22.81%                        21.71%                        22.54%                            24.81%                      24.11%                         26.87%                         16.51%

Beta#                                             1.02                          1.00                          0.97                             1.04                         0.98                           0.97                           0.85
              #
Sharpe Ratio                                      0.47                          0.53                          0.49                             0.52                         0.55                           0.51                           0.64
                                            Regular- 1.73%                Regular- 2.13%                Regular- 1.87%,               Regular- 2.18%,                 Regular- 2.13%                Regular- 2.05%,                 Regular- 2.04%,
Expense Ratio                                                              Direct- 1.30%                 Direct- 0.87%                 Direct- 1.56%                   Direct- 1.38%                 Direct- 1.12%                   Direct- 1.26%
                                             Direct- 0.97%
                                                                                 Portfolio Classification By Asset Allocation (%) as on 31 May 2021
Large Cap (%)                                    86.86                         82.30                         66.65                             47.57                       40.21                           2.53                           46.26

Mid Cap (%)                                       9.03                         10.30                         16.37                             13.45                        38.33                         65.66                           22.09

Small Cap (%)                                     1.44                          1.19                         11.10                             33.64                       18.25                          25.60                           20.98

Unclassified (%)                                    -                           3.11                            -                              2.26                           -                            0.44                           5.64

Other Assets (%)                                  2.66                          3.08                           5.88                            3.08                          3.21                          5.77                           5.00
                                                                              Portfolio Classification By Industry Allocation (%) as on 31 May 2021
Portfolio Classification By Industry Financial Services     34.82    Financial Services   30.02    Financial Services   30.25    Financial Services      20.75   Financial Services   22.96    Industrial                      Consumer Goods       28.11
                                     Automobile             10.44    IT                   18.83    IT                   10.42    Industrial                      Industrial                    Manufacturing           16.62   Industrial
Allocation (%) (Top 10)
                                       IT                   10.34    Automobile             5.96   Consumer Goods       10.33    Manufacturing           10.52   Manufacturing        15.75    Financial Services      14.40   Manufacturing        24.67
                                       Pharma                7.26    Consumer Goods         5.58   Oil & Gas              8.72   Oil & Gas                9.53   Consumer Goods       11.02    Pharma                   9.47   Pharma               13.97
                                       Construction          6.85    Cash, Cash Equivalents        Cash, Cash Equivalents                                        Pharma                 8.99   Consumer Goods           9.47   IT                     8.12
                                                                                                                                 Pharma                   8.99
                                       Oil & Gas             6.76    And Others             5.44   And Others             5.88                                                                 Cement & Cement                 Automobile             5.45
                                                                                                                                 Consumer Goods           7.30   Automobile             7.94
                                       Consumer Goods        5.99                                  Pharma                 4.13                                                                 Products                 8.95   Cash, Cash Equivalents
                                                                     Pharma                 5.30                                                                 Textiles               6.71
                                       Cement & Cement                                             Industrial                    Automobile               6.75                                 Construction             7.59   And Others             5.00
                                                                     Industrial                                                                                  Oil & Gas              6.07
                                       Products               4.21   Manufacturing          4.43   Manufacturing          3.65   IT                       5.95                                 Automobile               6.29   Chemicals              2.89
                                       Industrial                                                  Chemicals              3.61                                   IT                     5.59   Cash, Cash Equivalents          Consumer Services      2.70
                                                                     Consumer Services      4.06                                 Consumer Services        5.87
                                       Manufacturing          4.08                                 Cement & Cement                                               Consumer Services      3.54   And Others               5.77   Cement & Cement
                                                                     Oil & Gas              3.73                                 Construction             5.05
                                       Cash, Cash Equivalents                                      Products               3.54                                   Cash, Cash Equivalents        Fertilisers & Pesticides 5.04   Products               2.42
                                       And Others             2.66   Metals                 3.56   Metals                 3.46   Power                    3.67   And Others             1.90   Textiles                 4.42   Textiles               2.08
                                                                                                                 Other Details
Exit Load                                  Within 1 Year - 1%            Within 1 Year - 1%              On or Before 30              Within 1 Year - 1%               On or Before 30             Within 1 Year - 1%              Within 1 Year - 1%
                                                                                                          days - 0.10%                                                  days - 0.10%

                                                                                                                     #
 Please consult your financial advisor before investing. For details, please refer to respective page of the scheme. Risk Free rate: FBIL Overnight Mibor rate (3.39% as on 31st May 2021)
 Basis for Ratio Calculation: 3 Years Monthly Data Points.
 Expense ratio includes GST, Base TER and additional expenses as per regulation 52(6A)(b) and 52(6A)(c) of SEBI (MF) regulations for both Direct and Regular plan                                                                                     05
                                                                                                                                                                                                                                                      09
Snapshot of Equity Funds & Other Categories
                                          SBI Focused Equity                                               SBI Long Term               SBI Healthcare                 SBI Banking &
                                                                          SBI Small Cap Fund                                                                                                                                           SBI Magnum
Scheme Name                             Fund (Previously known as         (Previously known as SBI          Equity Fund              Opportunities Fund             Financial Services                  SBI PSU Fund
                                         SBI Emerging Businesses            Small & Midcap Fund)        (Previously known as SBI     (Previously known as SBI                                                                          COMMA Fund
                                                  Fund)                                                Magnum Taxgain Scheme)              Pharma Fund)                    Fund

Ideal Investment Horizon                        5 years +                       5 years +                     3 years +                     Tactical                      Tactical                         Tactical                        Tactical

Inception Date                                17/09/2004                      09/09/2009                    31/03/1993                   05/07/1999                    26/02/2015                       07/07/2010                      08/08/2005

                                                                                                             Mr. Dinesh
Fund Manager                                Mr. R. Srinivasan               Mr. R. Srinivasan                                         Mr. Tanmaya Desai             Mr. Milind Agrawal            Mr. Richard D'souza             Mr. Richard D'souza
                                                                                                            Balachandran

Managing Since                                 May-2009                        Nov - 2013                     Sep-2016                     Jun-2011                     Aug - 2019                        Aug-2014                         Aug-2014

                                                                        S&P BSE Small Cap Index       S&P BSE 500 Index (TRI)       S&P BSE HEALTH CARE          Nifty Financial Services      S&P BSE PSU INDEX (TRI)             Nifty Commodities
Benchmark                               S&P BSE 500 Index (TRI)                                                                                                         Index (TRI)
                                                                                 (TRI)                                                   Index (TRI)                                                                                   Index (TRI)

                                                                                                       Fund Details as on 31 May 2021

Month End AUM (Rs. in Crores)              `15,884.19 Crores                `8,665.51 Crores              `9,897.54 Crores             `1,900.44 Crores              `2,647.35 Crores                `330.28 Crores                  `399.83 Crores

Portfolio Turnover                                0.60                             0.52                          0.51                         0.50                          0.24                            0.34                             0.40
                     #
Standard Deviation                              21.71%                           25.96%                        22.21%                       20.64%                        31.10%                           25.77%                           24.96%

    #
Beta                                              0.90                             0.85                          0.96                         0.87                          1.00                            0.81                             0.90

Sharpe Ratio#                                     0.56                             0.60                          0.47                         1.06                          0.48                            0.12                             0.70

                                             Regular- 1.79%                  Regular- 1.97%                Regular- 1.77%,              Regular- 2.25%,               Regular- 2.18%                 Regular- 2.53%,                 Regular- 2.76%,
Expense Ratio                                 Direct- 0.75%                   Direct- 0.85%                 Direct- 1.23%                Direct- 1.07%                 Direct- 0.88%                  Direct- 1.73%                   Direct- 2.02%
                                                                                    Portfolio Classification By Asset Allocation (%) as on 31 May 2021
Large Cap (%)                                     51.05                              -                          62.92                         66.82                         81.50                          58.98                            55.23

Mid Cap (%)                                       30.66                           16.43                          23.78                        13.16                         8.72                            22.17                            2.71

Small Cap (%)                                     1.24                            76.17                          11.79                        16.39                         3.49                            10.48                           34.98

Unclassified (%)                                  6.86                             0.74                             -                         0.35                            -                                -                             1.14

Other Assets (%)                                  10.19                            6.66                          1.51                         3.28                          6.29                            8.37                             5.94
                                                                                  Portfolio Classification By Industry Allocation (%) as on 31 May 2021
Portfolio Classification By Industry Financial Services         21.78   Industrial                    Financial Services   27.25   Pharma               84.92    Financial Services   93.71    Oil & Gas               30.18   Metals                 24.69
                                     Consumer Goods             12.70   Manufacturing        22.64    Pharma               10.34   Healthcare Services 11.45     Cash, Cash Equivalents                                        Oil & Gas              19.80
Allocation (%) (Top 10)                                                                                                                                                                        Metals                  21.92
                                       Cash, Cash Equivalents           Consumer Goods       21.22    IT                    8.43                                 And Others             6.29
                                                                                                                                   Cash, Cash Equivalents                                                                      Chemicals              19.37
                                       And Others                9.87   Chemicals            10.17    Industrial                                                                               Financial Services      16.47
                                                                                                                                   And Others             3.28
                                                                        Consumer Services      7.40   Manufacturing         8.29                                                                                               Cement & Cement
                                       Power                     9.50                                                              Construction           0.35                                 Power                   14.72   Products               14.85
                                       Pharma                    9.50   Cash, Cash Equivalents        Automobile            6.66
                                                                        And Others             6.66                                                                                            Cash, Cash Equivalents          Consumer Goods          7.71
                                       IT                        6.86                                 Oil & Gas             6.48                                                               And Others             8.37
                                                                        Cement & Cement               Construction          6.15                                                                                               Cash, Cash Equivalents
                                       Automobile                4.97   Products               5.91                                                                                            Industrial
                                                                                                      Consumer Goods        5.92                                                                                               And Others             5.94
                                       Industrial                       Financial Services     5.78                                                                                            Manufacturing            4.19
                                       Manufacturing             4.62                                 Cement & Cement                                                                                                          Power                   3.33
                                                                        Construction           4.73   Products              4.61                                                               Services                 4.15
                                       Telecom                   4.38                                                                                                                                                          Fertilisers & Pesticides 3.17
                                                                        Power                  3.03   Power                 3.42
                                       Consumer Services         4.06   Automobile             2.92                                                                                                                            Utilities               1.14

                                                                                                                    Other Details
Exit Load                                  Within 1 Year - 1%               Within 1 Year - 1%                    NIL               Within 15 Days - 0.50%          Within 30 days - 0.50%         Within 30 days - 0.50%          Within 30 days - 0.50%
                                                                                                                                                                    (w.e.f. June 07, 2021)         (w.e.f. June 07, 2021)          (w.e.f. June 07, 2021)

 Please consult your financial advisor before investing. For details, please refer to respective page of the scheme. #Risk Free rate: FBIL Overnight Mibor rate (3.39% as on 31st May 2021 Basis for Ratio
 Calculation: 3 Years Monthly Data Points. Expense ratio includes GST, Base TER and additional expenses as per regulation 52(6A)(b) and 52(6A)(c) of SEBI (MF) regulations for both Direct and Regular plan                                            10
Snapshot of Equity Funds & Other Categories
                                                                     SBI Consumption                 SBI Technology                                                                            SBI International
                                      SBI Infrastructure            Opportunities Fund              Opportunities Fund            SBI Equity Minimum                                        Access - US Equity FoF
Scheme Name                                                         (Previously known as SBI        (Previously known as SBI
                                                                                                                                                                  SBI Gold Fund                                                SBI Nifty Index Fund
                                             Fund                                                                                    Variance Fund
                                                                           FMCG Fund)                       IT Fund)

Ideal Investment Horizon                    Tactical                          Tactical                       Tactical                    5 years +                    Tactical                           NA                           3 years +

Inception Date                           06/07/2007                      05/07/1999                      05/07/1999                    02/03/2019                   12/09/2011                     22/03/2021                       17/01/2002

                                                                                                                                                                                                                                  Mr. Raviprakash
Fund Manager                          Mrs. Nidhi Chawla                Mr. Saurabh Pant              Mr. Anup Upadhyay           Mr. Raviprakash Sharma       Mr. Raviprakash Sharma              Mr. Mohit Jain
                                                                                                                                                                                                                                      Sharma

Managing Since                             Nov-2018                           Jun-2011                     Jun-2011                     Mar-2019                     Sep-2011                      March-2021                         Feb-2011

                                                                   Nifty India Consumption                                                                                                      S&P 500 Index, after
Benchmark                       Nifty Infrastructure Index (TRI)                                   S&P BSE Teck Index (TRI         Nifty 50 Index (TRI)        Price of Physical Gold       converting it to Indian Rupee       Nifty 50 Index (TRI)
                                                                           Index (TRI)

                                                                                               Fund Details as on 31 May 2021

Month End AUM (Rs. in Crores)             `623.25 Crores                `732.96 Crores                  `742.57 Crores                `90.28 Crores              `1,166.52 Crores                `771.76 Crores                  `1,228.20 Crores

Portfolio Turnover                              0.62                            0.38                          0.16                          1.28                          -                               -                              0.85
                      #
Standard Deviation                            25.71%                           24.51%                        17.94%                           -                           -                               -                                 -
    #
Beta                                            1.03                            1.17                          0.92                            -                           -                               -                                 -
               #
Sharpe Ratio                                    0.40                            0.32                          1.15                            -                           -                               -                                 -

                                          Regular- 2.52%                Regular- 2.51%                  Regular- 2.52%                Regular- 0.72%              Regular- 0.52%,                Regular- 1.63%,                   Regular- 0.49%,
Expense Ratio                              Direct- 1.96%                 Direct- 1.44%                   Direct- 1.34%                 Direct- 0.32%               Direct- 0.10%                  Direct- 0.74%                     Direct- 0.17%
                                                                        Portfolio Classification By Asset Allocation (%) as on 31 May 2021

Large Cap (In %)                                49.35                          26.25                          52.40                         98.24                         -                               -                             97.95

Mid Cap (In %)                                  9.85                           28.44                          13.13                            -                          -                               -                                 -

                                                36.69                          41.12                          12.91                            -                    ETF: 99.97               Overseas Mutual Fund:                          -
Small Cap (In %)
                                                                                                                                                                                                    89.97
Unclassified (%)                                2.40                            1.57                          15.01                           -                           -                    Overseas ETF:6.90                            -

Other Assets (In %)                             1.71                            2.59                           6.55                         1.72                        0.03                            3.13                             2.05

                                                                       Portfolio Classification By Industry Allocation (%) as on 31 May 2021
Portfolio Classification             Industrial                    Consumer Goods        56.37     IT                   85.33    Consumer Goods       24.86   Exchange Traded               Mutual Fund          96.87        Financial Services     37.28
                                     Manufacturing         21.13                                   Cash, Cash Equivalents        Pharma               17.16   Funds                99.97    Cash, Cash Equivalents            IT                     15.82
 By Industry Allocation                                            Consumer Services     14.43
                                     Oil & Gas             18.47                                   And Others             6.55   IT                   13.99   Cash, Cash Equivalents        And Others             3.13
 (%) (Top 10)                                                      Textiles              13.41                                                                                                                                Oil & Gas              11.79
                                     Construction          17.75                                                                 Financial Services   10.86   And Others             0.03
                                                                                                   Telecom               4.87                                                                                                 Consumer Goods         10.80
                                     Services               9.70   Automobile             5.37
                                                                                                   Financial Services    2.04    Power                 7.74                                                                   Automobile              5.22
                                     Cement & Cement
                                     Products               7.72   Telecom                4.74     Media, Entertainment &        Automobile            5.78
                                                                                                                                                                                                                              Metals                  3.56
                                     Telecom                5.86   Cash, Cash Equivalents          Publication           1.21    Metals                4.82
                                                                                                                                                                                                                              Pharma                  3.47
                                     Metals                 5.56   And Others             2.59                                   Oil & Gas             4.10
                                                                                                                                                                                                                              Construction            2.58
                                     Power                  4.37   Services               1.77                                   Telecom               3.10
                                     Automobile             4.01                                                                 Cement & Cement                                                                              Cement & Cement
                                     Financial Services     2.01   Media, Entertainment &                                        Products              2.73                                                                   Products                2.48
                                                                   Publication           1.32                                                                                                                                 Derivatives             2.22

                                                                                                                 Other Details
Exit Load                             Within 30 days - 0.50%            On or Before 30             Within 15 Days - 0.50%       For exit on or before 15 days On or before 15 days - 1%      For exit on or before 1 year     For exit on or before 15 days
                                                                                                                                 from the date of allotment –                                from the date of allotment –      from the date of allotment –
                                      (w.e.f. June 07, 2021)             days - 0.10%                                                                                                                                                       0.5%
                                                                                                                                              0.5%                                                        1.00%                 For exit after 15 days from
                                                                                                                                  For exit after 15 days from                                For exit after 1 year from the     the date of allotment - Nil
                                                                                                                                   the date of allotment - Nil                                  date of allotment – Nil
        Please consult your financial advisor before investing. For details, please refer to respective page of the scheme.#Risk Free rate: FBIL Overnight Mibor rate (3.39% as on 31st May 2021) Basis for
        Ratio Calculation: 3 Years Monthly Data Points. Expense ratio includes GST, Base TER and additional expenses as per regulation 52(6A)(b) and 52(6A)(c) of SEBI (MF) regulations for both Direct and Regular plan                             11
EQUITY-LARGE CAP

                                                              NET ASSET VALUE                                                                 LAST IDCW                                     Face value: `10

                                                              Option                                                            NAV (`)       Record Date                    IDCW (in `/Unit)          NAV (`)

                                                              Reg-Plan-IDCW                                                    30.9089        23-Sep-16 (Reg Plan)                   1.00             18.5964
                                                                                                                                              23-Sep-16 (Dir Plan)                   1.20             21.8569
                                                              Reg-Plan-Growth                                                  54.3318
                                                                                                                                              17-Jul-15 (Reg Plan)                   2.50             17.6880
                                                              Dir-Plan-IDCW                                                    37.9295        17-Jul-15 (Dir Plan)                   2.90             20.5395
                                                              Dir-Plan-Growth                                                  58.4442        21- Mar-14 (Reg Plan)                  1.80             12.7618
    Investment Objective
                                                                                                                                             Pursuant to payment of IDCW, the NAV of IDCW Option of scheme/plans
    To provide investors with opportunities                                                                                                  would fall to the extent of payout and statutory levy, if applicable.
    for long-term growth in capital through
    an active management of investments in a
    diversified basket of large cap equity
    stocks (as specified by SEBI/AMFI from
    time to time).                                                                                                                  PORTFOLIO
                                                                 Stock Name                                        (%) Of Total AUM           Stock Name                                (%) Of Total AUM
    Fund Details                                                 Equity Shares                                                                Hindustan Petroleum Corporation Ltd.                        1.10
• Type of Scheme                                                 HDFC Bank Ltd.                                                    9.27       Kotak Mahindra Bank Ltd.                                    1.08
    An open-ended Equity Scheme                                  ICICI Bank Ltd.                                                   7.15       Sun Pharmaceutical Industries Ltd.                          1.04
    predominantly investing in large cap stocks.                 Infosys Ltd.                                                      5.11       Bharat Petroleum Corporation Ltd.                           1.00
•   Date of Allotment: 14/02/2006                                HCL Technologies Ltd.                                             4.41       Page Industries Ltd.                                        0.96
•   Report As On: 31/05/2021                                     Reliance Industries Ltd.                                          3.98       Britannia Industries Ltd.                                   0.90
•   AAUM for the Month of May 2021                               Larsen & Toubro Ltd.                                              3.93       Maruti Suzuki India Ltd.                                    0.84
    ` 27,181.22 Crores                                           Housing Development Finance Corporation Ltd.                      3.80       Tech Mahindra Ltd.                                          0.82
•   AUM as on May 31, 2021                                       ITC Ltd.                                                          3.52       Thermax Ltd.                                                0.72
    ` 28,241.54 Crores                                           Divi'S Laboratories Ltd.                                          3.46       Indian Oil Corporation Ltd.                                 0.68
•   Fund Manager: Ms. Sohini Andani                              State Bank Of India                                               3.41       Aurobindo Pharma Ltd.                                       0.65
    Managing Since: Sep-2010                                     Motherson Sumi Systems Ltd.                                       2.75       SKF India Ltd.                                              0.57
    Total Experience: Over 23 years                              Shree Cement Ltd.                                                 2.69       PI Industries Ltd.                                          0.56
•   Benchmark: S&P BSE 100 Index (TRI)                           Mahindra & Mahindra Ltd.                                          2.31       Strides Pharma Science Ltd.                                 0.53
•   Exit Load:                                                   Axis Bank Ltd.                                                    2.16       Avenue Supermarts Ltd.                                      0.47
    For exit within 1 year from the date of allotment                                                                                         Mahindra & Mahindra Financial Services Ltd.                 0.46
                                                                 Hindalco Industries Ltd.                                          2.00
    - 1 %; For exit after 1 year from the date of
                                                                 Eicher Motors Ltd.                                                2.00       Coal India Ltd.                                             0.45
    allotment - Nil
                                                                 Bharti Airtel Ltd.                                                2.00       Schaeffler India Ltd.                                       0.37
•   Entry Load: N.A.
                                                                 HDFC Life Insurance Company Ltd.                                  1.94       Nestle India Ltd.                                           0.29
•   Plans Available: Regular, Direct
                                                                 ICICI Prudential Life Insurance Company Ltd.                      1.88       Shriram City Union Finance Ltd.                             0.27
•   Options: Growth, IDCW
                                                                 ICICI Lombard General Insurance Company Ltd.                      1.58       Power Grid Corporation Of India Ltd.                        0.15
•   SIP
    Any Day SIP’ Facility - is available for Monthly,            Cipla Ltd.                                                        1.58       Sadbhav Engineering Ltd.                                    0.07
    Quarterly, Semi-Annual and Annual frequencies                Ultratech Cement Ltd.                                             1.52       Total                                                     96.88
    through electronic mode like OTM / Debit                     Godrej Properties Ltd.                                            1.46       Warrants
    Mandate. Default SIP date will be 10th. In case
                                                                 DLF Ltd.                                                          1.39       HDFC Ltd.(Warrants)                                         0.45
    the SIP due date is a Non Business Day, then the
    immediate following Business Day will be                     Cholamandalam Investment & Finance Co. Ltd.                       1.37       Total                                                       0.45
    considered for SIP processing.                               Bajaj Auto Ltd.                                                   1.33       Non Convertible Debentures
    Daily - Minimum 500 & in multiples of 1                      Crompton Greaves Consumer Electricals Ltd.                        1.27       Britannia Industries Ltd.                                   0.01
    thereafter for a minimum of 12 instalments.
                                                                 Cummins India Ltd.                                                1.23       Total                                                       0.01
    (Kindly refer notice cum addendum dated June
    02, 2020 for further details)                                Hero Motocorp Ltd.                                                1.21       Cash, Cash Equivalents And Others                           2.66
    Weekly - Minimum ` 1000 & in multiples of ` 1                Bharat Electronics Ltd.                                           1.19       Grand Total                                              100.00
    thereafter for a minimum of 6 instalments. (or)
    Minimum 500 & in multiples of 1 thereafter for
    a minimum of 12 instalments.
    Monthly - Minimum ` 1000 & in multiples of ` 1
                                                                            PORTFOLIO CLASSIFICATION BY                                               PORTFOLIO CLASSIFICATION BY
    thereafter for minimum six months (or)                                    INDUSTRY ALLOCATION (%)                                                    ASSET ALLOCATION (%)
    minimum ` 500 & in multiples of ` 1 thereafter
    for minimum one year.                                      Financial Services                                                 34.82
    Quarterly - Minimum ` 1500 & in multiples of `             Automobile                                                         10.44
    1 thereafter for minimum one year.                                                                                                                                   1.44 2.66
                                                               IT                                                                 10.34                           9.03
     Semi Annual - Minimum ` 3000 & in multiples of
    ` 1 thereafter for a minimum of 4 installments.            Pharma                                                              7.26
     Annual - Minimum ` 5000 & in multiples of ` 1             Construction                                                        6.85
    thereafter for a minimum of 4 installments.                Oil & Gas                                                           6.76
•   Minimum Investment                                         Consumer Goods                                                      5.99
    ` 5000 & in multiples of ` 1
                                                               Cement & Cement Products                                            4.21
•   Additional Investment
                                                               Industrial Manufacturing                                            4.08
    ` 1000 & in multiples of ` 1
                                                               Metals                                                              2.45
    Quantitative Data                                          Telecom                                                             2.00                                                 86.86
                              #                                Textiles                                                            0.96
    Standard Deviation                  : 22.81%
        #                                                      Fertilisers & Pesticides                                            0.56
    Beta                                : 1.02                                                                                                                Large Cap      Smallcap    Midcap
                 #                                             Consumer Services                                                   0.47
    Sharpe Ratio                        : 0.47
    Portfolio Turnover*                                        Power                                                               0.15
                                                                                                                                                            Cash, Cash Equivalents, And Others
    Equity Turnover                     : 0.12                 Cash, Cash Equivalents And Others                                   2.66
    Total Turnover                      : 0.13
    Total Turnover = Equity + Debt + Derivatives                                                                                                SBI Blue Chip Fund
    #
      Source: CRISIL Fund Analyser                                                                                           This product is suitable for investors who are seeking^:
    *Portfolio Turnover = lower of total sale or total                                                   • Long term capital appreciation.
    purchase for the last 12 months (including equity
    derivatives) upon Avg. AUM of trailing twelve months.                                                • Investment in equity and equity-related instruments of large cap companies.
    Risk Free rate: FBIL Overnight Mibor rate (3.39% as on
                                                             Investors understand that their principal   ^Investors should consult their financial advisers if in doubt about whether the product is suitable
    31st May 2021) Basis for Ratio Calculation: 3 Years
    Monthly Data Points                                              will be at Very High risk           for them.
    Ratios are computed using Total Return Index (TRI) as
    per SEBI Circular dated Jan 4, 2018
                                                                                                                                                                                                             12
EQUITY- THEMATIC FUND

                                                              NET ASSET VALUE                                                                LAST IDCW                                   Face value: `10

                                                              Option                                                           NAV (`)       Record Date                   IDCW (in `/Unit)         NAV (`)

                                                              Reg-Plan-IDCW                                                   44.6127        16-Mar-18 (Reg Plan)                 3.40             29.0857
                                                                                                                                             16-Mar-18 (Dir Plan)                 4.00             34.6356
                                                              Reg-Plan-Growth                                                142.6511
                                                                                                                                             30-May-17 (Reg Plan)                 2.00             30.8936
         (Previously known as SBI Magnum Equity Fund)         Dir-Plan-IDCW                                                   54.6187        30-May-17 (Dir Plan)                 2.50             36.5027
                                                              Dir-Plan-Growth                                                152.1407        29-Apr-16 (Reg Plan)                 4.50             27.4893
                                                                                                                                             29-Apr-16 (Dir Plan)                 5.00             32.3240
    Investment Objective                                                                                                                     24-Apr-15 (Reg Plan)                 6.00             31.7479
                                                             Pursuant to payment of IDCW, the NAV of IDCW Option of scheme/plans
                                                             would fall to the extent of payout and statutory levy, if applicable.           24-Apr-15 (Dir Plan)                 7.00             36.7592
    To provide investors with opportunities
    for long-term growth in capital through
    an active management of investments in a                                                                                       PORTFOLIO
    diversified basket of companies following
    Environmental, Social and Governance                       Stock Name           (%) Of Total AUM % of AUM Derivatives                    Stock Name            (%) Of Total AUM % of AUM Derivatives
    (ESG) criteria.                                            Equity Shares                                                                 Info Edge (India) Ltd.                1.22               -
                                                               Infosys Ltd.                         6.79               -                     Power Grid Corporation
    Fund Details                                               HDFC Bank Ltd.                       6.47               -                     Of India Ltd.                         1.20               -
                                                               ICICI Bank Ltd.                      4.77               -                     PVR Ltd.                              1.19               -
• Type of Scheme
                                                               Tata Consultancy Services Ltd.       4.21               -                     HCL Technologies Ltd.                 1.19               -
    An open-ended Equity Scheme investing in
                                                               Larsen & Toubro Ltd.                 3.13               -                     Bharat Forge Ltd.                     1.18               -
    companies following the ESG theme.
                                                               Axis Bank Ltd.                       3.00               -                     Hindalco Industries Ltd.              1.16               -
•   Date of Allotment: 01/01/1991
                                                               Tata Motors Ltd.                     2.89               -                     Wipro Ltd.                            1.15               -
•   Report As On: 31/05/2021
•   AAUM for the Month of May 2021                             Ultratech Cement Ltd.                2.86               -                     ICICI Prudential Life Insurance
    ` 3,614.08 Crores                                          Page Industries Ltd.                 2.86               -                     Company Ltd.                          1.04               -
•   AUM as on May 31, 2021                                     Bharti Airtel Ltd.                   2.85               -                     Lupin Ltd.                            0.98               -
    ` 3,771.06 Crores                                          Divi's Laboratories Ltd.             2.80               -                     Tech Mahindra Ltd.                    0.93               -
•   Fund Manager: Mr. Ruchit Mehta                             State Bank Of India                  2.72               -                     HDFC Life Insurance Company Ltd. 0.89                    -
    Managing Since: May-2018                                   Bajaj Finance Ltd.                   2.55               -                     SBI Cards & Payment Services Ltd. 0.84                   -
    Total Experience: Over 14 years                            Tata Steel Ltd.                      2.40          (2.36)                     Total                                 93.79         (2.36)
•   Benchmark: Nifty 100 ESG Index (TRI)                       HDFC Ltd.                            2.38               -                     Foreign Equity shares
•   Exit Load:                                                 Titan Company Ltd.                   2.34               -                     Nvidia Corporation                    2.14               -
    For exit within 1 year from the date of allotment          Kotak Mahindra Bank Ltd.             2.17               -                     Microsoft Corporation                 0.97               -
    - 1 %;
                                                               Bharat Petroleum Corporation Ltd. 2.00                  -                     Total                                 3.11               -
    For exit after 1 year from the date of allotment -
                                                               Britannia Industries Ltd.            1.84               -                     Non Convertible Debentures
    Nil
                                                               SBI Life Insurance Company Ltd.      1.82               -                     Britannia Industries Ltd.             0.02               -
•   Entry Load: N.A.
•   Plans Available: Regular, Direct                           ABB India Ltd.                       1.78               -                     Total                                 0.02               -
•   Options: Growth, IDCW                                      Reliance Industries Ltd.             1.73               -                     Cash, Cash Equivalents
•   SIP                                                        Jubilant Foodworks Ltd.              1.59               -                     And Others                            5.44               -
    Any Day SIP’ Facility - is available for Monthly,          TVS Motor Company Ltd.               1.56               -                     Grand Total                          100.00
    Quarterly, Semi-Annual and Annual frequencies              Cipla Ltd.                           1.52               -
    through electronic mode like OTM / Debit                   Maruti Suzuki India Ltd.             1.51               -
    Mandate. Default SIP date will be 10th. In case            Cummins India Ltd.                   1.47               -
    the SIP due date is a Non Business Day, then the           L&T Technology Services Ltd.         1.45               -
    immediate following Business Day will be                   Colgate Palmolive (India) Ltd.       1.38               -
    considered for SIP processing.
                                                               ICICI Lombard General Insurance
    Daily - Minimum 500 & in multiples of 1
                                                               Company Ltd.                         1.37               -
    thereafter for a minimum of 12 instalments.
                                                               Interglobe Aviation Ltd.             1.36               -
    (Kindly refer notice cum addendum dated June
    02, 2020 for further details)                              Avenue Supermarts Ltd.               1.25               -
    Weekly - Minimum ` 1000 & in multiples of ` 1
    thereafter for a minimum of 6 instalments. (or)
    Minimum 500 & in multiples of 1 thereafter for                          PORTFOLIO CLASSIFICATION BY                                               PORTFOLIO CLASSIFICATION BY
    a minimum of 12 instalments.
    Monthly - Minimum ` 1000 & in multiples of ` 1                            INDUSTRY ALLOCATION (%)                                                    ASSET ALLOCATION (%)
    thereafter for minimum six months (or)
    minimum ` 500 & in multiples of ` 1 thereafter              Financial Services                                               30.02
    for minimum one year.                                       IT                                                               18.83
    Quarterly - Minimum ` 1500 & in multiples of `              Automobile                                                        5.96                             -2.36 5.44
                                                                Consumer Goods                                                    5.58                            3.11
    1 thereafter for minimum one year.
                                                                                                                                                               1.19
     Semi Annual - Minimum ` 3000 & in multiples of             Pharma                                                            5.30
    ` 1 thereafter for a minimum of 4 installments.             Industrial Manufacturing                                          4.43                     10.30
•    Annual - Minimum ` 5000 & in multiples of ` 1              Consumer Services                                                 4.06
    thereafter for a minimum of 4 installments.                 Oil & Gas                                                         3.73
•   Minimum Investment                                          Metals                                                            3.56
    ` 1000 & in multiples of ` 1                                Construction                                                      3.13
•   Additional Investment                                       Textiles                                                          2.86
    ` 1000 & in multiples of ` 1                                Cement & Cement Products                                          2.86                                                   82.30
                                                                Telecom                                                           2.85
                                                                Services                                                          1.36
    Quantitative Data
                                                                Power                                                             1.20
                                                                Media, Entertainment & Publication                                1.19                Large Cap    Smallcap     Midcap   Unclassified
    Standard Deviation#                  : 21.71%
                                                                Derivatives                                                      -2.36
    Beta#                                : 1.00
                                                                Cash, Cash Equivalents And Others                                 5.44              Cash, Cash Equivalents, And Others      Derivatives
    Sharpe Ratio#                        : 0.53
    Portfolio Turnover*
    Equity Turnover                      : 0.48                                                                                          SBI Magnum Equity ESG Fund
                                                                                                                            This product is suitable for investors who are seeking^:
    Total Turnover                       : 0.75
    Total Turnover = Equity + Debt + Derivatives                                                         • Long term capital appreciation.
    #
      Source: CRISIL Fund Analyser                                                                       • Investments in companies following the ESG theme.
    *Portfolio Turnover = lower of total sale or total
    purchase for the last 12 months (including equity                                                    ^Investors should consult their financial advisers if in doubt about whether the product is suitable
                                                             Investors understand that their principal
    derivatives) upon Avg. AUM of trailing twelve months.                                                for them.
                                                                     will be at Very High risk
    Risk Free rate: FBIL Overnight Mibor rate (3.39% as on
    31st May 2021) Basis for Ratio Calculation: 3 Years
    Monthly Data Points
    Ratios are computed using Total Return Index (TRI) as
    per SEBI Circular dated Jan 4, 2018                                                                                                                                                                   13
EQUITY-FLEXICAP FUND

                                                           NET ASSET VALUE                                                               LAST IDCW                                   Face value: `10

                                                           Option                                                          NAV (`)       Record Date                    IDCW (in `/Unit)        NAV (`)

                                                           Reg-Plan-IDCW                                                  30.1902        09-Mar-18 (Reg Plan)                 1.90              20.5230

                                                           Reg-Plan-Growth                                                67.4221        09-Mar-18 (Dir Plan)                 2.20              23.9106
                                                                                                                                         29-Dec-17 (Reg Plan)                 2.50              23.8257
                                                           Dir-Plan-IDCW                                                  36.3015
                                                                                                                                         29-Dec-17 (Dir Plan)                 2.90              27.6830
                                                           Dir-Plan-Growth                                                72.6278        30-Dec-16 (Reg Plan)                 1.90              19.2173
 Investment Objective                                                                                                                    30-Dec-16 (Dir Plan)                 2.20              22.0670
                                                          Pursuant to payment of IDCW, the NAV of IDCW Option of scheme/plans
To provide investors with opportunities for long-         would fall to the extent of payout and statutory levy, if applicable.
term growth in capital along with the liquidity of an
open-ended scheme through an active management
of investments in a diversified basket of equity                                                                               PORTFOLIO
stocks spanning the entire market capitalization
                                                              Stock Name                                      (%) Of Total AUM            Stock Name                              (%) Of Total AUM
spectrum and in debt and money market
instruments. However, there is no guarantee or                Equity Shares                                                               Muthoot Finance Ltd.                                    1.32
assurance that the investment objective of the                HDFC Bank Ltd.                                                   8.33       Page Industries Ltd.                                    1.28
scheme will be achieved.                                      ICICI Bank Ltd.                                                  7.99       Bharat Forge Ltd.                                       1.15
 Fund Details                                                 HCL Technologies Ltd.                                            4.44       Camlin Fine Sciences Ltd.                               1.13
                                                              Axis Bank Ltd.                                                   3.54       SBI Cards & Payment Services Ltd.                       1.06
• Type of Scheme
 An open-ended Dynamic Equity Scheme                          Hindalco Industries Ltd.                                         3.46       City Union Bank Ltd.                                    1.06
 investing across large cap, mid cap, small cap               State Bank Of India                                              3.30       Sheela Foam Ltd.                                        1.05
 stocks.
                                                              Tech Mahindra Ltd.                                               3.08       WABCO India Ltd.                                        1.00
• Date of Allotment: 29/09/2005
                                                              Larsen & Toubro Ltd.                                             3.03       Interglobe Aviation Ltd.                                1.00
• Report As On: 31/05/2021
                                                              Infosys Ltd.                                                     2.90       TVS Motor Company Ltd.                                  0.99
• AAUM for the Month of May 2021
 ` 12,618.43 Crores                                           Crompton Greaves Consumer Electricals Ltd.                       2.84       SRF Ltd.                                                0.99
• AUM as on May 31, 2021                                      ITC Ltd.                                                         2.71       Prism Johnson Ltd.                                      0.99
 ` 13,368.10 Crores                                           Gail (India) Ltd.                                                2.61       Power Grid Corporation Of India Ltd.                    0.95
• Fund Manager: Mr. Anup Upadhyay                             Bharat Petroleum Corporation Ltd.                                2.52       Cholamandalam Investment & Finance Co. Ltd.             0.95
 Managing Since: Feb-2017
                                                              Cipla Ltd.                                                       2.25       AIA Engineering Ltd.                                    0.95
 Total Experience: Over 13 years
                                                              Bharti Airtel Ltd.                                               2.25       PVR Ltd.                                                0.94
• Benchmark: S&P BSE 500 Index (TRI)

• Exit Load: For exit on or before 30 days from
                                                              ICICI Prudential Life Insurance Company Ltd.                     2.01       Narayana Hrudayalaya Ltd.                               0.89
 the date of allotment - 0.10%                                Emami Ltd.                                                       1.98       Star Cement Ltd.                                        0.83
 For exit after 30 days from the date of allotment-
                                                              The Indian Hotels Company Ltd.                                   1.90       Computer Age Management Services Ltd.                   0.69
 Nil
                                                              Divi'S Laboratories Ltd.                                         1.88       Gujarat State Petronet Ltd.                             0.64
• Entry Load: N.A.
                                                              Ultratech Cement Ltd.                                            1.72       Container Corporation Of India Ltd.                     0.43
• Plans Available: Regular, Direct
                                                              Carborundum Universal Ltd.                                       1.55       Relaxo Footwears Ltd.                                   0.21
• Options; Growth, IDCW

• SIP
                                                              TTK Prestige Ltd.                                                1.54       Total                                                  94.12
 Any Day SIP’ Facility - is available for Monthly,            Reliance Industries Ltd.                                         1.51       Cash, Cash Equivalents And Others                       5.88
 Quarterly, Semi-Annual and Annual frequencies
 through electronic mode like OTM / Debit                     Rossari Biotech Ltd.                                             1.49       Grand Total                                          100.00
 Mandate. Default SIP date will be 10th. In case              Indian Oil Corporation Ltd.                                      1.44
 the SIP due date is a Non Business Day, then the
 immediate following Business Day will be                     Maruti Suzuki India Ltd.                                         1.35
 considered for SIP processing.
 Daily - Minimum 500 & in multiples of 1
 thereafter for a minimum of 12 instalments.
 (Kindly refer notice cum addendum dated June                            PORTFOLIO CLASSIFICATION BY                                              PORTFOLIO CLASSIFICATION BY
 02, 2020 for further details)
 Weekly - Minimum ` 1000 & in multiples of ` 1                             INDUSTRY ALLOCATION (%)                                                   ASSET ALLOCATION (%)
 thereafter for a minimum of 6 instalments. (or)             Financial Services                                               30.25
 Minimum 500 & in multiples of 1 thereafter for a
 minimum of 12 instalments.                                  IT                                                               10.42
 Monthly - Minimum ` 1000 & in multiples of ` 1              Consumer Goods                                                   10.33                                 5.88
 thereafter for minimum six months (or)                      Oil & Gas                                                         8.72
 minimum ` 500 & in multiples of ` 1 thereafter              Pharma                                                            4.13                       11.10
 for minimum one year.                                       Industrial Manufacturing                                          3.65
 Quarterly - Minimum ` 1500 & in multiples of ` 1
                                                             Chemicals                                                         3.61
 thereafter for minimum one year.
 Semi Annual - Minimum ` 3000 & in multiples of              Cement & Cement Products                                          3.54
 ` 1 thereafter for a minimum of 4 installments.             Metals                                                            3.46                  16.37
 Annual - Minimum ` 5000 & in multiples of ` 1               Automobile                                                        3.34
 thereafter for a minimum of 4 installments.                 Construction                                                      3.03                                                   66.65
• Minimum Investment                                         Telecom                                                           2.25
 ` 1000 & in multiples of ` 1                                Consumer Services                                                 1.90
                                                             Services                                                          1.43
• Additional Investment
                                                             Textiles                                                          1.28
 ` 1000 & in multiples of ` 1
                                                             Power                                                             0.95
                                                                                                                                                          Large Cap    Smallcap    Midcap
 Quantitative Data                                           Media, Entertainment & Publication                                0.94
                                                             Healthcare Services                                               0.89
                       #                                                                                                                                Cash, Cash Equivalents, And Others
 Standard Deviation                  : 22.54%                Cash, Cash Equivalents And Others                                 5.88
 Beta#                               : 0.97
 Sharpe Ratio#                       : 0.49                                                                                                   SBI Flexicap Fund
 Portfolio Turnover*                                                                                                     This product is suitable for investors who are seeking^:
 Equity Turnover                     : 0.53
 Total Turnover                      : 0.54                                                           • Long term capital appreciation.
 Total Turnover = Equity + Debt + Derivatives                                                         • Investments in a diversified basket of equity stocks spanning the entire market capitalization
 #
   Source: CRISIL Fund Analyser                                                                         spectrum to provide both long-term growth opportunities and liquidity
 *Portfolio Turnover = lower of total sale or total       Investors understand that their principal   ^Investors should consult their financial advisers if in doubt about whether the product is suitable
 purchase for the last 12 months (including equity                will be at Very High risk           for them.
 derivatives) upon Avg. AUM of trailing twelve months.
 Risk Free rate: FBIL Overnight Mibor rate (3.39% as on
 31st May 2021) Basis for Ratio Calculation: 3 Years
 Monthly Data Points
 Ratios are computed using Total Return Index (TRI) as
 per SEBI Circular dated Jan 4, 2018
                                                                                                                                                                                                      14
You can also read