Investor Presentation - 2019 FULL YEAR RESULTS - GTT
←
→
Page content transcription
If your browser does not render page correctly, please read the page content below

Investor Presentation

    2019 FULL YEAR RESULTS

          28 February 2020
Disclaimer

      This document is strictly confidential. Any unauthorised access to,
      appropriation of, copying, modification, use or disclosure thereof, in
      whole or in part, by any means, for any purpose, infringes GTT’s
      rights. This document is part of GTT’s proprietary know-how and
      may contain trade secrets protected worldwide by TRIPS and EU
      Directives against their unlawful acquisition, use and disclosure. It is
      also protected by Copyright law. The production, offering or placing
      on the market of, the importation, export or storage of goods or
      services using GTT’s trade secrets or know-how is subject to GTT’s
      prior written consent. Any violation of these obligations may give rise
      to civil or criminal liability. © GTT, 2010-2020

                                                                                 2
Disclaimer

This presentation does not contain or constitute an offer of securities for sale or an invitation or inducement to invest in securities in France, the
United States or any other jurisdiction.
It includes only summary information and does not purport to be comprehensive. No representation, warranty or undertaking, express or
implied, is made as to, and no reliance should be placed on, the accuracy, completeness or correctness of the information or opinions contained
in this presentation. None of GTT or any of its affiliates, directors, officers and employees shall bear any liability (in negligence or otherwise) for
any loss arising from any use of this presentation or its contents.
The market data and certain industry forecasts included in this presentation were obtained from internal surveys, estimates, reports and studies,
where appropriate, as well as external market research, including Poten & Partners, Wood Mackenzie and Clarkson Research Services Limited,
publicly available information and industry publications. GTT, its affiliates, shareholders, directors, officers, advisors and employees have not
independently verified the accuracy of any such market data and industry forecasts and make no representations or warranties in relation
thereto. Such data and forecasts are included herein for information purposes only. Where referenced, as regards the information and data
contained in this presentation provided by Clarksons Research and taken from Clarksons Research’s database and other sources, Clarksons
Research has advised that: (i) some information in the databases is derived from estimates or subjective judgments; (ii) the information in the
databases of other maritime data collection agencies may differ from the information in Clarksons Research database; (iii) while Clarksons
Research has taken reasonable care in the compilation of the statistical and graphical information and believes it to be accurate and correct,
data compilation is subject to limited audit and validation procedures.
Any forward-looking statements contained herein are based on current GTT’s expectations, beliefs, objectives, assumptions and projections
regarding present and future business strategies and the distribution environment in which GTT operates, and any other matters that are not
historical fact. Forward-looking statements are not guarantees of future performances and are subject to various risks, uncertainties and other
factors, many of which are difficult to predict and generally beyond the control of GTT and its shareholders. Actual results, performance or
achievements, or industry results or other events, could materially differ from those expressed in, or implied or projected by, these forward-
looking statements. For a detailed description of these risks and uncertainties, please refer to the section “Risk Factors” of the Document de
Référence (“Registration Document”) registered by GTT with the Autorité des Marchés Financiers (“AMF”) on April 30, 2019 and the half-yearly
financial report released on July 25, 2019, which are available on the AMF’s website at www.amf-france.org and on GTT’s website at www.gtt.fr.
The forward-looking statements contained in this presentation are made as at the date of this presentation, unless another time is specified in
relation to them. GTT disclaims any intent or obligation to update any forward-looking statements contained in this presentation.

                                                                                                                                                          3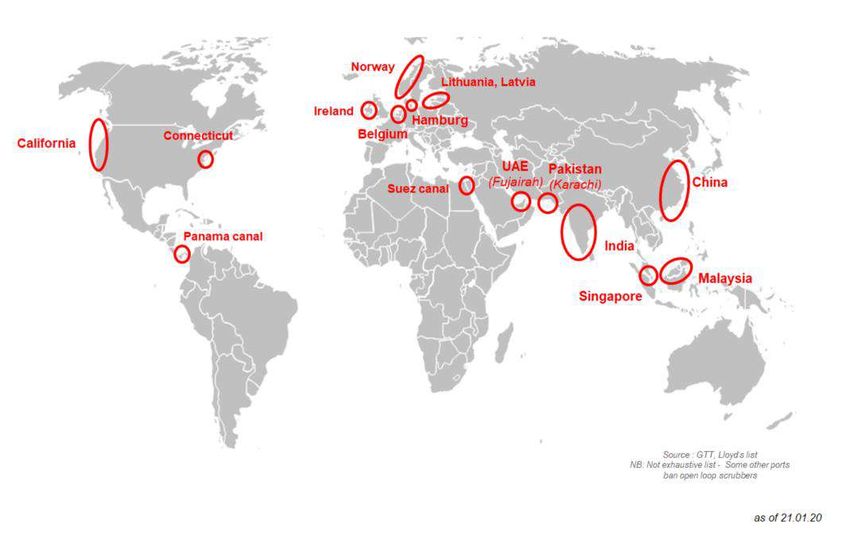
Agenda

 1. Company overview & key highlights

 2. Core business: Market & Activity update

 3. New businesses: LNG Fuel developments

 4. Service activity

 5. Strategic roadmap

 6. Financials

 7. Outlook

 Appendices

                                              4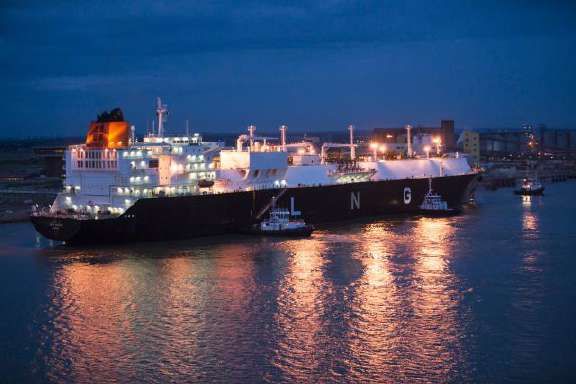
1
Company overview
   & Key highlights

                      5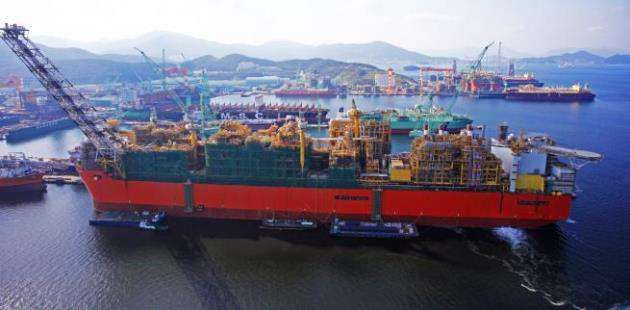
GTT at a glance

Profile
   A French technology and engineering                                                                    Consolidated key figures
   company with more than 50-year track
   record
                                                                                        in € million                          FY 2019
   Expert in liquefied gas containment systems
   GTT is a public company listed on the                                                Total Revenues                         288

   Euronext Stock Exchange (Paris),                                                      Royalties (newbuild)                  273
                                                                                         Services                              15
   compartment A                                                                        Net Income                             143
   405 highly qualified people(1)

Activities
  Designs and licenses membrane
  technologies for containment of liquefied gas
     Core business: LNG transportation and storage
     New business: LNG as fuel for vessel propulsion
   Provides design studies, construction
   assistance and innovative services

                                                                                                                      © GTT             © Engie

             (1) As at December 31, 2019- GTT SA / Excluding interns and apprentices. 456 employees at Group level.                               6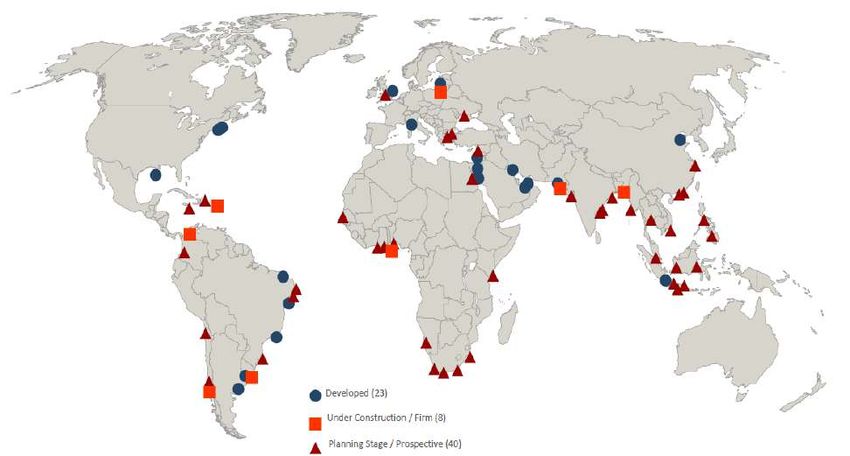
GTT, a green stock

    GTT’s activities are mainly driven by environmental aspects

                Core business
                    Business model: pure technology and engineering company,
                    no direct emissions
                    Technology: improved performance of LNG carriers with a reduction
                    of the level of LNGC CO2 emissions by 43% over the last 10 years
                    LNG demand: mainly driven by Asian countries, progressively
                    substituting coal to gas for power generation

                LNG as Fuel
                    CO2 emissions: -25% compared to HFO (currently 3% of global
                    emissions)
                    No Sox, low Nox, no particulates

                Digital
                    Solutions / softwares / sensors to improve efficiency of vessels and
                    contribute to the reduction of vessels global emissions

                                                                                           7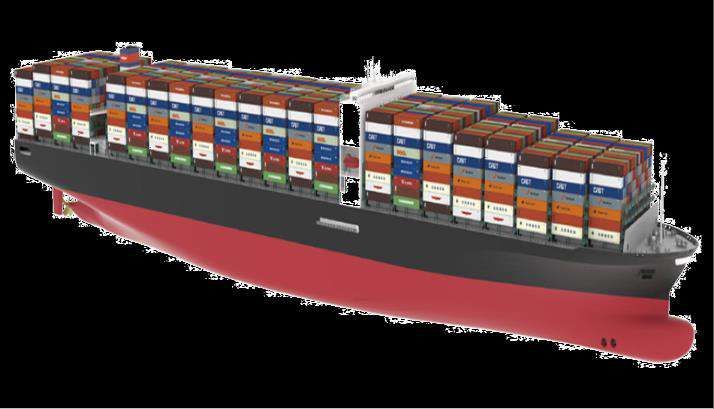
2019 Key Highlights

Strong level of new orders, covering the full value chain
   57 LNGC, 6 VLEC and 3 GBS

New commercial successes in LNG Fuel business including:
   2 bunker ships, 1 container ship converted to LNG on behalf of Hapag Lloyd,
   5 container ships on behalf of a European ship-owner

New TALA with Chinese shipyard WISON Offshore & Marine

Technology
  "LNG Cargo Ready" rating from American Bureau of Shipping for GTT’s latest VLEC model
  Approval in principle from Bureau Veritas for icebreakers using Mark III Flex and N096 L03+ technology
  Joint agreement between GTT, Lloyd’s Register and several partners for the design of a VLCC using LNG as fuel
  New name of GTT’s latest technology: GTT NEXT1 (formerly NO96 Flex)

February 2020: acquisition of Marorka, an expert in Smart Shipping
Proposed dividend up 4% to €3.25 per share, payout of 84%

    Notes: LNGC – Liquefied Natural Gas Carrier, VLEC – Very Large Ethane Carrier, FLNG – Floating Liquefied Natural Gas , GBS – Gravity Based Structures, VLCC – Very large Crude Carrier   8
2
          Core business:
Market & activity update

                           9
Core Business as at December 31, 2019
A strong order book

                                                                                                 FY 2019 movements
                                                                                                            57 LNGC
                                                                                               new orders    6 VLEC
                                                                                                             3 GBS

                                                                                               deliveries   27 LNGC
                                                                           © Shell
                                                                                                             3 FSRU

       Order book of 133 units

        LNGC
        VLEC
        FSRU
        FLNG
        Onshore storage / GBS
    Notes: LNGC – Liquefied Natural Gas Carrier, VLEC – Very Large Ethane Carrier,                                    © SCF Group
    FSRU – Floating Storage and Regasification Unit, FLNG – Floating Liquefied Natural Gas ,
    GBS – Gravity Based Structure
                                                                                                                                    10
Overall long term outlook bright for gas and LNG
Gas share in the energy mix LNG to lead gas trade growth (bcm)
100%
11%
17%
Trade Trade
31% 36%
80%
60%
Oil +1,500 cbm
Gas
40%
Coal
Renewables 20%
Hydro
0%
Nuclear 2018 2040
Gas consumed locally Pipe LNG
Gas is the only fossil energy to increase share in Gas is increasingly exported thanks to LNG
the energy mix LNG expected to exceed inter regional
Gas is expected to exceed coal by 2025, and could pipeline trade in the late 2020’s
become 1st source of energy in the early 2040’s
Driver: greater flexibility, availability, price.
Gas and renewables will account for 85% of energy
demand growth
Drivers: environmental properties, price
and availability
11
Source: Evolving transition scenario, BP 2019 outlook, Source: BP Energy outlook 2019BP alternative scenarios all point to a prominent share of
gas in the energy mix
4 scenarios considered by BP Gas is central in all 4 scenarios
5,8
4,6 4,3
3,2 4,3
Whatever the scenario, gas grows and
BP considers 4 scenarios with common ranks as one of 2 leading energies
features, such as ongoing economic growth Gas demand grows between 37% (Less
and a shift towards a lowercarbon fuel mix, Globalization scenario) and 83% (More Energy)
but differ in terms of policy, technology or Gas share in the energy mix is estimated by
behavioural assumptions. BP between 25% and 27% in 2040 in all
scenarios (vs 23% today)
Source: BP 2019 outlook, GTT Gas position is central in energy transition12LNG Supply & Demand: new capacity needed
LNG Supply & Demand balance forecast
700
600
250 Mtpa
500
400
Mtpa
300
200
100
0
2003
2011
2019
2000
2001
2002
2004
2005
2006
2007
2008
2009
2010
2012
2013
2014
2015
2016
2017
2018
2020
2021
2022
2023
2024
2025
2026
2027
2028
2029
2030
2031
2032
2033
2034
2035
Supply - Operationnal Supply - Under Construction Demand
Sources: Wood Mackenzie Q4 2019 ; GTT Analysis.
NB: NLNG T7 (FID in Dec 19) taken into account
Supply/Demand balanced until end 2024
More FIDs expected as Supply/Demand gap widens to reach
around 250 Mtpa by 2035
13
NB: Methodology change from Wood Mackenzie: LNG consumed by vessel is now included in supply and demandLiquefaction projects: record FIDs in 2019
Volume Exp
Project Country Operator Comments
(Mtpa) Startup
Golden Pass US Exxon, QP 15.6 2025
Sabine Pass T6 US Cheniere 4.5 2023 Cheniere has now 36 Mtpa capacity at Sabine Pass and Corpus Christi
FID taken Mozambique LNG-1 Mozambique Anadarko 12.9 2024 Ownership transfered to Total
in 2019 Calcasieu Pass US Venture Global 10 2023 18 modularized trains
Arctic LNG-2 Russia Novatek 19.8 2023 3 GBS ordered, at least 15 ice class LNG carriers required
NLNG T7 Nigeria NNPC 7.6 2024 1 new train of 4.2 Mtpa + 3.4 Mtpa debottlenecking
Mozambique LNG-4 Mozambique Exxon 15.2 EPC contractor chosen; $500 mln to be spent on initial construction phase
Corpus Christi Stage III US Cheniere 9.5 2 Feedgas contract signed with Apache and EOG
Port Arthur US Sempra 11 SPA of 2Mtpa with PGNiG + HoA of 5 Mtpa signed with Saudi Aramco
Cameron expansion US Sempra 5
Freeport T4 US Freeport 5.1
Possible FIDs Lake Charles US Energy Transfer 16 2 SPA totalling 3 Mtpa signed with Shell
Plaquemines US Venture Global 10 2.5 Mtpa signed with PGNiG
Woodfibre Canada Pacific O&G 2.1 SPA signed with BP in June 2019 for 0.75 Mtpa
Tortue Phase 2 Senegal/Mauritania BP 2.4
Pluto expansion Australia Woodside 4.7
Qatar LNG expansion Qatar QP Up to 49 16 Mtpa (2 trains of 8 mtpa) have been added to the 33 Mtpa extension project
Source: GTT, Wood Mackenzie
71 Mtpa sanctioned in 2019, an all time record.
45 Mtpa in 2004 was the previous record (mainly thanks to Qatar FID)
6 FIDS have been taken
3 are equity projects : Golden Pass, Arctic LNG-2, NLNG T7
3 are SPA based projects : Mozambique LNG-1, Calcasieu, Sabine Pass T6
1485 more LNGCs required for liquefaction projects under
construction
LNGCs supply demand balance of Under Construction liquefaction plants
Contracted
Forecasted
Project Location Capacity LNGCs requirement
Start-Up
(mtpa)
Cameron T3 US East 2020 4,0
Freeport Train 3 US East 2020 4,6
PFLNG 2 Asia Pacific 2021 1,4
Corpus Christi T3 US East 2022 4,5
Tangguh Phase 2 Asia Pacific 2022 4,5
Calcasieu Pass US East 2023 8,0
Coral FLNG East Africa 2023 3,4
TortueFLNG West Africa 2023 2,4
Arctic LNG-2 Russia 2023 19,8
Sabine Pass T6 US East 2023 4,5
LNG Canada Canada West 2024 14,0
Mozambique LNG (Area 1) East Africa 2024 11,2
NLNG T7+expansion West Africa 2024 8,0
Golden Pass US East 2025 15,6
TOTAL 172
- Current Orderbook 80
- Available vessels in operation 7
Expected orders 85 Source: GTT
Market still requires 85 more LNGCs for contracted supply of LNG plants under construction
Expected additional FIDs and fleet replacement could increase that number
15Contracted LNG price remain steady despite low spot
price environment
LNG spot & contracted prices
12
10
Oil linked Asian Price
Contracted price
8
US LNG price delivered in Asia
$/Mmbtu
6
Spot price
Asian
4
LNG
European
2
LNG
0
Contracted oil linked Asian LNG price = JCC * 13% + 0,5$ Sources: Argus, EIA, Wood Mackenzie,
Contracted US LNG price delivered in Asia = Henry Hub * 1,15 + 2,25$ + 1,43$
Mild winter and Coronavirus have pushed LNG spot prices to record low
Below $3/Mmbtu in Asia and below $2,5/Mmbtu in mid-February
Henry Hub is also below $2 Mmbtu
Contracted LNG prices are not affected by spot market fluctuations
LNG projects financing is based on contracted price expectations
Contracted US LNG is competitive in Asia (even with 25% tariff) 162019 Global LNG demand increasing
Global LNG demand: +12.5% in 2019
China continues to be among top 3
+14% or 6 Mtpa
South Asia (India, Pakistan, Bengladesh)
+19% in 2019
Japan and Korea decreasing due to nuclear restart
Europe increasing (UK and France, Spain, Netherlands)
17China expected to remain a dominant region
China LNG demand by 2030
33% 46% 41%
Efforts continue to improve 100 25%
urban air quality
80 20%
Sustained long term growth
expected by 2030 60 15%
5,8
4,6 4,3
3,2 4,3
40 10%
5 importing terminals under
construction + 11 expansions
planned at existing terminals 20 5%
0 0%
2015
2020
2012
2013
2014
2016
2017
2018
2019
2021
2022
2023
2024
2025
2026
2027
2028
2029
2030
LNG demand in China Annual growth
Source: Wood Mackenzie
18China’s choice to widely consume LNG
has significantly reduced its CO2 emissions
In 2019, China has consumed 61 million tons of LNG
it consumed less than 10 million tons 10 years ago
LNG share in Chinese energy mix
2,0%
By choosing LNG, instead of building new generation
coal plants, China has saved more 1,5%
than 200 million tons of CO2 during 2019
Equivalent to total Netherlands CO2 emissions in 2019 1,0%
0,5%
When China reduces its coal consumption by 1%
and uses LNG instead, it reduces CO2 emissions 0,0%
2011 2012 2013 2014 2015 2016 2017 2018
by more than 60 million tons Source: BP Statistical Review
Equivalent to total Austria CO2 emissions in 2019
19
Main Sources: GTT, Clarksons, Wood Mackenzie, Sims, et al., 2007, Centre for Research on Energy and Clean Air, BP Statistical ReviewGTT supports CO2 emissions reductions thanks to
continuous improvements of its systems
Comparison of 2 typical LNG carriers in 2010 (Steam Turbine) and 2020 (MEGI/XDF)
CO2 saved
Engine type LNG tank Boil Off Size Consumption per cbm
transported*
Steam Turbine Mark III 0,15% 145k cbm 110t/d -
MEGI / XDF Mark III Flex+ 0,07% 174k cbm 75t/d 43%
The 2010s have seen major evolutions leading to reduction of LNGC CO2 emissions
Lower Boil off: GTT new products : Mark III Flex, Mark III Flex+, NO 96GW, NO 96+
Engine improvements : DFDE and then MEGI/XDF
Greater capacities: 145k cbm to today’s 174k cbm standard
The 188 modern vessels delivered since 2010 (58 MEGI/XDF and 130 DFDE) save
more than 5 million tons CO2 every year vs 2010 Steam Turbine vessels
2030 IMO objective of 40% reduction of CO2 per ton transported vs 2008
is already achieved thanks to continuous improvements since 2010.
20
Source: GTT, Clarksons * CO2 saved per cbm transported vs 2010 Steam turbine vesselCore business long term estimates
GTT FY 2019 Sales GTT order estimates over 2020-2029
Other
Services LNGC: between 285 and 315 units(1)
LNG Fuel 1%
5%
FLNG 3%
2%
VLEC: between 25 and 40 units
FSRU
9%
FSRU: between 10 and 20 units
LNGC
FLNG: Up to 5 units
80%
Onshore and GBS tanks: between 15 and
20 units
Courtesy of Shell Courtesy of Excelerate Energy
(1) Including replacement market
213.2 3
New businesses:
LNG Fuel developments
22New Business (LNG as Fuel) as at December 31, 2019
A growing order book
© SCF Group © GTT
© GTT
Order book of 19 units FY 2019 movements
ULCS (Ultra Large Container Ships) new orders 2 LNG Bunker ship
Container vessel (converted to LNG) 1 Container vessel
5 ULCS
Cruise ship
LNG bunker ships
23LNG is the only mature solution allowing
comprehensive environmental compliance
Comparison of emissions by fuel type
1
0,75
HFO
Base 1
0,5 HFO+ Scrubber
LSHFO
LNG
0,25
0
SOX NOX CO2 Particulates Source : DNV
LNG is in advance of existing and anticipated environmental regulations
No SOx, no particulates, low NOx, reduced CO2 emissions
Implementation in January 2021 of NOx reduction in North Sea and Baltic sea
will further degrade oil fuel’s and Scrubber’s competitiveness
24Business case is very favorable to LNG as fuel for large
containerships
NPV of LNG fuel vs scrubbers and LSHFO for a 14k TEU containership
50
40
30
20
M$
10
0
-10
-20
2022 Year 2 Year 3 Year 4 Year 5 Year 6 Year 7 Year 8 Year 9 Year 10 Year 11 Year 12 Year 13 Year 14 Year 15
(Year
1) vs LSHFO vs Scrubber
Main hypothesis
•Large containership: 14,000 TEU
•Route: Asia Europe
Payback c.3 years vs other solutions •Avg Consumption.: 150t/d HFO
•Brent price: ~60-65$/b on average over the period
•Over-CapEx (vs. conventionnal vessels):
25LNG as fuel : choice of LNG fuel for large
containerships saves 30,000 tons of CO2 / year
Comparison of emissions for 2 fuel types : oil fueled and LNG fueled
Energy Engine Over- Particulates
Fuel type SOx NOx CO2
content efficiency consumption PM
Mmbtu/ton g/kWh %m/m g/kWh g/kg fuel kg/kWh
Oil fuels 2-3% (if
(Compliant fuels 40-42 140 0,5% 7-15 1-1,5 0,27-0,28
or HFO+ Scrubber) scrubber)Open loop scrubbers utilization banned areas
keep expanding
Map of areas where the use of open loop scrubbers is banned
Since October 2019, 4 areas have banned the use of open loop scrubbers
in their waters: Panama canal, Malaysia, Suez Canal, Karachi (Pakistan)
27Membrane is consolidating its penetration in LNG fuel
market
LNG fuel tanks competitive landscape
LNG as a marine fuel continues its LNG tanks total
capacity - cbm
penetration in shipping market
despite a persisting wait & see
20,000
attitude
Newbuild & Retrofit
9% market share in 2019
Type B • Ultra & Very Large
Newbuild Container Vessels
Most of the c.90 LNG fuelled vessels • Very Large Container
Vessels • Cruise ships
10,000
ordered in 2019 were small (expedition)
10-15 vessels
capacities in Type C 100-150k cbm 15-20 vessels
200-300k cbm
Mainly < 1,000 cbm, and up to 6,000
cbm Type C
5,000
Newbuild & Retrofit
• Ferries
In 2019, membrane success was • Ro-Ro
focused on very large containerships • Tugs
• Small Containers
after penetrating cruise ships in 2018 • Small Tankers
1,000 • Small bulkers
Breakthrough with first large • …
300-400 vessels
conversion ever 350-450k cbm
Type B technology is penetrating 1 2 3+
very large containerships but with Number of market segment penetrated
limited track record Main sources: Clarksons, DNV GL
28LNG Fuel market potential for GTT
Relevant Market Segments Historical 10y
Shipping Markets Fleet at end 2019
for GTT annual orders
MAIN TARGETS
Container Ships 3-20+ kTEU
Bulkers 100+ kdwt ~225 ~5500
Oil Tankers 125+ kdwt
Cruise Ships
All size ~35 ~1200
Car & Truck Carriers
TOTAL SHIPPING MARKET
All vessels
100 GT+ 2,400 ~98,000
(excl. LNGC, FSRU…)
Source: GTT analysis, Clarksons
Global market represents a pool of ~2,400 ships per year (newbuilds)
GTT is particularly focusing on a segment of ~ 260 ships per year (newbuilds)
With expected recovery of shipping market and LNG fuel penetration rising, LNG fueled
orders should multiply
293.3 4
Service activity
30Services to make LNG easy
Support of GTT’s LNG core activities
Support for the development of LNG as fuel
CONSULTING TRAINING LNG OPERATIONS EMERGENCY
to get LNG as fuel to raise awareness to support operators in the to avoid escalation and
projects on track about LNG first LNG operations minimise impacts
DIGITAL MAINTENANCE TESTS ENGINEERING
to support the industry’s to maintain the industry’s to facilitate LNG tanks to enable projects and
digital transformation track record maintenance support daily operations
31Acquisition of Marorka, a new step in GTT’s digital
roadmap
A leading global provider of data-driven energy management and operational performance
solutions for the international maritime industry
Marorka focuses on fuel savings, emission reduction compliance and reporting, and performance
optimization
More than 600 vessels installed
Good technical, commercial and geographical complementarity with Ascenz
Products
Located on-board the vessel, the system allows electronic measurement logging
Data Acquisition and collects data for performance monitoring
Based on the operational data collected, Marorka Onboard enables monitoring
and improvement of energy management efficiency and operational performance.
Main advisory modules: machinery operation, fuel consumption, voyage
Onboard Advisory
optimization, optimal trim and report generation
Marorka Online is a cloud-based fleet performance reporting system. It provides
Marorka Online the shore-based personnel with access to fleet performance data.
Main modules: fleet performance dashboard, performance optimization and
benchmarking, and emissions monitoring reports
Services
Energy management advisory services
Training services for a successful implementation and usage of the Marorka solution
325
Strategic roadmap
33GTT’s strategic roadmap
6. Transformation Gas handling
technologies
Towards a lower emission
maritime world
Smart shipping
2. Enhancement
Offshore
Multigas
LNG as
LNG Carriers GBS
fuel
Evolution
of NO 96
& Mark
Transfer 1. Intensification systems
operations
5. Enlargement
3. Improvement
Advisory services
Intervention services
Training
4. Advisory and services 346
Financials
35Order book overview (core business)
Order book in units Order book by year of delivery (units per year)(1)
In units In units
Order book in value Revenues expected from current order book(2)
In €M In €M
+ 34%
(1) Delivery dates could move according to the shipyards/EPCs’ building timetables.
(2) Royalties from core business, i.e. excluding LNG as Fuel, services activity. 362019 financial performance
Summary consolidated accounts Key highlights
In € M 2018 2019 Change
Revenues
Newbuilds (royalties): +18.1%, mainly driven by
Total Revenues 246.0 288.2 +17.2% LNGCs (+16.2%),FLNGs (+38.3%) and LNG as fuel
EBITDA(1) 168.7 174.3 +3.3% Service revenue: +2.7%, mainly due to an increase of
Margin (%) 68.6% 60.5% maintenance services and Ascenz activities, and a
decrease of pre-engineering studies
Operating Income 159.9 170.0 +6.3%
Margin (%) 65.0% 59.0%
EBITDA: +3.3% / +13.6% excluding 2018 one-off items
Net income 142.8 143.4 +0.4% Increase of external charges: +31.7% due to
Margin (%) 58.1% 49.7% increased number of new orders
Increase of staff costs: +12.7%
Free Cash Flow(2) 217.2 154.9 -28.7% 2018 one-off items: reversal of provision
Change in Working
-60.3 +10.4 nm
Capital
Net profit: +0.4% / +12.6% excluding one-off items
Capex 11.8 9.0 -23.7%
2018 one-off: reversal of provision, tax refund and
Dividend paid 98.5 122.0 +23.9% impairment charge
in € M 31/12/2018 31/12/2019 Capex:
Impact of Ascenz acquisition in 2018
Cash Position 173.2 169.0
New building at headquarters in 2019
(1) Defined as EBIT + amortisations and impairments of fixed assets
(2) Defined as EBITDA - capex - change in working capital
372019 Cost base
GTT consolidated operational costs Key highlights
in € M 2018 2019 Change (%)
External costs: +32%
Goods purchased (3.0) (7.1) +136.9%
Subcontractors +50%, due to strong flow of orders
% sales -1% -2% Other external costs +19% (mainly fees from
external advisors and patent filing)
Subcontracted Test and
(17.8) (26.7) +50.3%
Studies
Rental and Insurance (4.4) (4.8) +10.3% Staff costs up 13%, mainly due to the increase
in headcount (+10%)
Travel Expenditures (8.0) (9.6) +19.8%
Other External Costs (10.8) (12.8) +18.5%
Total External Costs (41.0) (53.9) +31.7%
% sales -17% -19%
GTT 2019 costs(1) by nature
Salaries and Social
(38.2) (42.1) +10.2%
Charges
Staff costs
Share-based payments (0.6) (2.2) nm 46%
Profit Sharing (7.0) (7.3) +4.3% External costs
48%
Total Staff Costs (45.8) (51.6) +12.7%
% sales -19% -18%
Other(1) 0.3 - nm
Cost of sales
% sales 0% 0% 6%
(1) Excluding depreciations, amortisations, provisions and impairment of assets
38Dividend
2018 2019
Consolidated net profit (IFRS) €142.8 M €143.4 M
Total dividend
Dividend per share €3.12 €3.25
Total amount paid €115.6 M €120.5 M
Pay out ratio 81% 84%
Dividend
amount
3.25
3.12 +4%
Balance dividend
of €1.75
- Record date:
June 8, 2020
1.79 1.75 - Payment date:
June 10, 2020
1.33 1.50
2018 2019
Interim Final
(1) Dividend payout ratio calculated on profit distributed (and possible distribution of reserves) as % of consolidated net profit for the financial year.
397
Outlook
402020 Outlook
GTT revenue(1) 2020 consolidated revenue estimated in a range of €375M to €405M
EBITDA 2020 consolidated EBITDA estimated in a range of €235M to €255M
Dividend
2020 and 2021 payout of at least 80%
Payment(2)
(1) In the absence of any significant delays or cancellations in orders. Variations in order intake between periods could lead to fluctuations in revenues
(2) Subject to approval of Shareholders' meeting. GTT by-laws provide that dividends may be paid in cash or in shares based on each shareholder’s preference
41Thank you for your attention
Image courtesy of STX, Engie, Excelerate, Reliance, SCF Group, Shell, CMA CGM, Conrad
42
Masque PowerPoint - January 2020 CONFIDENTIALAppendix
43A streamlined group and organisation
(December 31, 2019)
GTT Group
Philippe Berterottière*
Chairman and Chief Executive
Officer
GTT SA organisation
Lélia Ghilini*
Secretary General
General Counsel
Frédérique Marc Haestier* Sandrine Vibert*
Julien Bec David Colson* Karim Chapot*
Coeuille* Finance & Human
LNG as fuel Commercial Technical
Innovation Administration Resources
~17 employees ~28 employees ~194 employees
~102 employees ~40 employees ~13 employees
* Member of the executive committee
44GTT exposure to the liquefied gas shipping and storage
value chain
Exploration Off Take /
Liquefaction Shipping Regasification
& Production Consumption
Liquefied Natural Gas LNG fuelled
Offshore Carrier ship
clients: (LNGC)
shipyards Platform /
Gas-to-wire
Installation Floating LNG Production, Floating Storage and
Storage and Offloading Regasification Unit (FSRU)
unit (FLNG)
Barge
Ethane/ multigas
Carriers
Onshore
clients:
EPC Power plant
contractors Onshore storage Onshore storage re- Tank in
liquefaction plant gasification terminal industrial plant
Source: Company data
45GTT ecosystem
Oil & Gas
Companies Shipowners
End clients and
End clients and prescribers
prescribers
provides services provides services
and maintenance
Classification
Societies
Regulatory oversight
of the industry
Shipyards
Direct clients
receives new
technology
certification and licences its membrane
approval technology and receives
royalties
provides engineering
studies, on-site technical
and maintenance
assistance
46GTT membrane technologies
Primary
General principle: membrane
Two membranes
Primary insulation
Two layers of insulations Secondary
membrane
Containment system Secondary insulation
anchored to the inner hull Hull
Mark III system NO96 system
4756 ageing vessels with charter contract ending by 2023
LNGCs carriers* with charter contract ending by 2023
100 LNGC chart contract to end by 2023
50
Of which 56 equipped with steam turbine
45
propulsion; also smaller vessels (US LNG is competitive in Asia
US LNG vs. Asian LNG price depending on Henry Hub and Oil prices
11 Asian LNG
Asian oil indexed LNG competitive
US LNG competitive
10
LNG price ($/Mmbtu)
9
Spread
8 HH : $3,5/Mmbtu
US LNG
HH : $3/Mmbtu
7 HH : $2,5/Mmbtu
2019 avg.
6
Main sources:
GTT analysis, EIA, Wood Mackenzie
5
40 45 50 55 60 65 70 75 80
Oil price ($/bl)
Hypothesis
US LNG: Asian LNG:
• HH+15% • Slope: 13% of JCC price
2019 has been very competitive for US LNG vs Asian LNG • Tolling Fee: 2.25$ • Constant: 0.5$
• Shipping: 1.43$ (US East ->Japan,
High oil prices ($70/bl) vs low Henry Hub prices ($2,6/Mmbtu) 174k cbm Me-GI or X-DF)
US LNG ≈ $6.8/Mmbtu
Despite 25% tariff, US LNG remains economic in China
Asian LNG ≈ $9,5/Mmbtu (US LNG+tariff =$8,6/Mmbtu)
These economics still favors US FIDs, despite low LNG price on the spot market
49LNG short term charter rates
50LNGCs – Our main business
Vessels equipped for transporting LNG
Existing GTT fleet: 384 units1
In order: 113 units1
26 construction shipyards under license1
Our strengths
Technological leadership, boil-off divided by 2 in the last 5 years
Long term industrial partnerships with major shipyards
A unique position in the LNG ecosystem, nurtured by 50 years of
experience, expertise and customer orientation
1 As at 30 December 2019
51FSRUs – The game changer for new importing countries
Major competitive advantage vs. land-based terminals:
Quick to build/deploy & mobile
Better local acceptability & easier permitting
Affordable / no upfront CapEx
Adapted to more volatile LNG prices
Quality controlled construction in shipyards with available
and skilled workforce Courtesy of Excelerate Energy
FSRUs market outlook
More than 40 FSRUs
currently in service or
under construction
Worldwide development
Asia (India, China, …)
Europe
(Turkey, Croatia, …)
South & West Africa
LatAm & Carribeans
Source: Poten 2018
52FLNGs – the new frontier of the LNG world
Floating units which ensure
treatment of gas, liquefy and store it
Existing GTT fleet: 2 units1
In order: 2 units1
Courtesy of Shell
Main drivers GTT key advantages
Monetisation of stranded Extended amortization
offshore gas reserves perspectives
Better acceptability (no NIMBY Deck space available for
syndrom) liquefaction equipment
More affordable cost
1 As at 30 December 2019
53Arctic LNG-2 recent FID: a great opportunity for GTT to
expand in the LNG value chain with 1st GBS ordered
From liquefaction To
plant Regasification
Trans
shipment Regas
terminal:
Onshore or
FSRU
Ice class Conventional
GBS LNG carrier LNG carrier
The Arctic LNG-2 project sanctioned in September 2019 represents a great achievement
for GTT who will equip 3 GBS of 229k cbm each
GTT could be present all along the value chain, by equipping GBS, Ice class LNG
carriers and conventional LNG carriers
54GBS is suitable for a very wide range of applications
@ SemCorp
@ Acciona
Concrete or steel, installed in jetty, breakwater dike or nearshore
GBS range 5k 50k 200k+
Storage capacity (cbm)
LNG SUPPLY CHAIN
• Liquefaction or regasification plants
• Peak Shaving
• Satellite Station
• Inland distribution
Markets POWER
• Industry Company
• Captive Power
BUNKERING
• LNG as fuel
LOCATION
Location • Islands, remote costal areas, isolated industrial needs (ex.: mining), …
55Ethane: Order of 6 VLEC in September 2019
An increasing ethane transportation market
Transportation of Liquefied Ethane is an increasing US ethane production, consumptions and exports
market, driven by the strong development of shale gas
and shale oil production in the US
Excess supply of ethane (byproduct of shale oil
and shale gas) and interdiction to flare have
pushed the US to start exporting ethane in 2014
Market to further develop and exports to rise
Vessels size increase make GTT membrane very competitive
With the 6 VLEC, GTT breaks its own capacity record
for VLECs
98k cbm vs 88k cbm for the 6 Reliance ordered
in 2014
Increasing size of vessels is favorable to GTT
technology
Source: Clarksons
56Focus on GTT’s competitive advantages on LNGCs
GTT’s technology positioning (1)
GTT Moss SPB KC-1
▶ Integrated tank ▶ Integrated tank
▶ Self supported spheric tank ▶ Self supported prismaticl tank
Technology (membrane) (membrane)
▶ Atmospheric pressure ▶ Atmospheric pressure
▶ Atmospheric pressure ▶ Atmospheric pressure
▶ Requires less steel and
▶ Slightly higher costs
CAPEX aluminum than tanks for ▶ Higher costs ▶ Higher costs
than GTT
a given LNG capacity
▶ More efficient use of
space ▶ Higher opex due to
OPEX ▶ Higher fuel / fee costs ▶ Higher fuel / fee costs
BOR (0.16%)
▶ Limited BOR (0.07%)
LNGCs in
▶ 115 ▶ 0 ▶ 0 ▶ 0
construction
LNGCs in
▶ 384 ▶ 129 ▶ 4 (+2 small) ▶ 2 (on repair)
operation
▶ Huge losses and delays on
▶ Higher centre of gravity; ▶ Korean technology with
Other ▶ Value added services vessels in orderbook.
harder to navigate little experience at sea
No significant experience
GTT technologies : cost effective, volume optimisation and high return of experience
Source: Company data and comment (December 31, 2019), Clarksons
(1) Other technologies are being developed, however are not known to have obtained final orders to date (e.g. DSME’s Solidus). Excludes vessel orders below 50,000 m3
57LNG is cheap and stable vs volatile oil fuels
Evolution of marine fuel prices since 2018 (Delivered onboard)
750
MGO
700
650
600
$/ton HFO eq,eff
550
500
450
400 HFO
LNG fuel Asia
350
LNG fuel Europe
300
LNG fuel US
250
Normalisation of the energy content of the different fuels + engine efficiencies differencies taken into account
LNG fuel prices are contracted prices (oil, HH, NBP/TTF indexation).
NB: LNG prices include $100/ton bunkering
Main sources : Wood Mackenzie, Argus, EIA, Platts, CME, Bunker Index, Delft University, GTT, Win GD
Despite IMO 2020 entering into force, HFO prices remain at similar levels as LNG fuel in Asia
Thanks to diverse indexation , contracted LNG prices are very stable vs oil fuels.
LSHFO prices are currently in the range of MGO.
58GTT’s LNG Fuel solutions offering
GTT has developed solutions for the main applications of LNG Fuel
Solutions for Container Vessels new build and retrofit Cruise Ship – optimizing the space for additional
passengers
Lean bunker barge to
Cost effective solution for bulk carriers standardize the market
New LNG Brick®
dedicated to medium-sized merchant vessels
test phase completed
59LNG Fuel: wide network of partnerships
25 shipyards under licensed agreements
Network of membrane tank outfitters
A close relationship with engine makers and FGHS1 providers
(1) Fuel Gas Handling System
60Commercial successes: container ships…
European ship-owner ULCS – Newbuilds –
14,000 m³
5 ships in June 2019
Built at Jiangnan Shipyard
Hapag Lloyd VLCS - LNG Retrofit – 6,700 m³
1 ship in April 2019
Hudong-Zhonghua as membrane outfitter
CMA CGM ULCS – Newbuilds – 18,600 m³
9 ships in November 2017
Shipyards :
5 ships in Hudong-Zhonghua
4 ships in Jiangnan Shipyard
ULCS: Ultra Large Container Ship
61… Cruise ships and bunker vessels
PONANT Expedition Ship – 4,500 m³
1 ship in July 2018
Built at VARD Norway
GTT acting as EPC for the LNG tank
Oct. 2018
MOL1 LNG Bunkering Vessel – 18,600 m³
1 ship in January 2018 and 1 ship in December 2019
Built at Hudong Zhonghua Shipyard
MOL1 LNG Bunkering Vessel – 12,000 m³
1 ship in March 2019
Built at SembCorp Marine Shipyard
1 Mitsui OSK Lines 62Focus on GTT’s competitive advantages on LNG fuel
GTT’s technology positioning on LNG fuel
GTT Membrane Prismatic Type B Type C
▶ Self supported Cylindrical tank
Technology ▶ Integrated tank ▶ Self supported tank ▶ Pressurized
principle ▶ Atmospheric pressure ▶ Atmospheric pressure ▶ Insulation: vaccum (smaller tanks) or
foam (larger tanks)
Space ▶ High: Integrated tank and ▶ Moderate to high : Inspection space, ▶ Low: Cylindrical design, restricted filling
optimization unique design for each vessel restricted filling limits (heel) limits (pressurized)
Boil off ▶ Low ▶ Low to medium ▶ High (foam)
▶ Moderate cost: Requires less ▶ Higher cost, as much metal is used
CAPEX steel and aluminum than other (Aluminum or Nickel) and many ▶ Lower cost (foam), high cost for vaccum
tanks for a given LNG capacity workers required for welding
▶ Reinforced foam for LNG fuel
▶ Tank shape ▶ Tank shape
Sloshing tanks
▶ Metallic structure ▶ Metallic structure
▶ Chamfers
LNG fueled ▶ High experience with >400 ▶ Limited experience at sea (few
vessels in vessels in operation (LNGCs, LNGCs, with delays and high cost ▶ 175 (mainly with tanksAn attractive business model supporting high cash
generation
Invoicing and revenue recognition Business model supports high cash generation
% of contract (1)
c. 9 to12 months c. 18 months Delivery Revenue is recognized pro-rata
10000 studies royalties temporis between construction
milestones
8000
Ship
launching Initial payment collected from
shipyards at the effective date of
6000
Keel laying order of a particular vessel (10%)
Steel cutting (20%)
4000 Keel laying (20%)
Steel cutting
Ship launching (20%)
Delivery (30%)
2000
Months from receipt of order
0
0 5 10 15 20 25
Cash collection Revenue IFRS 15
Source: Company
(1) Illustrative cycle for the first LNGC ordered by a particular customer, including engineering studies completed by GTT
64Appendix: track record of high margin and strong backlog
2008 2011
Economic crisis Fukushima
US shale gas boom
120 112 66 30 18 52 77 99 114 118 96 89 97 133
66
51
44 47
37
Evolution of new 34 35
26 21
GTT orders (1)(2) 19
7
4 1 5
2006 2007 2008 2009 2010 2011 2012 2013 2014 2015 2016 2017 2018 2019
LNGC/VLEC FSRU/FLNG Onshore storage / GBS Barge Backlog (# of orders)
65% 64%
57% 58%
55% 50%
51% 52% 51% 50%
42% 44%
31% 33%
Evolution of
288
revenue (in € M) 222
251
218 227 226 237 232 246
and net margin (4) 163 142
75 89
56
2006 2007 2008 2009 2010 2011 2012 2013 2014 2015 2016 2017 2018 2019
Revenue Net Margin
Source: Company
(1) Orders received by period / Core business
(2) Excl. vessel conversions
(3) Represents order position as at December based on company data, including LNGC, VLEC, FLNG, FSRU and on-shore storage units
(4) Figures presented in IFRS consolidated from 2016 to 2018, IFRS from 2010 to 2015, French GAAP from 2006 to 2009
65Contact: information-financiere@gtt.fr / +33 1 30 23 20 87
You can also read