Investor Presentation - Advanced Info Services Plc. May 2020 - Advanced Info Services Public ...

Page created by Louise Goodman
 
CONTINUE READING
Investor Presentation - Advanced Info Services Plc. May 2020 - Advanced Info Services Public ...
Investor Presentation
     Advanced Info Services Plc.
                      May 2020

                                   1
Investor Presentation - Advanced Info Services Plc. May 2020 - Advanced Info Services Public ...
Agenda
•   1Q20 Performance
•   Leading to 5G era
•   2020 outlook

                        2
Investor Presentation - Advanced Info Services Plc. May 2020 - Advanced Info Services Public ...
1Q20 Performance

                   3
Investor Presentation - Advanced Info Services Plc. May 2020 - Advanced Info Services Public ...
1Q20 Performance
                                Service revenue (Bt mn)                                            • Mobile revenue was negatively affected by price
% Contribution
                                ex. IC&TOT                                                           competition and COVID-19 impact. Postpaid growth
to service revenue ex. IC&TOT
                                              -1.1% YoY   +27% YoY         Flat YoY                  was offset by prepaid decline. Revenue from
                                                                                                     international roaming and prepaid tourist SIM faced
                                                                                                     significant drop from faded travelers.

                        FBB                                                                        • FBB revenue grew double digit as subscriber base
                  5.0%                                                                               continued to grow, albeit at slower rate.
  Mobile
                  3.4% Other
   92%
                                                                                                   • EBITDA growing from net cost reduction from TOT
                                                                                                     partnership

                                                                                                   • D&A grew YoY from network expansion and the
                                                                                                     acquisition of 2600MHz in Feb.

                                                                                                   • Interest expense dropped slightly from 4Q19
                                                                                                     repayment
Profitability (Bt mn)
and TFRS16 effect               -33% YoY                       +3.8% YoY    +12% YoY
                                                                                                   • FX loss from unrealized loss as Baht depreciation on
                                                                            Spectrum                 Usd
                                                                            2,279mn
                                                                            +13%YoY                • NPAT reported negative growth from higher
                                                                                                     depreciation and FX loss

                                                                                       -1.9% YoY                       -7.5% YoY                -11% YoY

                                                                                                                                                        5
Investor Presentation - Advanced Info Services Plc. May 2020 - Advanced Info Services Public ...
Mobile revenue impacted from roaming and competition
Mobile Revenue (Bt mn)                                                                     % Revenue Contribution
                                                                                           mobile business
                   -6.9% YoY        +8.7% YoY         -34% YoY         -1.1% YoY
                                                                                                                    1Q19                           1Q20
                                                                                                  Prepaid
                                                                                                  Postpaid
                                                                                                                  43%                            47%
                                                                                                                                    3%
                                                                                                  IR&IDD
                                                                                                                                                               2%

                                                                                                                        54%                            51%

Mobile net adds (thousand)                                                     Postpaid   Mobile ARPU (bt/month/user)
five consecutive quarters                                                      Prepaid    Postpaid and prepaid
            354                                        350                                                                                                      Postpaid
                             250              208                                                                                                              -0.8% YoY
                                                             106                33              529           537             531         537            525
                                                                                                                                                               -2.2% QoQ
     (32)                                                                                       174           182             179         173                   Prepaid
                                      (115)                                                                                                              162
                     (276)                                                                                                                                     -6.6% YoY
                                                                       (891)                                                                                   -6.4% QoQ

       1Q19            2Q19             3Q19             4Q19             1Q20
                                                                                               1Q19          2Q19          3Q19          4Q19           1Q20
 Subscribers % Change                Postpaid +7.0%YoY, +0.4%QoQ
                                     Prepaid -2.8%YoY, -2.7%QoQ                           • Prepaid ARPU pressured by continued unlimited fixed speed plan at Bt200 and Bt150.
• Prepaid revenue was affected from less traveler segment and continued unlimited
                                                                                          • Postpaid ARPU impacted from new unlimited speed plan at Bt300, launched in late-
  data pricing. Subscribers dropped from tourist SIM started in early Feb.
                                                                                            Feb in response to competition
• Postpaid revenue grew high single digit YoY, slowing down from double digit
  growth in FY19. Net add affected by shop close led to less subscribers acquisition.
                                                                                                                                                                        5
Investor Presentation - Advanced Info Services Plc. May 2020 - Advanced Info Services Public ...
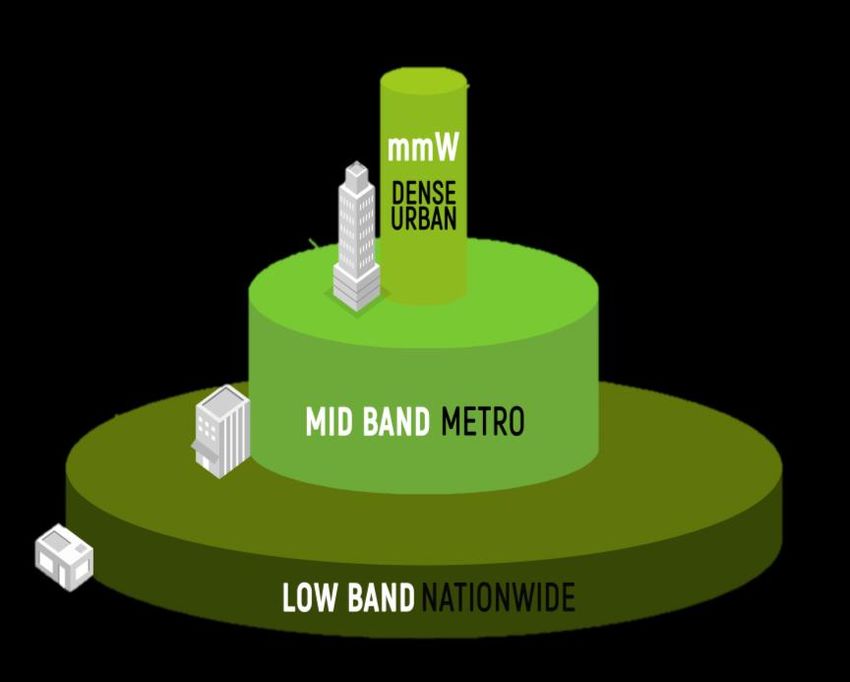
COVID-19 impact on traveler revenue and handset sales
 Core service revenue significantly declined YoY in Mar-20
                                                                              COVID-19 situation and weak economy put pressure
 %YoY Service revenue                                                          on ARPU and new postpaid acquisition
                 2.2%              2.6%                                        Postpaid acquisition (‘000)
                                                                                             498    464      461     500
                Jan-20             Feb-20             Mar-20                                                                337    -32% YoY
                                                                                                                                   -33% QoQ
                                                          -4.1%

• In Mar-20, Service revenue declined 4.1% YoY as mobile revenue dropped
                                                                                            1Q19    2Q19     3Q19    4Q19   1Q20
  5.5% YoY while fixed broadband revenue increased 26% YoY.

                                                                              Handset sale slowdown in the latter half of Mar-20, when
         IR and prepaid tourist SIM revenue dropped                            partial lockdown was implemented
      IR and prepaid tourist SIM revenue (Bt mn)                               Unit sales (‘000)

                                                                                            1,040    919     1,036    957
                                                      -43% YoY                                                               684   -34% YoY
                                                      -44% QoQ                                                                     -29% QoQ

                  1Q19    2Q19    3Q19      4Q19   1Q20

      IR and prepaid tourist SIM contribution                                               1Q19    2Q19     3Q19    4Q19   1Q20

                  2.3%    2.3%    2.0%      2.3%
                                                   1.3%                       Handset subsidies dropped in Mar-20 as AIS shops
                                                                               and channels in shopping malls were closed
                  1Q19    2Q19    3Q19      4Q19   1Q20

                                                                                                                                              6
Investor Presentation - Advanced Info Services Plc. May 2020 - Advanced Info Services Public ...
Demand for home broadband emerged late March
     FBB business impacted by competition & COVID-19                                              FBB subscriber growth slowdown

Decelerated revenue growth

         27%      26%      32%      30%      27%                                                                                    1,090
                                                                                                                937    1,038
                                                                                   795          855
                                                   +3.9% QoQ
                          1,475    1,579    1,640
        1,288    1,380
                                                                                                                                                        Net addition (‘000)
                                                         FBB revenue (Bt mn)                                     82     101
                                                                                      65           60                                                   Ending subscriber
                                                         YoY growth                                                                  53
                                                                                                                                                        (‘000)
                                                                                     1Q19         2Q19          3Q19   4Q19         1Q20
        1Q19     2Q19     3Q19     4Q19     1Q20

 • AIS fibre had a decelerated growth of 27% YoY and 3.9% QoQ                   • Net add slowed down as AIS Fibre withdrew aggressive discount
                                                                                  offered in an attempt to uplift ARPU.

ARPU softened amid competitive pricing                                          Offer more affordable Working from Home Package
                                                    -8.7% YoY                       Bt399
         563      558      549                      -3.6% QoQ                                                          Max speed          4G Internet Unlimited for 3 months
                                    533                                                    Max speed internet          mobile SIM              for Office 365 and Zoom
                                             514
                                                               ARPU                         100/100Mbps                1GB*
                                                               (Bt/sub/month)
         1Q19     2Q19     3Q19     4Q19     1Q20
                                                                                • As the city lockdown emerged during the last week of March, Working
• FBB APRU continued downward trend as the competition elevated with              from Home Package were introduced to support the customer demand
  smaller package, Bt399 for 100/100Mbps, introduced in the market.               and resulted in higher subscription rate in late March.

                                                                                                                                                                               7
Investor Presentation - Advanced Info Services Plc. May 2020 - Advanced Info Services Public ...
Enterprise business supported by EDS and Cloud
                                                                                      Enterprise non-mobile services is on higher demand

 1Q20 Enterprise revenue
                                                           Non-mobile,                                                      +10% YoY
            Bt3.2bn              Mobile,                      27%                                                           -0.6% QoQ
                                                                                    1,000
     +6.4% YoY, -2.6% QoQ         73%
                                                                                                                                     Enterprise non-mobile
                                                                                     500                                             revenue (Bt mn)

                                                                                       -
                                                                                            1Q19    2Q19    3Q19    4Q19   1Q20
     Enterprise mobile services pressured by COVID-19
                                                                                     Non-airtime services include
                                                       +5.1% YoY
    3,000                                              -3.3% QoQ                                                            Data               ICT
                                                                                            EDS            CLOUD                               Solution
                                                                                                                            center
    2,000

    1,000                                                     Enterprise mobile
                                                              revenue* (Bt mn)      Higher demand in EDS and Cloud
       -
             1Q19     2Q19   3Q19    4Q19      1Q20                                   • In 1Q20, lower new data links implemented as site
                                                                                        inaccessible, but since late-March, more requests of work
• Enterprise mobile services were impacted by the COVID-19,                             from home’s bandwidth have increased.
  resulting in a QoQ drop in revenue.                                                 • For Cloud services, there was a high demand for WFH
• AIS has mitigated this impact by launching minimal packages                           services e.g., Team for Thailand (Office 365), Virtual
  for customer retention and extending credit term.                                     desktop infrastructure.

                              *This revenue is embedded in mobile service revenue

                                                                                                                                                          8
Investor Presentation - Advanced Info Services Plc. May 2020 - Advanced Info Services Public ...
Ensure continuity of service during COVID-19

     New acquisition channel                   Top up & Payment channel                                                Product and service

Reinforce and accelerate                        %amount via online channel1)
• AIS online store
• Pop-up store
• Telesales
• Other business partners in retail
   space                                        >40%                                >60%
                                                                                                             •   Work from home package: targeting mass
                                                                                                                 consumer and students on both mobile and
                                                       < prepaid postpaid>                                       broadband offerings.
                                                                                                             •   VDO package
                                                                                                             •   Bundled COVID-19 insurance with data or
                                           %amount via online & self-service2)                                   FBB subscription

                                                                                                             AIS' COVID responses
                                                                                                             • The payment deferral for 1-3 months with no

                                                >75%                                >70%                        interest
                                                                                                             • The extension of validity for 1-3 months
                                                                                                             • The launch of new and more affordable
                                                                                                                packages for affected customers
                                                       < prepaid postpaid >
                                                                                              as of Mar-20
                                      1) Online channel: Mobile banking/mPAY app/myAIS/RLP/recurring DD,CC
                                      2) Self-service channel: mPay Vending/ATM

                                                                                                                                                             9
Investor Presentation - Advanced Info Services Plc. May 2020 - Advanced Info Services Public ...
1Q20 Cost breakdown (Pre-TFRS16)
                                                       1Q19               Change                1Q20       %Change
Cost of service                                        (19,817)                     568         (20,385)   ▲2.9% Increased mainly from network expansion
 Regulatory fee                                         (1,403)                 6               (1,409)    ▲0.4% Flat following core service revenue

 Depreciation & Amortization                            (8,691)                     1,021       (9,712)    ▲12%       4G network, FBB and 2600Mhz license

 Network OPEX & TOT partnership (gross)                 (7,371)     -197                        (7,173)    ▼2.7%      Lower rental cost offset by higher network OPEX

 Network OPEX & TOT partnership (net of rev.)           (5,139)       -601                       (4,538)    ▼12% Lower rental cost after settling disputes with TOT
 Other costs of services                                (2,352)    -262                         (2,090)    ▼11%       Lower prepaid commission

Cost of SIM and device sales                            (7,159)      -740                       (6,419)    ▼10%       Dropped from lower device sales

SG&A                                                    (6,262)                 26              (6,288)    ▲0.4%      Higher admin expenses offset by marketing expenses

 Marketing Expense                                      (1,934)     -172                        (1,762)    ▼8.9%      Lower marketing activities in 1Q20

 Admin and others                                       (4,328)                     198         (4,526)    ▲4.6%      Higher bad debt provision and staff cost
Net foreign exchange gain (loss)                            84                            506      (422)   ▼602% FX loss from Baht depreciation of A/P for CAPEX
Other income (expense)                                     203                  68                  271     ▲34% Reverse accrued expenses
Finance cost                                            (1,217)           -15                    (1,201)   ▼1.3% Lower interest-bearing debt from debt repayment

Common size
Cost of service                                 40.7%             41.4%
                                                                                            SG&A
(Net cost of TOT partnership)                                                                                 14.5%            14.7%

                                                1Q19              1Q20                                         1Q19             1Q20

                                                                                                                                                                           10
Strong Balance sheet and cash flow to support investment
                                             Balance Sheet                                                                                   1Q20 Cash flow
(Bt bn)                                                                                                                   (Bt bn)                                      Cash increase                              Cash decrease
   Right-of-use asset Bt65bn
                                  right           others A/P                                                                    Operating   Investing                                      Financing                             Net cash
   incurred from long term                                                spectrum
                                 of use
   contracts mainly including                                             license
   2100MHz agreement and                           21 39                  payable
                                          65                                                                                  23.0
   tower rental                                                     80
                                                                                                                                                                                                                                    10.9
                   spectrum             Assets         Liabilities                                                                          5.9
                     license 118                                                                                                                    2.0                                                         2.9
                                                                                  interest-                                          0.5                               0.2                    0.6
                                                                   310    94      bearing
                                                   B/S

                                                                                                                                            CAPEX
                                                                                                                                             Cash
                                                                                                                              cash flow

                                                                                                                                                                                               Finance cost
                                                                                                                                                                                                                        Lease

                                                                                                                                                                                                                                    increased
                                                                                                                                                                                                                                         Cash
                                                                                                                                Income
                                                                                                                               tax paid
                                                                                                                              Operating

                                                                                                                                                                                                              liabilities paid
                                                                                                                                                                        Investment in JV
                                                                                                                                                    Spectrum license
                                      375                                         debt
                                                   1Q20

                      PPE                              Equity            64
                                 122                                           lease          Lease liability Bt64bn
                                                         65                    liability
                                                                    32                        incurred at the beginning
                                                              40                              period was the amount
                                A/R          18         25               others
                                                  31                                          of the right of use.
                                      cash                      retained earnings
                                                       others                                                               Operating cash flow was in healthy level to support
                                                                                                                            CAPEX, debt repayment, and dividend payment.
                            0.7x                                              1.5x                                          Investing cash flow was Bt8.1bn, which included
                    Net debt to EBITDA                              Interest bearing debt                                   spectrum license payment of Bt2.0bn
                                                                          to Equity                                         Average finance costs = 3.0% p.a.
                                                                                                                            • Maintained investment grade credit ratings
                            0.4x                                              42%                                             • Fitch: national rating AA+ (THA), outlook stable
                        Current ratio                                Return on Equity                                         • S&P: BBB+, outlook stable

                                                                                                                                                                                                                                                11
Impact from TFRS16
                  TFRS16 adoption                                                      P&L impact

TFRS 16: Lease (replacing IAS17: Operating lease         (Bt mn)

        and Finance lease)
                                                                                         Bt-248mn
The standard requires the operating leases obligations
as of 1 January 2020 to be recognized as right-of-use                2,920
assets at the present value of lease payment over the
remaining lease term at an amount equal to lease                                           14
                                                            7,004                                              54      6,756
liabilities adjusted by prepaid payment. The leases                            2,873                  363
including tower lease agreement, site rental, office &
shop building rental, and minimum payment on TOT’s
2100MHz spectrum. The key changes are as follows:

Opening balance impact on 1 Jan 2020
• Increase in Right of use of Bt67.3bn
• Increase in Lease liabilities of Bt66.3bn               Net profit Network   D&A        SGA       Finance   Income Net profit
                                                         Pre-TFRS16 OPEX                              cost      tax Post-TFRS16

Balance as of 31 Mar 2020: Right of use Bt65.3bn
and Lease liabilities Bt64.3bn

                                                                                                                                  12
Leading to 5G era

                    13
Combination to deliver best 5G quality

   Best performance combining each band capabilities                    Superior throughput to serve all use cases

                                                                                Speed                Capacity
                                                                                X 10                 X 10
                                                                           Maximum speed up     10 times network
                                                                             to 1-10Gbps        capacity over 4G

                                                                                                200-300m

          Anchor band for     Combined benefit       Super wide                                         0.5-1km
        nationwide coverage   of good coverage    bandwidth for multi
                              and high capacity    gigabit services

                                                                                                                   3-5km
              To deliver best-in-class 5G network
Spectrum management to strengthen our leading position
                     Low Band                                                   Mid Band                                                    High Band

                        900 MHz                                          1800 MHz and 2100 MHz                                                26 GHz
•      Provide nationwide coverage of 3G and 4G              •     Provide capacity of 3G and 4G                              Enhance capability to serve enterprise
•      Potential to upgrade into 5G                          •     Potential to upgrade into 5G                                     and industrial services
                                                                                                                         •      Support rollout in specifically hotspot area
                                                                                                                                such as industrial estates
                        700 MHz                                                   2600 MHz
                                                                                                                         •      Awaiting readiness of devices and use
    2x15 MHz to secure long term position                        100 MHz to reach full potential of 5G service                  cases
•      Anchor for blanket coverage with lower capex          •      Best 5G experience for mobile with strong
•      Ensure better in-building experience                         combination of capacity and coverage
•      Support network coverage of 900Mhz                    •      To penetrate FWA need for specific locations
                                                                    with physical limitation
                                                             •      Over 16mn 4G devices compatible on 2600Mhz

More spectrum to be refarm for providing 5G service in near future
                                                                                                                        5G expected to be main stream network
                 2020                2025    2027     2029       2031   2033   2035                               3G
                                                                                                                                    beyond 2025
                                                                                                                  4G
       700
                                                                                        • Nationwide              5G
Band

       MHz
Low

                                                                                                               Expiry        • 4G and 5G will co-exist at least in the
       900                  Refarm                                                        coverage
       MHz
               3G
                                                                                                                 date          next 5 years.
                                                                                                                             • 3G, currently 23% of users, should
       1800                 Refarm
       MHz                                                                                                                     subsequently fade out during the same
                                                                                        • Metropolitan
Band

                                                                                                                               period as 5G adoption rises.
 Mid

       2100                 Refarm
       MHz                                                                                and city
               3G
                                                                                          area
       2600
       MHz
                                                                                                                                   Current users by technology:
Band
High

        26
       GHz
                                                                                                                                    4G-73%. 3G-23%, 2G-4%
                         *Grant date within Feb 21 subjected to ecosystem readiness
5G roll out plan
  Nationwide roll out in strategic area                   Build up on current base station                           Catalyst for 5G expansion

                                                          Non Standalone              Standalone                Declining in 5G network cost

                                                       4G core                  4G core       5G core              Estimated network investment cost per site
Key cities coverage          Eastern Economic
 In 77 provinces                 Corridor
                                                                                                                                -9% CAGR%

                                                                                                                                                       5G
       13% of                      59%                  4G LTE        5G NR 4G LTE            5G NR
        population                  of area
                                                                                                                    2020 2021 2022 2023 2024 2025

                                                                                                                • Network investment during early stage of
                                                                                                                  technology expected to decrease with -9%
   Target coverage          Rollout of 2600 Mhz                                                                   CAGR
     by end-2020             within Jun 2020
                                                                                                                Commercial use cases in both consumers
                                                                                                                and enterprise segments

• Target 77 cities coverage (not an entire province)   • Both NSA and SA can be deployed on existing
                                                                                                                Technology migration from 4G to 5G
• 27 promoted zone in EEC                                towers/sites.
• 5G network investment on selective locations         • Multi-band and multi-technology allowing flexibility
      • Prime CBD area with high 5G adoption             of equipment to support both 4G/5G                     5G adoption rate and consumer behavior
      • High data usage and utilization of 4G          • Dynamic spectrum sharing (DSS) will support
                                                                                                                  • Data consumption with higher bandwidth
      • Main attraction and landmark                     seamless capacity allocation between 4G and 5G

                                                                                                                                                                16
5G ecosystem with firm support on both devices and equipment

    More 5G devices with lower price forthcoming by end-2020                                       5G statistics and device ecosystem

Expect over 250 model of                   5G handset starting price (USD)
5G mobile devices by end-2020                                                             Over 26.1 million 5G subscribers in China as of Feb20
                                                                                          Expecting164 mn 5G subscribers in China by end of 2020
                                                   500
                                                              300       150*
                                                                                          381 Operators with 5G investment plan
           Over                                                                           Out of 816 total operators worldwide had announced they
                                                   2019       2020      2021
         40 models                                                                        were investing in 5G
                                           •       Current 5G handset model is            63 Operators providing 5G for mobile
                                                   offered as low as USD500.              and 34 operators launched 5G FWA home broadband
                                           •       More affordable models are             services
                                                   expected from end of 2020
                                                                                           12 Operators deploying mmWave
           1Q20 2020      2021                                                             (Inc. n257, n258, n261, and n260)
                                          *Source: GSMArena

FWA devices                                                                                250+ Devices
                                                                                           had been announced for 5G compatible. Increasing 50
•    FWA equipment (router) price will
                                                                                           models from Jan 2020 to Mar 2020
     also be driven down as market
     particularly in China grows.                                                         40 mobile phone
                                                                                          commercially available and ready for 5G
                                                                                           13 CPE devices (Customer Premised equipment)
              Huawei launched 5G CPE (Consumer
              Premise Equipment) Pro in Feb 2020                                           Commercially available.

                                                                                 Source: GSA Mar 2020 (5G Data as of Dec2019)
Reinforced 4G with new spectrum
   4G still accounts for half of global connections in 2025                                  4G remained primary network as
                                                                                         5G helps offloading capacity in dense area
*5G adoption in Thailand is expected to be faster than global average

% of Global connections by technology
                                                                   Global average
  70%
                                                                   4G   56%                                            4G coverage remains the
  60%                                                                   2025
  50%
                                                                                                                       overlaying network across
                                                                                                                       the country
  40%                                                              5G    20%*
  30%                                                                    2025

  20%                                                     3G 18%

  10%                                                     2G 5%

   0%
         2017 2018 2019 2020 2021 2022 2023 2024 2025
  Source: GSMA

  Device Compatibility              Technology trend by connection
  on AIS network                    by GSMA
  as of 4Q20
        2600MHz                         4G
                                        Expected usage of 4G starting to
        17 million devices
                                        decline after 2023
                                                                                    4G/5G Dynamic spectrum
        700MHz                          56%                                         sharing will densify network
                                        of total global connection in the           capacity in appropriate area.
        12.5 million devices
                                        next 5 year still rely on 4G
Deliver new
                                                       experience with 5G

Bring In   Pioneer Digital
             Enterprise

 New
Catalyst

                             Expand market potential
                                  with 5G FWA

                                                                            19
Mobile: Deliver new experience with 5G
             Solution creator to offer premium package                                     Drive Top-Tier Consumers “Upgrade"

 •        Co-create with partners to offer aggregated AR, VR and              Target offering
          content services to mobile package                                         Data speed: 1000+Mbps Mbps (unlimited data)
                                                                                  Blended ARPU (Bt/month)
                            Core Innovative Services
                                                                                                                                             980      790
                            1) New Immersive Experience and seen the Unseen                                              514
                                                                                             402         251                       307
                                                                                   245
                                with 4K & VR (Live & Special Contents)
                            2) New Augment Reality Experience                       2G        3G         3G              4G        4G        5G       5G
         Content bundling   3) e-Sport & Gaming (The lowest Latency)                        May-13                   Jan-16                Jun-20E   Dec-21E
             package
                                                                              •     The transition from 4G to 5G will benefit AIS

                                                                                          Higher ARPU boosted by 5G adoption
                                                                              •     Many service providers are creating 5G packages aimed at
                                                                                    capturing extra value.

                                                                                                     5G ARPU uplift                      Blended ARPU uplift
                                                                                                     (from 4G upgrade)

                                                                                    China Telecom       ▲10%                   SK Telecom ▲1.3% QoQ

     •     Innovative Services & Quality improvements will drive the                China Mobile        ▲6.5%                  KT Corp     ▲0.5% QoQ
           demand within the 5G technology cycle

                                                                                                                                                            20
Broadband: Expand market potential with 5G FWA
 Fill-in broadband gap with FWA
Broadband underserved market: 5G-FWA has potential to supplement the coverage of                           Expected broadband market size
                                                                                                           in 2030
home broadband, extending the service to remote or fibre-inaccessible areas
      2020                   2021                   2022                     2023                   2024

             Urban Area
                                                                                                                     ~15mn         ~10%-15%
• Inaccessible condo/villas/town houses
• Underserved condo (copper technology)
Rationale
                                                                                                             2030E household            %FWA
• Spectrum availability: Mainly on the 2600MHz range
                                                                                                              with broadband     of total broadband
• FWA CPE will likely remain limited and at high price level
                                                                                                                connection            connection
                                                           Suburb area
                           • Populated suburb area
                                                                                                           • Broadband market in Thailand is
                           Rationale                                                                         expected to grow with 4% CAGR.
                           • Increase FWA CPE affordability
                                                                                                           • FWA will be supplement and as the
                                                                                                             areas have increased utilization, fibre
               FWA to supplement                                   FBB remains key technology                connectivity will be more efficient to
    Faster rollout to penetrate new area                         Reliable speed and connectivity           serve demand.
    No or minimal installation at home                           High investment for last mile
    Easier and lower maintenance                                  installation (dedicated last mile)
    Leverage under-utilized spectrum in suburb area              Investment feasible in area with high
    May not be feasible in area with high mobile data             utilization
     utilization which exhausts spectrum
                                                                                                                                                 21
Enterprise: Opportunity for large scale offering
5G product framework for business

                                                Industry Estate (IE) Strategic Partnership
                                Industry
                                Solution

                                                           1)   Remote control application
                                                           2)   Digital signage
                          Product Solution                 3)   VR/MR/AR
                                                           4)   Drone
                                                           5)   VDO Analytics

                                                                     1) FWA-EDS: Bangkok and EEC
                            Infrastructure                           2) Multi-Access Edge computing (MEC)
                         (Public & Private Network)                  3) Private Network

                                                                          Lifting up ARPU and brand
                          General Mobile 5G                                    Special campaign to enterprise top
                                                                               executives mobile users to adopt 5G
                                                                               device (Target 10k sub by end 2020)

                                                                                                                     22
Enterprise: Pioneer digital enterprise

                 Industry                          Smart Factory
                 solution

                 Product
                 solution

                                Digital Signage              Drone       Data center VR Tour

               Infrastructure                                         Multi-Access
                                                  FWA-EDS            Edge computing

                General                5G enterprise
               Mobile 5G              mobile package

                                                                                               23
2020 outlook

               24
2020 as a challenging year for telecom sector
                                 Weak economy led to                                         COVID-19 impact might continue throughout 2020
                              slowdown in telecom growth
                                                                                           Effect from partial lockdown
YoY growth

             5%                                                                             Telecom shop closure across the country         Acquire new subs with
                                                                                            •   Decline in handset sale                     alternative channels;
             -5%                                                                            •   Bar activities for new acquisition both     online, direct sale,
                                4Q16            4Q17              4Q18              4Q19        prepaid and postpaid                        temporary shops
                    GDP yoy            AIS core service revenue          Indutsry           Enterprise clients implement cost control       Cross sell digital
                                                                                                                                            solutions to strengthen
                   Positive drivers                        Negative drivers                                                                 enterprise portfolio
                                                                                            Revenue loss from tourists and roaming
• Ongoing social distancing                       • Rising unemployment
Continued movement restriction                    • Businesses shutdown
                                                  • Severe drought                         Opportunity loss and cost incurred from NBTC measures

                                                                                             Measures from NBTC to support subscriber       Cross sell opportunities
              GDP growth 2020 outlook forecasted by BOT, World bank, ADB,                                                                   to raise revenue after free
                                                                                             during COVID
               local and foreign research firms are in range of -4.8% to -6.7%                                                              data/min used up
                                                                                             • 10Gb free data subsidized
                                                                                               by NBTC budget of Bt100/subscriber
             Resilient in nature to the economic downturn, telecom normally
                                                                                             • 100 mins free on/off net call for all
                         performs ahead of the general GDP trend.                              subscribers
Revenue outlook by segment
                                                                                           Weak consumer spending led to revenue pressure
 •            Mobile business                      ARPU            Sub
                                                                                            Rising bad debt from extended payment terms     Extend payment period to
                                                                                                                                            support and retain
 •            Fixed broadband                      ARPU            Sub                                                                      customer in long term

 •            Enterprise business                  Enterprise      Solution                 Delay cash flow required more working capital   Prepare source of funds
                                                   Mobile                                                                                   for stress case       25
Cost management to minimize impact on profitability
             2020 Cost saving initiatives to offset incremental cost from 5G investment and operating

Cost of service                                                     SG&A

•   Network depreciation – Capex saving on 4G/5G with Dynamic       •     Marketing expenses
    spectrum sharing (DSS) technology                                      • Slowdown marketing activities
                                                                           • Decline in handset subsidy
•   Network operating cost –
     • Optimize network operation cost with 4G/5G site co-          •     Admin and other expense
         location                                                           •  Headcount control to manage staff cost
     • Negotiate with vendors and landlord to reduce expenses               • Shop space rental saving

•   Other cost of service – Selective spending on contents for TV
    platform
                                                                        If COVID-19 situation prolonged, further cost measures
•   Revenue-related cost such as regulatory fee and prepaid
    commission varies following decline in revenue                           will be considered based on evolving situation

                                                                                                                             26
Staggered payment profile of spectrum and capex
          CAPEX for 4G/5G network                   Investment rationale for 4G/5G                          Payment profile of spectrum
(Bt bn)                                                                                              (Bt bn)                                  2600MHzx100MHz
                                    35-40*          Total network capex of Bt35-40 bn
                                                                                                                                              1800x20MHz
                                    35-40                                 Investment cost sharing                                             900x10MHz
                                                                          with Multi band & Multi
                                                                          technology on 2600MHz      28.6                                     700x15MHz

                                                            4G                    5G                  2.0
                                                                                                      3.1
    46
              36                                                                                               14.2                 13.9
                                                                                                     21.7       3.1       11.0       2.9
                     23      20
                                                                                                                7.6        7.6        7.6       6.4        4.7
                                                                                                                                                2.9        2.9
                                                                                                     1.8        3.5        3.5        3.5       3.5        1.8
    2016     2017   2018     2019    2020E                                                           2020       2021    2022-2024    2025     2026-2029    2030
                                                                                                                         per year              per year
•   CAPEX 2020 raised from network expansion
                                               Minimize pure 4G               Add 5G coverage
      • 4G capex for capacity expansion on     investment                     in potential are for
        2600Mhz                                                               brand perception
      • 5G capex for launch network
        coverage with 2600 Mhz                                                                                 Total of Bt125bn* toward 2030
                                                    Ongoing 5G capex plan over long term
•   Saving on 4G investment as equipment            varies by following factors
    compatible for both 4G/5G technology        •    5G commercial use cases in the market
                                                •    Customer adoption rate
                                                •    4G to 5G migration                               *26GHz license payments of Bt5.3bn to be made within 1 year
                                                                                                      after official announcement from NBTC on 16 Feb 2020

                                                                                                                                                              27
Solid operating cash flow,
      while maintaining financial commitment in uncertainty
                Positive operating cash flow even after CAPEX                                                                                                             Sufficient debt capacity

             Solid cash flow from operation                                                                                                        Funding alternatives prepared for uncertainty
            (Bt bn)
                                                                                            Cash increase                          Cash decrease        Cash on hand of Bt30,557mn
                           Operating             Investing                                  Financing                             Net cash
                        23.0                                                                                                                            Credit facility available to drawdown
                                                                                                                                   10.9
                                                                                                                                                    •        Over Bt52bn of short-term and long-term credit facility prepared
                                              5.9                                                                                                            for uncertainties
                                                      2.0                                                        2.9
                                   0.5                                   0.2                  0.6
                                              CAPEX
                       cash flow

                                               Cash

                                                                                                                                        Cash
                                                                                                                          paid
                                    Income

                                                                                               Finance cost

                                                                                                              Lease liabilities

                                                                                                                                   increased
                       Operating

                                   tax paid

                                                                         Investment in JV
                                                      Spectrum license

                                                                                                                                                        Opportunity to tab into bond market
                                                                                                                                                    •        Investment grade credit rating
                                                                                                                                                            • Fitch: national rating AA+ (THA), outlook stable
                                                                                                                                                            • S&P: BBB+, outlook stable

             Operating cash flow trend impacted from COVID-19 in late
             Mar-20, yet remained solid

             Maintain investment plan                                                                                                              Strong financial flexibility
               Capex plan 2020                                                                                                                          Internal target for financial ratio
                   • Network capex of Bt35-40bn                                                                                                         •     Net debt to EBITDA under 2.5-3.0* times
                   • Spectrum payment of Bt29bn

*Net debt to EBITDA ratio based on S&P method                                                                                                                                                                                   28
Appendix

           29
1Q20 Summary
Impact from the pandemic COVID-19                                              Secure long term competitiveness with 5G
• The COVID-19 pandemic has affected telecom from early February with          • Strong spectrum portfolio to deliver best 5G service in both short and long
  faded tourist both inbound and outbound                                        term. New revenue opportunities includes ARPU uplift in mobile broadband
• Partial lock down resulted in shops temporary closed and caused                with new use cases, FWA and digital business.
  slowdown in top up revenue and new acquisition both on mobile and            • Strengthen 4G network coverage and capacity with 700Mhz and 2600Mhz
  fixed broadband.                                                               ready to serve over 16million compatible devices.
• Rising mobile data usage and demand for home broadband are offset
  with discount and unlimited data plan offering which continued to
                                                                               Maintained profitability performance
  pressure ARPU.                                                               • Core service revenue was Bt33,090mn, flat YoY but decreasing 4.3% QoQ.
• Measures to enhance sales channel include ramping up online sales,           • With careful cost control, EBITDA was Bt19,576mn or +3.8% YoY with
  telesales, utilizing more smaller size local dealers and pop-up shops.         margin of 45.7%. Net profit was Bt7,004mn, decreasing 7.5% YoY and 0.9%
                                                                                 QoQ mainly from new spectrum, network investment, and FX loss.

Mobile revenue impacted from roaming and competition                           2020 Outlook
 • Internal roaming and prepaid tourist SIM which normally contributes 2% of    • Capex Bt35-40bn with added investment in 2600MHz to support both 4G
   mobile revenue declined >40% YoY, QoQ.                                         and 5G
 • Postpaid acquisition and handset subsidy also slowdown due to temporary      • Despite negative outlook due to ongoing COVID-19 impact and severe
   shop closure.                                                                  drought, telecom is relatively resilient to the downturn and normally
 • Price competition in form of unlimited data plan continued to pressure         performs ahead of the general GDP trend
   revenue growth.                                                              • AIS will be focusing on mobilizing operational responses to protect and
                                                                                  grow revenue while managing cost to ensure resilient cash flow and
Demand in home broadband emerged in late March                                    profitability.
 • Withdrawal of discount offerings causes slowdown in FBB sub acquisition,     • AIS is expected to continue generating positive cash flow after network
   hence slower pace of revenue growth in 1Q20                                    investment and has sufficient credit facilities.
 • Demand for home broadband due to lockdown arrived in late March while
   subscription came under discount offerings for work-from-home and
   students.
                                                                                                                                                       30
Strong Balance sheet and cash flow to support investment
                                             Balance Sheet                                                                                   1Q20 Cash flow
(Bt bn)                                                                                                                   (Bt bn)                                      Cash increase                              Cash decrease
   Right-of-use asset Bt65bn
                                  right           others A/P                                                                    Operating   Investing                                      Financing                             Net cash
   incurred from long term                                                spectrum
                                 of use
   contracts mainly including                                             license
   2100MHz agreement and                           21 39                  payable
                                          65                                                                                  23.0
   tower rental                                                     80
                                                                                                                                                                                                                                    10.9
                   spectrum             Assets         Liabilities                                                                          5.9
                     license 118                                                                                                                    2.0                                                         2.9
                                                                                  interest-                                          0.5                               0.2                    0.6
                                                                   310    94      bearing
                                                   B/S

                                                                                                                                            CAPEX
                                                                                                                                             Cash
                                                                                                                              cash flow

                                                                                                                                                                                               Finance cost
                                                                                                                                                                                                                        Lease

                                                                                                                                                                                                                                    increased
                                                                                                                                                                                                                                         Cash
                                                                                                                                Income
                                                                                                                               tax paid
                                                                                                                              Operating

                                                                                                                                                                                                              liabilities paid
                                                                                                                                                                        Investment in JV
                                                                                                                                                    Spectrum license
                                      375                                         debt
                                                   1Q20

                      PPE                              Equity            64
                                 122                                           lease          Lease liability Bt64bn
                                                         65                    liability
                                                                    32                        incurred at the beginning
                                                              40                              period was the amount
                                A/R          18         25               others
                                                  31                                          of the right of use.
                                      cash                      retained earnings
                                                       others                                                               Operating cash flow was in healthy level to support
                                                                                                                            CAPEX, debt repayment, and dividend payment.
                            0.7x                                              1.5x                                          Investing cash flow was Bt8.1bn, which included
                    Net debt to EBITDA                              Interest bearing debt                                   spectrum license payment of Bt2.0bn
                                                                          to Equity                                         Average finance costs = 3.0% p.a.
                                                                                                                            • Maintained investment grade credit ratings
                            0.4x                                              42%                                             • Fitch: national rating AA+ (THA), outlook stable
                        Current ratio                                Return on Equity                                         • S&P: BBB+, outlook stable

                                                                                                                                                                                                                                                31
Best position to lead into 5G era
1           Strong & competitive spectrum portfolio             2   Strengthen 4G network quality and capacity to compete
                                                                         4G technology as main connectivity's over the next 2-3
                  Secure long term competitiveness                       years
                  Strong spectrum portfolio to deliver
                                                                         5G network investment in selective locations to support
                   best-in-class 5G services
                                                                          4G capacity

                                                                          Majority of 5G CAPEX to      Sizable device readiness
                                                                                 support 4G               on 4G-2600/700MHz

                                                                                    80%                          57%

       Efficient investment with enhanced flexibility                    80% of 5G CAPEX deploy        Over 17mn smartphones
             Enhance coverage and capacity from complete                multi-band multi-technology    or 57% of devices on AIS
              set of bandwidth from low, mid to high band                to concurrently support 4G     network with 4G ready on
             Optimize investment and operating cost with new                                              700Mhz or 2600Mhz
              technology that can support both 4G and 5G

                                                                                                                                   32
Best position to lead into 5G era
3                                  Bring in new catalyst                        4               Retain solid financial strength

    Consumer
                                                                                    Amidst pandemic and after
    Enhanced                         Growing core business                          • Mobilize operation to protect revenue and grow certain
    Mobile Broadband
    Faster and better experience
                                     • Connectivity revenue                           revenue segment
                                     • Established business model                   • Manage cost and cash flow resiliency
                                     • Telco-industry competition                   • Continue our investment plan and deliver financial
    Fixed
                                                                                      commitment
    Wireless Broadband               • Cross function operating model
    High capacity

                                                                                                            Under
    Enterprise
                                                                                                        2.5-3.0*
      Growing beyond core – B2B/B2B2C
      • Capturing revenue beyond connectivity                                                                 times
      • Emerging use cases and business models                                                            Net debt
      • Cross-industry competition                                                                       to EBITDA
      • Partnership platform operating model                                           Maintain healthy financial ratio after including
                                                                                         all new spectrum liability and investment
     Massive                           Mission Critical
     Internet-of-Things                Enablement
    Efficiency and low-cost            Ultra-low latency and high reliability

                                                                                                    *Net debt to EBITDA ratio based on S&P methodology

                                                                                                                                      33
New Business Models
Solution Enabler & Solution Creator”

                 Today                                   Solution Enabler                               Co-Creation

                    AIS                                             AIS                                      AIS

                                  Billing on Behalf                                                                    Rev Sharing
       $$                                                                            $$                                    $
                                      $                                                            $$
                 Bearer                                              Enabler
                 Service                                             Service                               Service
                                                                                                               Co-Create
                     $$
                                                                    $$
                                  3rd party                                       3rd party                            3rd party
    Customers                                         Customers                                Customers
                                  Services                                        Services                             Services
                Digital Service                                 Digital Service
                     (OTT)

        Mobile Internet Model                          Business Model & Monetization           Business Model & Monetization
                                                       B2B2X: Usage, speed, latency,          Operator aggregated AV, VR and
                                                       reliability, Naas, Network slicing,    content services, Convergent offer,
                                                       API, MEC, SLA                          sponsor data, advertising

                                                                                                                                     34
New normal after COVID
Customer going digital
                                                                                          Moving toward        •   Renewed channel strategy
My AIS application                                                             Digital    online channel,
as one-stop service                                                           Channel                          •   Accelerate serving customer via digital
                                                                                          reducing footprint
on mobile touch point                                                                                              platform

                                     •   Enhance AI Chatbot
                                         to serve customers
                                         on personalized level
                                                                                          Opportunities to     •   Digital mobile brand
                                                                              Digital     capture demand
 •         Introduce new AI call center agent with                           Solution     from new normal      •   Enterprise and SME customers seek new
           80% target customer satisfaction                                                                        solutions to sustain

 Leap adoption on all digital channels during
 pandemic

                                                                PAYMENT
                                                                                                               •   Potential to move portion of workforce to
                                                                                          Cost reduction
 5.5 mn            4.9mn                 8.8mn             6.2mn
                                                                              Digital                              work from home
     active user   transactions in       transactions in   transactions in   Disruption   across the work
                       Mar20                 Mar20             Mar20
                                                                                          processes            •   Operating cost reduction from digitalized
     +39%           +14%                   +3%                +9%                                                  organization
       QoQ            QoQ                  QoQ                QoQ

                                                                                                                                                               35
You can also read