Investor Presentation - Citi Global Property CEO Conference March 2019 - Park Hotels & Resorts

Page created by Kathryn Stevens
 
CONTINUE READING
Investor Presentation - Citi Global Property CEO Conference March 2019 - Park Hotels & Resorts
Investor Presentation
                          Citi Global Property CEO Conference
                          March 2019

Waldorf Astoria Orlando           Hilton Chicago                Hilton Hawaiian Village Waikiki Beach Resort
Investor Presentation - Citi Global Property CEO Conference March 2019 - Park Hotels & Resorts
Mission
              To be the preeminent lodging REIT,
          focused on consistently delivering superior,
        risk-adjusted returns for stockholders through
     active asset management and a thoughtful external
         growth strategy, while maintaining a strong
                  and flexible balance sheet

2|
Investor Presentation - Citi Global Property CEO Conference March 2019 - Park Hotels & Resorts
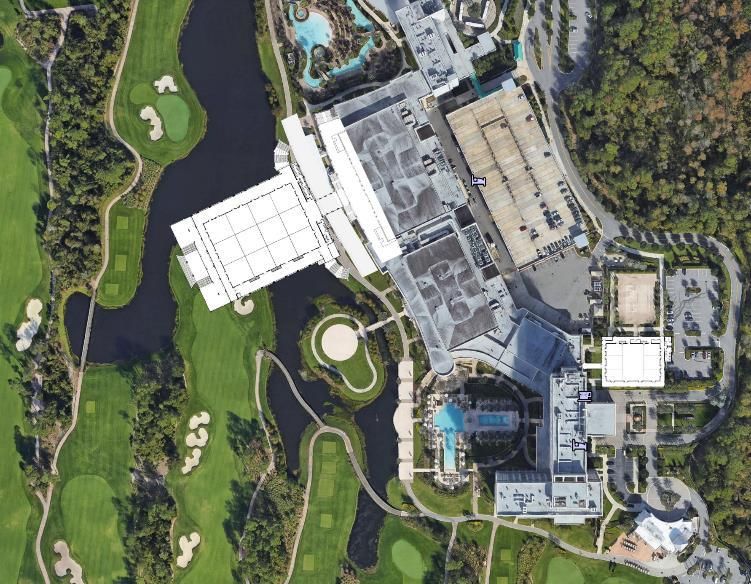
Pillars of our Corporate Strategy

        Aggressive Asset Management

⚫ Continually improve property level operating performance
⚫ Consistently implement revenue management initiatives to optimize market pricing /
  segment mix

                                                                                                  Hilton Chicago

       Prudent Capital Allocation

⚫ Allocate capital effectively by leveraging scale, liquidity and M&A expertise to create value
  throughout all phases of the lodging cycle
⚫ Employ an active capital recycling program—expanding our presence in target markets with
  a focus on brand and operator diversification, while reducing exposure to slower growth
  assets/markets
                                                                                                  Hilton Waikoloa Village
⚫ Target value enhancement projects with strong unlevered ROI yields

        Strong and Flexible Balance Sheet

⚫ Preserve a strong and flexible balance sheet, with a targeted leverage ratio of 3x to 5x
⚫ Maintain strong liquidity across lodging cycle and access to multiple types of financing
⚫ Aspire to achieve investment grade rating
                                                                                                  Juniper Hotel Cupertino, Curio Collection

3|
Investor Presentation - Citi Global Property CEO Conference March 2019 - Park Hotels & Resorts
Corporate Strategy: Delivering Results
  Strategic Pillars                                                           2018 Scorecard

                                                      ✓ RevPAR: +2.9% → 65bps above peers
            Operational                               ✓ Margins(1): +60bps → 60bps above peers
            Excellence                                ✓ Grouping Up: +80bps to 32% for Pro forma
                                                        Comp Top 25 hotels(2)
                                                                                                                                                      Hilton New York Midtown

                                                      ✓ Asset Sales: 13 non-core assets for $519M at a
                                                        blended 13x 2017 EBITDA multiple; International
              Capital
                                                        exposure decreased to just 1% of EBITDA
             Allocation
                                                      ✓ Buyback: Bought back 14M shares at a significant
                                                        discount to NAV ($24.85/share) for $348M

                                                      ✓ Leverage: Net leverage of just 3.7x                                                           Hilton Waikoloa Village
           Strong Balance
                                                      ✓ Liquidity: $1.2B of liquidity
               Sheet
                                                      ✓ Debt: 5.6 years maturity; 4.1% average debt cost

                                                      ✓ Performance: Outperformed hotel REITs(3) by
                                                        1,380bps and S&P 500 by 390bps
                 Results
                                                      ✓ Dividends: $2.74/share (~$555M+ paid out);
                                                        recently increased dividend by 4.6%                                                           Casa Marina, a Waldorf Astoria Resort
    Note: Peers include all publicly-traded, full-service hotel REITs with a market cap over $1 billion
    (1) See Appendix for our definitions and for reconciliations to comparable U.S. GAAP measures. Our definition of Hotel Adjusted EBITDA margin may not
         be comparable to similarly titled measures of our peers. Based on most recently available / restated financial statements from their respective
         quarterly earnings releases.
4 | (2) Pro forma to exclude Hilton Chicago O’Hare, which is no longer part of Park’s portfolio due to the expiration of its ground lease on 12/31/18
    (3) Includes all publicly-traded hotel REITs with a market cap over $1 billion
Investor Presentation - Citi Global Property CEO Conference March 2019 - Park Hotels & Resorts
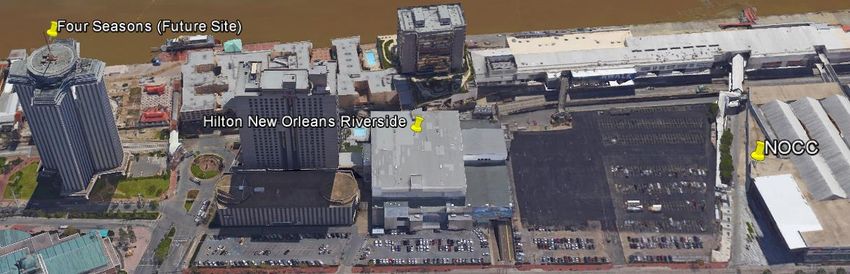
Park’s Investment Thesis: Well Positioned in 2019
                                      ✓ Our Comp Top 25 RevPAR (90% of EBITDA(1)) in ‘18 was
                                        $188—5% above peers
   High Quality
    Portfolio                         ✓ 2018 RevPAR growth of 2.9% → 65bps above peers
                                      ✓ 2.3% weighted average supply exposure through 2020 →
                                        80bps below peers

                                      ✓ 2019E RevPAR growth of 2% to 4% → 120bps above peers
                                                                                                                  Signia Hilton Bonnet Creek
     Sector                           ✓ 2019 Group pace for consolidated portfolio → 10%+
    Leading
 Fundamentals                         ✓ 2019 Group pace for HI, SF, Chicago and NYC → 14%+
                                      ✓ 2020 Group pace → 9%

    Margins to
                                      ✓ Despite rising cost pressures, margins estimated to
  Improve in ‘19                        increase 30bps (midpoint) or 50bps+ above peer group
                                        average
                                                                                                                  Waldorf Astoria Orlando Golf Club
                                     ✓ At 3.7x net leverage and $1.2B of liquidity, ample liquidity
     Financial                         to execute on our strategic initiatives with a long-term
     Flexibility                       targeted leverage ratio of 3x to 5x

                                     ✓ Park has developed a near-term track record of success:

  Track Record
                                                 ✓      Generated sector-leading total returns for share-
   of Success                                           holders since spin (+2,670bps vs all hotel REIT peers);
                                                 ✓ While narrowing the valuation gap with peers
                                                                                                                  Parc 55 San Francisco - a Hilton Hotel

5 | Note: Peers include all publicly-traded, full-service hotel REITs with a market cap over $1 billion
    (1) Represents 2018 Adjusted EBITDA
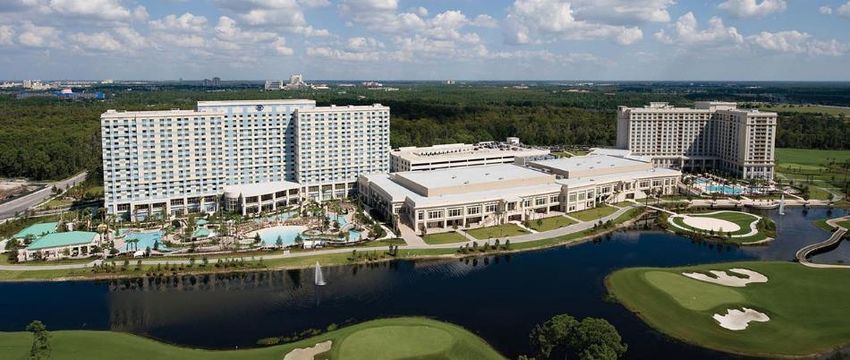
Investor Presentation - Citi Global Property CEO Conference March 2019 - Park Hotels & Resorts
Park Team

                                                                  Chairman, President
                                                                        & CEO
                                                                     Tom Baltimore

Executive Management
     EVP, CFO &                                         EVP, GC                                                                   EVP, Asset
                                    EVP, D&C                                         EVP, HR             EVP, CIO
      Treasurer                                                                                                                  Management
                                    Carl Mayfield      Tom Morey                     Jill Olander        Matt Sparks
     Sean Dell’Orto                                                                                                              Rob Tanenbaum

Senior Management

                      SVP, FP&A                     SVP, CAO                             SVP, Strategy                 SVP, Tax
                      Diem Larsen                   Darren Robb                           Ian Weissman                 Scott Winer

Park Management                                                          Board of Directors
➢ 25 years average experience among senior                               ➢ Best-in-class board including former CEOs and
  leadership                                                               CFOs of Fortune 500 Companies
➢ Total of ~90 employees at Park Headquarters                            ➢ Significant REIT experience across industries

6|
Investor Presentation - Citi Global Property CEO Conference March 2019 - Park Hotels & Resorts
2018 Accomplishments
     Operating Results:

                    6.5%                                         2.9%                                         60bps                                        80bps to 32.0%
                                                                                                           Comp Hotel                                      Pro forma Comp Top
                 AFFO/Shr                                       Comp
                                                                                                           Adj EBITDA                                       25 Group Revenue
                  Growth                                       RevPAR
                                                                                                             Margin                                                Mix(1)
     Capital Allocation:
            13                                $519M                                              $1.4B                                                           $348M
     # of Hotels                              Asset Sale                                         HNA                                                             14M Shares
       Sold(2)                                Proceeds(2)                                     Secondary                                                        Bought Back at
                                                                                               Offering                                                        Discount to NAV
     Shareholder Returns:

           -0.5%                                    1,380bps                                                           7.7%                                       9.3%
            2018             PK’s Relative           2018 PK            Annual Increase
            Total          Outperformance            Dividend            in PK Dividend
           Return(3)          vs. Peers (4)           Yield (3)
              Since early 2017, Park has returned nearly $1.9B of capital to shareholders(5)
     (1)   Pro forma to exclude Hilton Chicago O’Hare, which is no longer part of Park’s portfolio due to the expiration of its ground lease on 12/31/18
     (2)   In February 2019, Park sold the Pointe Hilton Squaw Peak Resort for $51M, bringing total assets sold to 14 for total proceeds of $570M
     (3)   As of 12/31/18
7|   (4)   As of 12/31/18; peers include all publicly-traded, full-service hotel REITs with a market cap over $1 billion
     (5)   Return of capital includes both dividends and stock repurchase
Investor Presentation - Citi Global Property CEO Conference March 2019 - Park Hotels & Resorts
Park Continues to Outperform

Total Return Performance Since Spin: 1/4/17
                 40.0%              36.5%
                 35.0%

                 30.0%                                      28.4%
                                                                                                                                 +2,670bps vs.
 Total Returns

                                                                                                                                Hotel REIT Peers
                 25.0%

                 20.0%

                 15.0%                                                               11.4%             11.1%
                                                                                                                   9.8%
                 10.0%

                   5.0%

                   0.0%
                                      PK                   S&P 500                     HST             RMZ     Hotel REITs(1)

Total Return Performance: YTD 2019
                 25.0%
                                    20.7%
                 20.0%                                      18.4%                    18.2%

                                                                                                                                +230bps vs. Hotel
 Total Returns

                 15.0%                                                                                 12.9%
                                                                                                                  11.8%

                 10.0%                                                                                                             REIT Peers
                   5.0%

                   0.0%
                                      PK                Hotel REITs(1)                 HST             RMZ       S&P 500
                 Source: FactSet; data as of 2/26/19
8|               (1) Peers include all publicly traded hotel REITs with a market cap over $1 billion
Investor Presentation - Citi Global Property CEO Conference March 2019 - Park Hotels & Resorts
4Q18 Performance and 2019 Outlook
4Q18 Operating Results

                    3.6%                                          40bps                                                3.8%                   23%
                  Comp                                         Comp Hotel                                            Group                 Increase in
                 RevPAR                                        Adj EBITDA                                           Revenues              ‘Other Hotels
                                                                 Margin                                                                    Revenues’(1)
2019 Outlook
                                                               Metric                                                          Guidance
                                      Comp RevPAR Growth:                                                                   +2.0% to +4.0%
                                      Comp EBITDA Margins:                                                                  +0bps to +60bps
                                      Adjusted EBITDA:                                                                      $745M to $775M
                                    Note: Guidance as of 2/27/19. Not being updated or reconfirmed via this presentation.

9 | (1)   Ancillary hotel revenues for our comparable hotels
Investor Presentation - Citi Global Property CEO Conference March 2019 - Park Hotels & Resorts
Company Highlights
     Park Hotels & Resorts is a leading lodging real estate investment trust with a diverse portfolio of iconic and
         market-leading hotels and resorts with significant underlying real estate value in top U.S. markets

                                                                                                                                                               2018
Leading Properties(1)                                                                                                                                     Performance(2)
52 premium-branded hotels and iconic resorts                                    with nearly 31,000 well-maintained rooms                                       82%
                                                                                                                                                               Total
85%+ of rooms in luxury and upper-upscale segments                                                                                                           Occupancy
26 properties with 25k+ sq. ft. of meeting space and 9 properties with 125k+ sq. ft. of
meeting space                                                                                                                                                  $212
                                                                                                                                                             Total ADR

                                                                                                                                                               $174
                                                                                                                                                            Room RevPAR

                                                                                                                                                               $208
                                                                                                                                                             Avg. Room
                                                                                                                                                               RevPAR
  DoubleTree Hotel Washington DC – Crystal City                                      Waldorf Astoria Orlando
                                                                                                                                                              of Top 10
                                                                                                                                                              Assets(3)

                                Hilton Miami Airport                                                              Hilton Boston Logan Airport

     (1)   As of 2/27/19
     (2)   Total consolidated Hotel Occupancy, ADR and RevPAR; excludes unconsolidated joint ventures and non-comparable hotels, unless otherwise noted
10 | (3)   Top 10 TTM RevPAR includes Hilton Waikoloa Village, which is non-comparable in 2018
Size and Scale: Park Twice the Size of Most Lodging REITs(1)

                                                         Park is the second largest publicly traded Lodging REIT

                              $20.0

                                                     Full Service                                                                                                  $17.7
                              $18.0
                                                     Mixed & Limited Service
                              $16.0

                              $14.0
       Enterprise Value (B)

                              $12.0

                              $10.0
                                                                                                                                                            $9.1

                               $8.0                                                                                                                  $7.5
                                                                                                                                              $6.7

                               $6.0                                                                                                    $5.6
                                                                                                                                $5.2
                                                                                                                         $4.8
                                                                                                                  $3.9
                               $4.0                                                                        $3.4
                                                                                                    $3.0
                                                              $2.3         $2.5        $2.5
                               $2.0               $1.6
                                      $1.3

                               $0.0
                                      BHR        CLDT          INN        CHSP          HT          DRH    XHR    SHO    AHT    APLE   RLJ    RHP    PEB    PK     HST

                 Source: Public company filings as of 12/31/18 and S&P Global. Market data as of 2/26/19
11 |             (1) Assumption excludes HST from calculation
Diversified Asset Types & Markets
    High Barrier to Entry Urban                                                                                                                           Select Suburban and
      and Convention Hotels                                                          Landmark Resorts                                                    Strategic Airport Hotels

                                                                             Hilton Hawaiian                                                         DoubleTree Hotel
     New York Hilton                  Hilton San Francisco                                                       Hilton Waikoloa                                          Hilton Boston Logan
                                                                          Village Waikiki Beach                                                      Washington DC –
        Midtown                           Union Square                                                                Village                                                    Airport
                                                                                  Resort                                                               Crystal City
        1,878 rooms                        1,921 rooms                                                            1,110 rooms (1)                                              599 rooms
                                                                                2,860 rooms                                                              627 Rooms

                                                                                                             Waldorf Astoria Orlando/
                                      Hilton New Orleans                    Casa Marina, a                                                                                Hilton McLean Tysons
      Hilton Chicago                                                                                              Hilton Orlando                   Hilton Miami Airport
                                           Riverside                     Waldorf Astoria Resort                                                                                  Corner
        1,544 rooms                                                                                                Bonnet Creek                          508 rooms
                                           1,622 rooms                           311 rooms                                                                                     458 rooms
                                                                                                                    1,511 rooms

     Note: room count as of 12/31/18
     (1) Includes approximately 470 rooms that became part of HGV as part of the spin-off and that we reserved exclusive rights to occupy and operate.
12 |      At the end of December 2019, we are required to release these rooms back to HGV for its renovation and use
Portfolio Diversification(1)
 Location Type(2):                                                                                Markets(2):                                                       Revenue Segmentation:
            Suburban                                                                San Diego, 3%                  Int'l, 1%                                                          Other
                                                                                                                                                                         Contract
               5%                                                                                                                                                                      2%
                                                                                    Key West, 4%                                                                           5%

                                                                         DC Metro, 4%
            Airport                                                   Chicago, 4%
             13%                                                                                                                                                                               Group
                                                                                                                                                                                                31%
                                                                                                                           Honolulu, 20%
                                                      Resort
                                                       44%                        Waikoloa, 4%

                                                                                  New York, 7%
                                                                                                                              Orlando, 13%
            Urban                                                                                                                                                         Transient
             38%                                                                                                                                                            62%

                                                                 New Orleans,
                                                                     7%                                  San Francisco,
                                                                                                              13%

    ⚫ Over 80% Urban / Resort                                   ⚫ 45% exposure to Hawaii, San Francisco, DC and Key                                           ⚫ Park’s “Grouping Up” strategy targets
            exposure                                              West – all with less than 2% projected supply                                                 400 bps shift in Group demand
    ⚫ Continuing to reduce Airport /                                 growth over next 2 years                                                                   among Top 25 hotels
      Suburban exposure via capital                             ⚫ 13% exposure to San Francisco, which is projected to                                        ⚫ Removing Chicago O’Hare, Comp 2018
      recycling initiatives                                                                                                                                     Top 25 group mix was 32%, or 80bps
                                                                  see a 78% increase in convention center room
                                                                  nights in 2019, totaling over 1.2M room nights                                                comparable improvement over 2017

                                                                ⚫ Target markets include DC, Boston, Miami and SoCal                                          ⚫ Transient strategy of 50/50 split
                                                                                                                                                                between Leisure and Corporate
                                                                ⚫ International exposure at just 1%, down from 5%                                               demand
                                                                  prior to 2018 dispositions
      (1)    Calculated using results for the year ended 12/31/18 for the hotels we currently own or have an ownership interest in; pro forma to exclude YTD
             2019 dispositions as well as removal of Hilton Chicago O’Hare, which is no longer part of Park’s portfolio due to the expiration of its ground lease
             on 12/31/18
 13 | (2)    Calculated using total Hotel Adjusted EBITDA, which includes pro rata share of EBITDA from JVs as well as EBITDA from non-comparable hotels.
             See Appendix for definitions and reconciliations of these measures to comparable U.S. GAAP measures
Park Portfolio: Well Insulated from Supply
      ~2.3% Supply Growth for Park                                                                            Supply Growth Exposure for Lodging REITs(1)
  2  Park        Portfolio:             Well
 ⚫ Against a backdrop of increased US supply
                                             Insulated from Supply
                                                                                                                             Full-service REIT Supply Exposure –

                                                                                        Weighted Avg Supply
      growth in Top 25 Markets, Park is well                                                                  4.7%                   STR Top 25 Markets

                                                                                          Growth '19 - '20
      positioned relative to its peers
 ⚫ With outsized exposure to Oahu, San                                                                                3.2%                                                           Peer Avg. 3.1%
                                                                                                                               3.1%       3.0%        2.9%
   Francisco and Orlando, Park anticipates just                                                                                                                 2.8%       2.7%     2.6%
   2.3% average annual supply growth through                                                                                                                                                  2.3%
   2020, or 80bps lower than its peer group
   average
                                                                                                              RHP     CHSP      DRH       PEB          HST      XHR        SHO      BHR        PK

Favorable Supply Picture for Park through 2020(1)

20.0%            National Supply Growth Average: 1.9%

15.0%

10.0%
           7.3%        7.3%       6.7%
                                             5.6%       4.9%
  5.0%                                                              4.1%       3.9%         3.8%               3.7%   3.1%     2.7%    2.2%        2.2%      2.0%   1.9%     1.7%    1.6%
                                                                                                                                                                                               0.5%
  0.0%

                                                        Supply Growth                    PK 2018 Adjusted EBITDA (%)                         National Supply Growth

     Note: Charts presented above based on CBRE and Park estimates
     (1) Supply Growth data from CBRE’s Mar - May 2019 Hotel Horizons forecasts for Upper Priced hotels; represents average of 2019 and 2020 supply
14 |     forecasts. Park’s Adjusted EBITDA represents 2018 data and includes pro rata share of unconsolidated JVs; pro forma for Park’s current portfolio
Grouping Up Strategy
                                                2018 vs. Peak Group Mix                                                                    Group Up to 35%

                              45%                                                                                           •     Strategic goal is to drive group mix higher
                                                                                                                                  by another 400bps to an optimal mix of ~35%
                                                      40%
                              40%                                                                                                 for Park’s Top 25 hotels
                                                                                                          38%

                                             35%                                                                            •     Why Group Up:
                              35%
                  Group Mix

                                                                                                  32%                               1) Build a base in large, big box hotels to
                                                                                 30%                                                effectively shrink the hotels for less rooms
                              30%
                                                                                                                                    to sell each night

                              25%
                                                                                                                                    2) Drive overall ADRs by yielding up on
                                                                         23%
                                                                                                                                    transient rates
                              20%                                                                                                   3) Benefit from highly profitable
                                           Top 10 Portfolio              Hotels 11-25            Top 25 Hotels                      catering/F&B from higher rated groups
                                                         Current Group Mix     Peak Group Mix*
                                                                                                                                    4) Drive margins higher
 * Denotes prior annual peak group revenue mix from 2005 – 2018; Current Group Mix represents
   pro forma comparable 2018 Hotels 11-25 and Top 25 portfolio (excludes Hilton Chicago O’Hare)

                                                         2019 Group Pace(1): Park’s Portfolio + Primary Park Markets
                  30.0%
                                                                                                 23.4%
2019 Group Pace

                  25.0%
                  20.0%                                                                                           17.2%
                  15.0%                  10.4%                  8.8%                                                             7.9%
                  10.0%                                                                                                                       6.4%
                   5.0%
                                                                                                                                                           3.0%          2.2%
                   0.0%
                                       PK Comp.         PK Comp. No SF                           Hawaii          San Fran       Chicago     New York    New Orleans    Orlando

                                        2019 Convention Calendar:                                 2%               78%            35%          33%            20%          5%

         15 |                 (1)   Group pace as of 12/31/18
Closing the Margin Gap: 60bps in 2018; Est’d 50bps in 2019
    Comp. Hotel Adj. EBITDA Margins(1): 2018 + 2019E Change
                                                 100 bps
                                                                                                                             110bps+ of Relative
      Y/Y Change in Hotel Adj. EBITDA Margin

                                                  80 bps
                                                                                           30 bps
                                                                                                                               Improvement
                                                  60 bps

                                                  40 bps
                                                                                           60 bps
                                                  20 bps
                                                                                                                                                                                   -2 bps
                                                      bps

                                                                                                                                                                    -19 bps
                                                  -20 bps

                                                  -40 bps
                                                                                              Park                                                                  Peers(2)

                                                                                                               2018A          2019E(1)

•                   In 2018, Park’s Comparable Hotel Adjusted EBITDA margin improved 60bps to 28.8% vs. a 2bps drop for our full-
                    service Hotel REIT peers. In 2019, we are forecasting another 30bps improvement in our margins (at the mid-point of
                    guidance) vs. a 19bps decline for the peer set average, at the midpoint of their guidance. In aggregate, that would
                    amount to ~110bps+ of relative improvement over a two-year period

•                   For every 50bps of margin improvement, EBITDA increases by ~$14 million, accounting for approximately $170
                    million of value creation(3)

                                  (1)          See Appendix for our definitions and for reconciliations to comparable U.S. GAAP measures. Our definition of Hotel Adjusted EBITDA margin may not be comparable to similarly titled measures of our peers.
                                               Based on most recently available / restated financial statements from their respective quarterly earnings releases
    16 | (2)                                   Peers include HST, SHO, CHSP, DRH (did not provide ‘19 margin guidance), PEB, XHR and RHP (did not provide ‘19 margin guidance)
         (3)                                   Assumes a 12.0x valuation multiple
In Focus: Top 25 Portfolio (~90% of Adj. EBITDA)
                                   Top 25 hotels(1) drive overall quality and performance of portfolio

                                          2018 RevPAR(2)                                                                                    2018 Adjusted EBITDA ($000)
       $195                                                                   $190                                    $800,000
       $190                                                                                                                                                               $754,000
                                                                                                                      $750,000
       $185
       $180                                                                                                           $700,000                     $667,000
                                   $174
       $175
                                                                                                                      $650,000
       $170
       $165                                                                                                           $600,000
       $160
                                                                                                                      $550,000
       $155
       $150                                                                                                           $500,000
                                    PK                           Pro forma PK Top 25                                                      Pro forma PK Top 25               PK

                                       2018 Group Mix(2)                                                                                 2018 Hotel Adjusted EBITDA/key
   32.5%                                                                                                               $35,000
                                                                             32.0%                                                                                         $31,600
   32.0%
                                                                                                                       $30,000
   31.5%                                                                                                                                           $24,900
   31.0%                                                                                                               $25,000
   30.5%                           30.2%                                                                               $20,000
   30.0%
                                                                                                                       $15,000
   29.5%
   29.0%                                                                                                               $10,000
                                     PK                          Pro forma PK Top 25                                                                   PK            Pro forma PK Top 25

        (1)   Top 25 hotels pro forma to exclude Hilton Chicago O’Hare, , which is no longer part of Park’s portfolio due to the expiration of its ground lease on
              12/31/18
17 |
        (2)   Represents comparable 2018 operating statistics for Park’s portfolio as of 12/31/18
Market Spotlights: 2019 Momentum
    Over 50% of Park’s 2018 Adjusted EBITDA generated from 3 markets that are expected to solid performance in 2019

                        Hawaii                                                            San Francisco                                                           Florida
    2018 Financials                                                          2018 Financials                                                          2018 Financials
    RevPAR                                      $221                         RevPAR                                      $235                         RevPAR                       $173
    Hotel Adjusted EBITDA                    $191.5M                         Hotel Adjusted EBITDA                     $99.3M                         Hotel Adjusted EBITDA     $130.6M
    % Adjusted EBITDA                           25%                          % Adjusted EBITDA                           13%                          % Adjusted EBITDA            17%
    2019 Park Hawaii                                                         2019 Park San Francisco                                                  2019 Park Florida
                                                   23%                                                                      17%                                                      3%
    Group Pace                                                               Group Pace                                                               Group Pace

⚫ Nearly 4,000 rooms & 385,000SF of                                     ⚫ Nearly 3,000 rooms & 160,000SF of                                       ⚫ Nearly 3,300 rooms & 322,000SF of
  meeting space across two hotels                                         meeting space across two hotels                                           meeting space across six hotels
⚫ Strong ramp-up in performance                                         ⚫ Group pace projected to be ~17% in                                      ⚫ Diversified exposure to the state
  projected for 2019 in Waikoloa as the                                   2019, building off strong uptick in                                       across three markets (Orlando, Key
  island’s visitation normalizes                                          group throughout 2018 (started the                                        West and Miami)
  following 2018’s disruption from the                                    year at 7% group pace, finished at                                      ⚫ Bonnet Creek complex’s meeting
  volcano                                                                 16%)                                                                      space expansion expected to begin
⚫ Southwest Airlines expected to                                        ⚫ Moscone Center projected to see a                                         in Q4, adding ~70,000SF of meeting
  begin service to Oahu first half of                                     78% increase in convention room                                           space by 2021. Rebrand of Hilton
  2019; additional routes to other                                        nights in 2019, totaling over 1.2M                                        Bonnet to Signia Hilton should help to
  Hawaiian islands to follow                                              room nights                                                               drive additional group demand
⚫ Oahu supply growth of just 0.5%                                       ⚫ San Francisco supply growth of 1.6%                                     ⚫ Orlando supply growth of 2.2%
  projected for next 2 years(1)                                           projected for next 2 years (1)                                            projected for next 2 years, while Key
                                                                                                                                                    West has little to no supply growth (1)

18 | (1) Supply Growth data from CBRE’s Mar - May 2019 Hotel Horizons forecasts for Upper Priced hotels; represents average of 2019 and 2020 supply
         forecasts
Amazon to Concentrate Around Park’s DoubleTree
       DoubleTree Crystal City located directly across the street from 4.1M SF Amazon cluster

    As part of its HQ2 expansion into Crystal City (Arlington, VA),                                        DoubleTree Hotel Washington
    Amazon purchased 4.1M SF of development rights from JBG,                            Name               DC - Crystal City
    directly adjacent to our Doubletree Crystal City hotel.                             Keys                                          627
                                                                                        Open Date                                  Jun-73
                                                                                        Meeting Space (SF)                         31,000
                                                                                        YTD Sep '18 RevPAR                          $124
                                                                                        RevPAR Index                              104.1%

                                                                      The Amazon Effect:
              627-room DoubleTree                                     •         Seattle CBD Tract RevPAR recorded 7.6% CAGR
                                                                                from 2010 – 2017, coinciding with development
                                                                                of Amazon’s headquarters campus
                                                                      •         The Arlington, VA Tract RevPAR CAGR during
                                                                                same time period was just 0.8%
                                                                      $180
                                                                                                                             Annual RevPAR(1)
                                                                      $160

                                                                      $140

                                         4.1M SF of Amazon            $120

                                         Development Rights           $100

                                                                          $80
                                                                                 2000
                                                                                        2001
                                                                                               2002
                                                                                                      2003
                                                                                                             2004
                                                                                                                    2005
                                                                                                                           2006
                                                                                                                                  2007
                                                                                                                                         2008
                                                                                                                                                2009
                                                                                                                                                       2010
                                                                                                                                                              2011
                                                                                                                                                                     2012
                                                                                                                                                                            2013
                                                                                                                                                                                   2014
                                                                                                                                                                                          2015
                                                                                                                                                                                                 2016
                                                                                                                                                                                                        2017
                                                                                                                     Seattle CBD                Arlington

19 | (1)   Tract data provided by STR
ROI Projects

  How We Evaluate ROI Projects
       •    Asset management teams work with property management and Design & Construction to identify
            opportunities
       •    Projects underwritten based on expected risk adjusted returns that range from a minimum of 15-20%
            IRRs for larger projects and expected paybacks within 1-2 years for smaller projects
       •    Consultants may be engaged for larger projects ahead of approving the project
                Near Term Projects                     Mid Term Projects                     Longer Term Projects
                Completed/Committed                        Under Review                       In Planning/Concepting
                  HLT Santa Barbara                    Asset Repositions                     HLT Hawaiian Village
            Converted and repositioned from                                             Master planning (branding; retail;
           DoubleTree (completed April 2018)     HLT Bonnet Creek Repositioning        amenities) including development of
                                                    Up-brand to Signia Hilton               ½-acre Ala Moana parcel
                WA/HLT Bonnet Creek
           Addition of ~70k sq. ft. of meeting     WA Reach Resort Conversion                     HLT New Orleans
                         space                   Renovate and reposition to a Curio      Development and/or sale of 7-acre
                                                                                       ‘Whale’ lot and other parcel and 2-acre
                                                     DT San Jose Conversion                   surface lot parking area
                                                 Renovate and reposition as a Hilton

       Other smaller projects evaluated within the portfolio over time:
       •    Energy Initiatives: Co-generation plants; LED lighting
       •    Labor / Productivity: Union buyouts; labor management systems; digital key
       •    F&B: Installation of Grab ‘N Go market concepts
20 |
Completed ROI Project: Hilton Santa Barbara Beachfront Resort

Conversion from a DoubleTree to a Hilton
⚫ 360-room beachfront resort on 24 acres in Santa Barbara, CA
⚫ Prime location in Santa Ynez wine country with in-house winery
⚫ Upbranding to a Hilton expected to attract higher-rated group business and
   better yield transient business
⚫ $14M renovation cost(1) ($38,000/key) completed in April 2018
⚫ 4Q18 RevPAR increased                   +25.9%; projected 2019 RevPAR growth in mid- to
   high teens
Scope
         ⚫ Guestrooms: case goods; soft goods
         ⚫ Guest bathrooms: conversion of 160 bathtubs to walk-in showers; case goods, soft
             goods
         ⚫ Public space: lobby; meeting space (mainly soft goods); and repositioning of F&B to
             include new Grab ‘N Go
Old lobby:                                                                                                  Renovated lobby:

21 |   (1) Park owns a 50% interest in the Hilton Santa Barbara Beachfront Resort; as such its pro-rata investment in the renovation was $7M
Future ROI Project: Bonnet Creek Meeting Space Addition

 Bonnet Creek: Development Rights
⚫ Group meeting business is a key demand source for the 1,009-room
   Hilton and 502-room WA Bonnet Creek, although both properties offer
   less meeting space per guestroom than their key competitors

Opportunity: Additional Meeting Space
⚫ Current plans call for the construction of ~70,000 sq. ft. of meeting
   space across 2 new meeting space platforms including:
        ⚫ ~35,000 sq. ft. ballroom adjacent to existing Hilton meeting
          space complex
        ⚫ ~9,000 sq. ft. ballroom adjacent to the Waldorf Astoria
⚫ Approximately $70M investment in 2019-2021 expected to generate
   approximately $13.5M of additional EBITDA/year once stabilized,
   yielding a 5-yr unlevered IRR of 20%+
⚫ Upbrand the Hilton Bonnet Creek to newly-announced Signia Hilton
   brand

                                                                          Proposed Hilton Ballroom
                                                                             and meeting space

                                                                                     Proposed Waldorf Ballroom

 22 |
Capital Recycling Efforts Improve Portfolio Quality
Phase I Asset Sales: 2018
•        In 2018, Park sold 13 non-core hotels ($40M of EBITDA in
         2017) for nearly $520M, or 13x 2017 EBITDA
•        Improvement to portfolio quality: Pro-forma 2017(1)
         RevPAR increased +$6 (to $169), while international
         exposure decreased to 1.5% (from 5.5%)

Phase II Asset Sales: 2019
•        Sold Pointe Hilton Squaw Peak Resort for $51M
•        Currently marketing an additional 5 to 8 assets for sale
•        Average RevPAR is 30% below portfolio average
•        Projected capex savings of $90 - $100M

                                       Portfolio Transformation with Capital Recycling Initiatives
                                                                                       Phase I Asset                                           Phase II Asset
                                                              2017                                                         2018                                    2019E(2)
                                                                                          Sales                                                 Sales (YTD)
Hotels                                                           67                               13                          54                             1       52
Rooms                                                       ~35,300                           ~3,200                     ~32,000                            ~560   ~30,000
RevPAR(3)                                                      $163                             $108                        $174                            $118   $179-183
EBITDA/key(4)                                               $25,100                          $14,100                     $27,800                      $10,100         —
       (1)   Pro-forma 2017 represents portfolio metrics without Phase I Assets
       (2)   2019E represents portfolio as of 2/27/19 and guidance provided 2/27/19; 860-room Hilton Chicago O’Hare Airport ground lease expired 12/31/18
       (3)   2017, 2018 and 2019E represent consolidated comparable RevPAR; 2019E based on guidance provided 2/27/19. RevPAR for Phase I Asset Sales
23 |         represents 2017 RevPAR, while RevPAR for Phase II Asset Sales (YTD) represents 2018 RevPAR
       (4)   Represents EBITDA/key for the respective consolidated comparable portfolio
Strong and Flexible Balance Sheet

Debt Capital Structure Overview(1)                                                                                   Debt Maturity Schedule(1)

                                            $                   % of             Weighted Avg.
              Debt
                                          Amount                Total            Cost of Debt
CMBS (secured)                              $2,000               68%                      4.2%

Term Loan A (Unsecured) (2)                   750                25%                      4.0%

Consolidated JV Debt                          207                 7%                      4.2%
(secured)
Revolver(2)                0           0            4.0%
⚫ $236 million of unconsolidated JV debt (pro rata)
Total Debt               $2,957      100%           4.1%

Liquidity Profile                                                                                     Fixed vs. Floating                                                    Net Debt to Adjusted EBITDA(3)

⚫ Ample liquidity with $410 million(4) of cash                                                                                                                       8.0x    7.2x
  available as of 12/31/18                                                                                                                                           7.0x

                                                                                                                                                Net Debt to EBITDA
                                                                                                        Floating                                                     6.0x           5.1x
                                                                                                                                                                                           4.7x
⚫ 42 unencumbered hotels, or 63% of Adjusted                                                              26%                                                        5.0x
                                                                                                                                                                                                  3.8x   3.7x
                                                                                                                                                                     4.0x                                       3.5x
  EBITDA(5)                                                                                                                                                                                                            2.9x
                                                                                                                                                                     3.0x
                                                                                                                                                                                                                              1.8x
                                                                                                                           Fixed,                                    2.0x                                                            1.2x
⚫ In addition to cash, Park has access to an                                                                                                                         1.0x
                                                                                                                            74%
  undrawn $1 billion revolving credit facility                                                                                                                       0.0x
                                                                                                                                                                             BHR RHP PEB CHSP PK                XHR DRH HST SHO

                                                                                                                                             Source: FactSet

      (1)   As of 12/31/18. Figures exclude pro rata share of Unconsolidated JVs, unamortized deferred financing costs, discounts and capital lease obligations
      (2)   Term Loan A (L + 1.45%) and Revolver (L + 1.50%) as of 12/31/18
      (3)   Calculations based upon the latest Consensus estimates. See Appendix for definitions and reconciliations of these measures to comparable U.S. GAAP measures
 24 | (4)   When factoring in the 4Q18 dividend payment of $1.00/share, our pro-forma cash balance would be approximately $210 million
      (5)   For the year ended 12/31/18; 40 hotels and 63% of EBITDA as of 2/26/19
Attractive, Well Covered Dividend
Park’s Quarterly Dividends and Respective Yield(1)                                                                                                 Peer REITs: Current Dividend Yield(2)
                        $0.80                                                                               8.0%                                                   7.0%
                                                                                                                                                                   6.5%   6.3%
                        $0.70                                                                               7.0%
                                                                                                                                                                   6.0%

                                                                                                                                       Annualized Dividend Yield
                        $0.60                                                                               6.0%
                                                                                                                                                                                 5.5%
   Quarterly Dividend

                                                                                           $0.27                                                                   5.5%                 5.4%

                                                                                                                   Dividend Yield
                        $0.50                                                                               5.0%                                                          5.7%                 5.1%
                                                          $0.12
                                                                                                                                                                   5.0%
                                                                                                                                                                                                      4.6%   4.7%   4.6%
                        $0.40                                                                               4.0%                                                   4.5%
                                                                                                                                                                                                                           4.1%   4.1%
                        $0.30                                                                               3.0%                                                   4.0%

                                 $0.43   $0.43    $0.43   $0.43   $0.43   $0.43   $0.43    $0.43   $0.45                                                           3.5%
                        $0.20                                                                               2.0%
                                                                                                                                                                   3.0%
                        $0.10                                                                               1.0%
                                                                                                                                                                   2.5%
                        $0.00                                                                               0.0%                                                   2.0%
                                 1Q17 2Q17 3Q17 4Q17 1Q18 2Q18 3Q18 4Q18 1Q19E                                                                                            PK     XHR    CHSP   BHR    SHO    DRH    PEB    HST    RHP
Source: FactSet                                                                                                                     Source: FactSet

Dividend and Payout Ratio Analysis
⚫ Park paid a fourth quarter 2018 cash dividend of $1.00/share on January 15th to stockholders of record as of December 31,
  2018. Of this, $0.70/share represents the fourth quarter payment based on results of operations, and $0.30/share represents gains
  from the sale of Park’s assets during 2018

⚫ On February 22nd, Park declared a quarterly cash dividend of $0.45/share to be paid on April 15th to stockholders of record as of
  March 29th, an increase of 4.6% in the quarterly “regular way” dividend

            Park has paid a total of $7.37/share in cash + stock dividends in its first two years, totaling $1.5B

                (1)        4Q 2017 dividend includes a $0.12 per share ‘top-off’, which translated into an AFFO payout ratio of 67.5%. 4Q 2018 dividend includes a $0.27 per share ‘top-off’ amount and a $0.30 per share component
                           related to additional gains from 2018 asset sales, which translated into an AFFO payout ratio of 67.2%. Yield excludes both the $0.45 per share special dividend announced on 5/18/18 and the $0.30 per share
                           component included in the 4Q 2018 dividend
                (2)        Based on 2/26/19 closing prices; For PK, the 5.7% yield assumes a quarterly dividend run-rate of $0.45/share, or $1.80 on an annualized basis, while the 6.3% yield includes the 4Q 2019 incremental top-off
                           dividend of $0.65/share at the midpoint of our guidance range, or $1.99/share on an annualized basis
 25 |
Brand Strategy Maximizes Revenue and Profitability

       Brands Matter: Park will focus on owning hotels and resorts in the luxury and upper upscale segments

Benefits of Partnering with Brands

Consistent quality through a branded product should
allow Park to achieve higher RevPAR and margins as a
result of:
                                                                             Worldwide
                                                                             Group Sales
⚫ Recognizable product compared to independent hotels
  struggling to differentiate their offerings

⚫ Worldwide reservation systems
                                                                                                     Strong
⚫ Loyalty programs help to drive recurring sales, while      RevPAR
  lowering new customer acquisition costs                                                            Loyalty
                                                            Premiums
                                                                                                    Programs
         ⚫ Hilton (~85M members) and Marriott, including
           Starwood (~120M members), have over 50%
           of sales stemming from customers within
           loyalty programs

⚫ Ability to achieve increased direct-to-consumer sales
  minimizing OTA / wholesale commissions and
  increasing revenue to Park                                    Effective                     Worldwide
⚫ Significantly lower distribution costs for OTA business        Brand                        Reservation
  given negotiating power of brands                           Segmentation                     Systems
⚫ More effective competition against Airbnb, particularly
  with respect to frequent travelers who appreciate the
  reliability and security of branded hotels
26 |
Appendix

                  Hilton Sao Paulo

27 |
ESG: Corporate Responsibility
       Public Disclosure of Materials                                                                        FY 2017 Performance Highlights(1):
•      Park’s “Responsibility” webpage launched                                                              Hotel Portfolio:
       Jan ’19

•      Extensive new disclosure on Environmental                                                                4.46              13.59            100%
       and Social metrics and initiatives                                                                      Greenhouse                         Portfolio ISO
                                                                                                              Gas Emission         Energy         14001, 9001
•      Approved corporate governance                                                                            Intensity         Intensity        and 50001
       enhancements, including proxy access and                                                                  (kg/sf)         (kw hrs/sf)        Certified
       majority voting standard in director elections

•      Information made publicly available to
       ensure more accurate representation of                                                                ~$445k               84%             ~$35k
       Park’s ESG initiatives to third party ratings                                                          Cost Savings                        Cost Savings
                                                                                                                                   Waste
       agencies like ISS, MSCI and                                                                            from Energy         Diversion       from Water
       Sustainalytics                                                                                           Efficiency          Rate           Efficiency
                                                                                                                 Projects                           Projects

                        New Publications
                                                                                                             Corporate HQ:
•     2018 Annual Corporate
      Responsibility Report
                                                                                                               $270k              90%              400+
•     Environmental Policy
                                                                                                               Charitable         Associate        Volunteer
•     Human Rights Policy                                                                                    Contributions(2)   Satisfaction(2)     hours(2)

•     Vendor Code of Conduct
28 | (1)   Represents Park’s portfolio as of 12/31/17, which consisted of 67 hotels with over 32,000 rooms
     (2)   FY 2018 data; represents first year to track these metrics
Case Study: Bonnet Creek Complex
Asset Management partnered with property team to further drive awareness of the resort given the unique
attributes of the 1,009-room Hilton and 502-room Waldorf Astoria (WA)

            • WA Orlando Focus on Luxury: Hired 2 luxury sales managers & instituted cross-selling with Casa Marina
 Sales/     • Implemented lead-sharing platform with other hotels owned by Park in Orlando
 Mktg       • Opportunity to upbrand Hilton to Signia by Hilton, Hilton’s new upper-upscale, meetings-focused
              brand – similar to a JW Marriott

Revenue     • Created 250 “Fireworks View” room types with premium rates
 Mgmt

            •   Created 12 additional keys – 8 at the Hilton and 4 at the Waldorf in early 2017: $400K incremental EBITDA
            •   Created 5 new Jr. Suites at the Hilton by splitting Parlor Rooms: $150K incremental EBITDA
 Oper.      •   LED Lighting: estimated $600K savings per year and 40% IRR
Analysis    •   Laundry: estimated $150K of annual savings
            •   Re-bid parking contract: estimated incremental $700K annually

                 Waldorf Astoria Orlando                                 Hilton Orlando Bonnet Creek

 29 |
Future ROI Projects: New Orleans
Hilton New Orleans Riverside: Development Rights/Land Sale
  Hilton New Orleans Riverside
  ⚫ 1,622 room hotel with 130,000 sq. ft. of meeting space
  ⚫ Adjacent to the 3 million sq. ft. New Orleans Ernest N. Morial Convention Center (NOCC) – 6th largest in the US

  Opportunity: Excess Land
  ⚫ Whale Lot: 7-acre parking lot separates Hilton Riverside and NOCC (square yellow box)
          ⚫ Sale of Plot: Potential future expansion of the NOCC providing doorstep access to our hotel
          ⚫ Development: Land would need to be entitled, but there is a wide range of potential development opportunities on the site
            with the building height set by FAR. Total buildable square footage could be well in excess of 1 million sq. ft.
   ⚫ WTC surface parking (rectangular yellow box): aggregate ~2 acres of developable land

                                                                                                   ‘Whale’ Lot
                                         WTC Garage

30 |
Guidance

  2019 Guidance and Assumptions

                                                      (unaudited, dollars in millions, except per share amounts)

                                                                                                                                                                                                                                                                                                                                                                                                                                                                                                                                                                                                                                                            2019 Outlook
                                                                                                                                                                                                                                                                                                                                                                                                                                                                                                                                                                                                                                                       as of February 27, 2019
                                                      Metric                                                                                                                                                                                                                                                                                                                                                                                                                                                                                                                                                                                          Low                  High
                                                      Comparable RevPAR Growth                                                                                                                                                                                                                                                                                                                                                                                                                                                                                                                                                                        2.0%                 4.0%
                                                      Comparable RevPAR                                                                                                                                                                                                                                                                                                                                                                                                                                                                                                                                                                           $    179          $       183

                                                      Net income                                                                                                                                                                                                                                                                                                                                                                                                                                                                                                                                                                                  $    294          $      323
                                                      Net income attributable to stockholders                                                                                                                                                                                                                                                                                                                                                                                                                                                                                                                                                     $    286          $      315
                                                      Diluted earnings per share                                                                                                                                                                                                                                                                                                                                                                                                                                                                                                                                                                  $   1.42          $     1.56

                                                      Adjusted EBITDA                                                                                                                                                                                                                                                                                                                                                                                                                                                                                                                                                                             $    745          $      775
                                                      Comparable Hotel Adjusted EBITDA margin change                                                                                                                                                                                                                                                                                                                                                                                                                                                                                                                                                     0 bps              60 bps
                                                      Adjusted FFO per share - Diluted                                                                                                                                                                                                                                                                                                                                                                                                                                                                                                                                                            $   2.91          $     3.05

        •                                                                      Hilton Waikoloa Village will be included in Park’s comparable hotels as its room count is expected to remain consistent
                                                                               throughout 2019 as compared to 2018;
        •                                                                      General and administrative expenses are projected to be $44 million, excluding $15 million of non-cash share-based
                                                                               compensation expense;
        •                                                                      Fully diluted weighted average shares are expected to be 202.3 million;
        •                                                                      Includes $8 million of Adjusted EBITDA from the Caribe Hilton representing a partial year of operations, for which Park
                                                                               expects to be covered by business interruption insurance resulting from the hotel being closed for a portion of 2019
                                                                               following the damage caused by Hurricane Maria; and
        •                                                                      Excludes potential future acquisitions and dispositions, which could result in a material change to Park’s outlook.

        Guidance 2019 Guidance and Assumptions (unaudited, dollars in millions, except per share amounts) 2019 Outlook as of February 27, 2019 Metric Low High Comparable RevPAR Growth 2.0% 4.0% Comparable RevPAR $ 179 $ 183 Net income $ 294 $ 323 Net income at tributable to stockholders $ 286 $ 315 Diluted earnings per share $ 1.42 $ 1.56 Adjusted EBITDA $ 745 $ 775 Comparable Hotel Adjusted EBITDA margin change 0 bps 60 bps Adjusted FFO per share - Diluted $ 2.91 $ 3.05 Hilton Waikoloa Village will be included in Park’s comparable hotels as its room count is expected to remain consistent
        throughout 2019 as compared to 2018; General and administrative expenses are projected to be $44 million, excluding $15 million of non-cash share-based compensation expense; Fully diluted weighted average shares are expected to be 202.3 million; Includes $8 million of Adjusted EBITDA from the Caribe Hilton representing a partial year of operations, for which Park expects to be covered by business interruption insurance resulting from the hotel being closed for a portion of 2019 following the damage caused by Hurricane Maria; and Excludes potential future acquisitions and dispositions, which could result in a
        material change to Park’s outlook. PARK HOTELS & RESORTS 20

31 |
Guidance (continued)

  EBITDA and Adjusted EBITDA
                                                                                                                                                                                                                                                                                                                                                                                                                                                                                                                           Year Ending
                                                      (unaudited, in millions)                                                                                                                                                                                                                                                                                                                                                                                                                                         December 31, 2019
                                                                                                                                                                                                                                                                                                                                                                                                                                                                                                                Low Case                  High Case
                                                      Net income                                                                                                                                                                                                                                                                                                                                                                                                                                            $              294        $               323
                                                         Depreciation and amortization expense                                                                                                                                                                                                                                                                                                                                                                                                                             278                        278
                                                         Interest income                                                                                                                                                                                                                                                                                                                                                                                                                                                    (8)                        (8)
                                                         Interest expense                                                                                                                                                                                                                                                                                                                                                                                                                                                  130                        130
                                                         Income tax expense                                                                                                                                                                                                                                                                                                                                                                                                                                                 13                         14
                                                         Interest expense, income tax and depreciation and amortization included in equity
                                                           in earnings from investments in affiliates                                                                                                                                                                                                                                                                                                                                                                                                                       23                         23
                                                      EBITDA                                                                                                                                                                                                                                                                                                                                                                                                                                                               730                        760
                                                         Share-based compensation expense                                                                                                                                                                                                                                                                                                                                                                                                                                   15                         15
                                                      Adjusted EBITDA                                                                                                                                                                                                                                                                                                                                                                                                                                       $              745        $               775

       NAREIT FFO and Adjusted FFO
                                                                                                                                                                                                                                                                                                                                                                                                                                                                                                                               Year Ending
                                                                              (unaudited, in millions except per share data)                                                                                                                                                                                                                                                                                                                                                                                               December 31, 2019
                                                                                                                                                                                                                                                                                                                                                                                                                                                                                                                    Low Case                  High Case
                                                                              Net income attributable to stockholders                                                                                                                                                                                                                                                                                                                                                                                           $              286        $               315
                                                                                 Depreciation and amortization expense                                                                                                                                                                                                                                                                                                                                                                                                         278                        278
                                                                                 Depreciation and amortization expense attributable to
                                                                                    noncontrolling interests                                                                                                                                                                                                                                                                                                                                                                                                                    (4)                        (4)
                                                                                    Equity in earnings from investments in affiliates                                                                                                                                                                                                                                                                                                                                                                                          (18)                       (18)
                                                                                    Pro rata FFO of equity investments                                                                                                                                                                                                                                                                                                                                                                                                          31                         31
                                                                              NAREIT FFO attributable to stockholders                                                                                                                                                                                                                                                                                                                                                                                                          573                        602
                                                                                 Share-based compensation expense
            Guidance (continued) EBITDA and Adjusted EBITDA Year Ending (unaudited, in millions) December 31, 2019 Low Case High Case Net income $ 294 $ 323 Depreciation and amortization expense 278 278 Interest income (8) (8) Interest expense 130 130 Income tax expense 13 14 Interest expense, income tax and depreciation and amortization included in equity in earnings from investments in affiliates 23 23 EBITDA 727 757 Share-based compensation expense 15 15 Adjusted EBITDA $ 745 $ 775
                                                                                                                                                                                                                                                                                                                                                                                                                                                                                                                                15                         15
                                                                              Adjusted FFO attributable to stockholders                                                                                                                                                                                                                                                                                                                                                                                         $              588        $               617
                                                                                                                                                                                                                                                                                                                                                                                                           (1)
                                                                              Adjusted FFO per share - Diluted                                                                                                                                                                                                                                                                                                                                                                                                  $           2.91          $            3.05
                                                                              Weighted average diluted shares outstanding                                                                                                                                                                                                                                                                                                                                                                                                  202.3                      202.3
                                                                             (1)                                      Per share amounts are calculated based on unrounded numbers.

32 |
Non-GAAP Financial Measures

  EBITDA and Adjusted EBITDA
                                                                                                                    Three Months Ended                                       Year Ended
(unaudited, in millions)                                                                                               December 31,                                         December 31,
                                                                                                               2018                      2017                       2018                       2017
Net income                                                                                              $                55       $                61       $               477        $            2,631
   Depreciation and amortization expense                                                                                 69                        71                       277                       288
   Interest income                                                                                                       (2)                       —                         (6)                       (2)
   Interest expense                                                                                                      33                        31                       127                       124
   Income tax expense (benefit)                                                                                          10                        (2)                       23                    (2,346)
   Interest expense, income tax and depreciation and
       amortization included in equity in earnings                                                                       6                         6                         26                         24
EBITDA from investments in affiliates                                                                                  171                       167                        924                        719
   Loss (gain) on sales of assets, net                                                                                   2                        (1)                       (96)                        (1)
   Gain on sale of investments in affiliates(1)                                                                         —                         —                        (107)                        —
   (Gain) loss on foreign currency transactions                                                                         (1)                       —                           3                          4
   Transition expense                                                                                                   —                          4                          3                          9
   Transaction expense                                                                                                   2                         2                          2                          2
   Severance expense                                                                                                    —                          1                          2                          1
   Share-based compensation expense                                                                                      4                         4                         16                         14
   Casualty loss (gain) and impairment loss, net                                                                        —                         24                         (1)                        26
                (2)
   Other items                                                                                                           6                       (21)                         8                        (17)
Adjusted EBITDA                                                                                         $              184        $              180        $               754        $               757
         (1)   Included in other (loss) gain, net in the consolidated statement of operations.
         (2)   For 2017, includes $18 million of distributions received from investments in affiliates in excess of the investment balance that were included within equity in earnings from investments in
               affiliates in the consolidated statement of operations.

33 |
Non-GAAP Financial Measures (continued)

Comparable Hotel Adjusted EBITDA and Comparable Hotel Adjusted EBITDA Margin
                                                                                                              Three Months Ended                                         Year Ended
  (unaudited, dollars in millions)                                                                                December 31,                                           December 31,
                                                                                                         2018                       2017                      2018                      2017
  Adjusted EBITDA                                                                                $                184       $                180        $                754       $            757
     Less: Adjusted EBITDA from investments in affiliates                                                           9                         10                          45                     45
     Less: All other(1)                                                                                           (13)                       (12)                        (52)                   (46)
  Hotel Adjusted EBITDA                                                                                           188                        182                         761                    758
     Less: Adjusted EBITDA from hotels disposed of                                                                 —                           9                           1                     33
     Less: Adjusted EBITDA from non-comparable hotels                                                              12                          6                          44                     44
  Comparable Hotel Adjusted EBITDA                                                               $                176       $                167        $                716       $            681

  (1)
        Includes other revenues and other expenses, non-income taxes on REIT leases included in other property-level expenses and corporate general and administrative expenses
        in the consolidated statement of operations.
                                                                                                              Three Months Ended                                         Year Ended
                                                                                                                  December 31,                                           December 31,
                                                                                                         2018                       2017                      2018                      2017
  Total Revenues                                                                                 $                686       $                686        $            2,737         $           2,791
     Less: Other revenue                                                                                           19                         17                        72                        64
     Less: Revenues from hotels disposed of                                                                        —                          34                        17                       131
     Less: Revenues from non-comparable hotels(1)                                                                  41                         34                       161                       184
  Comparable Hotel Revenues                                                                      $                626       $                601        $            2,487         $           2,412

  (1)
        Includes revenues from Park's non-comparable hotels and rental revenues from office space and antenna rent leases located at our hotels.

                                                                                                     Three Months Ended                                              Year Ended
                                                                                                        Decem ber 31,                                            Decem ber 31,
                                                                                          2018                  2017            Change (1)             2018               2017          Change (1)
   Comparable Hotel Revenues                                                         $         626        $         601              4.2%          $     2,487       $          2,412           3.1%
   Comparable Hotel Adjusted EBITDA                                                  $         176        $         167              5.8%          $       716       $            681           5.2%
   Comparable Hotel Adjusted EBITDA margin                                                   28.2%                27.8%             40 bps               28.8%                  28.2%          60 bps

        (1)
              Percentages are calculated based on unrounded numbers.

34 |
Non-GAAP Financial Measures (continued)

  Historical Comparable Hotel Adjusted EBITDA – 2018

The financial information below is for the 44 comparable hotels owned as of December 31, 2018.

                                                                                                                 Three Months Ended                                            Full Year           Full Year
               (unaudited, dollars in millions)                                   March 31,              June 30,               September 30,         December 31,         December 31,        December 31,
                                                                                    2018                  2018                      2018                 2018                   2018                2017
               Net income                                                     $               149    $              218     $               55    $                  55    $           477     $         2,631
                  Depreciation and amortization expense                                        70                    69                     69                       69                277                 288
                  Interest income                                                              (1)                   (1)                    (2)                      (2)                (6)                 (2)
                  Interest expense                                                             31                    31                     32                       33                127                 124
                  Income tax (benefit) expense                                                 —                     13                     —                        10                 23              (2,346)
                  Interest expense, income tax and depreciation and
                     amortization included in equity in earnings from
                     investments in affiliates                                                  7                      5                     8                    6                      26                 24
               EBITDA                                                                         256                    335                   162                  171                     924                719
                  Gain on sales of assets, net                                                (89)                    (7)                   (2)                   2                     (96)                (1)
                                                                   (1)
                  (Gain) loss on sale of investments in affiliates                             —                    (108)                    1                   —                     (107)                —
                  (Gain) loss on foreign currency transactions                                 (1)                     4                     1                   (1)                      3                  4
                  Transition expense                                                            2                     —                      1                   —                        3                  9
                  Transaction expense                                                          —                      —                     —                     2                       2                  2
                  Severance expense                                                            —                       1                     1                   —                        2                  1
                  Share-based compensation expense                                              4                      4                     4                    4                      16                 14
                  Casualty loss (gain) and impairment loss, net                                —                      —                     (1)                  —                       (1)                26
                  Other items                                                                   2                     (1)                    1                    6                       8                (17)
               Adjusted EBITDA                                                                174                    228                   168                  184                     754                757
                  Less: Adjusted EBITDA from investments in affiliates                         12                     14                    10                    9                      45                 45
                  Less: All other(2)                                                          (12)                   (14)                  (13)                 (13)                    (52)               (46)
               Hotel Adjusted EBITDA                                                          174                    228                   171                  188                     761                758
                  Less: Adjusted EBITDA from hotels disposed of                                 1                     —                     —                    —                        1                 33
                  Less: Adjusted EBITDA from non-comparable hotels                             14                     13                     5                   12                      44                 44
               Comparable Hotel Adjusted EBITDA                               $               159    $               215    $              166    $             176        $            716    $           681

       (1)   Included in other (loss) gain, net in the consolidated statement of operations.
       (2)    Includes other revenues and other expenses, non-income taxes on REIT leases included in other property-level expenses and corporate general and administrative expenses.

35 |
Non-GAAP Financial Measures (continued)

  Historical Comparable Hotel Revenues – 2018

The financial information below is for the 44 comparable hotels owned as of December 31, 2018.

                                                                                                             Three Months Ended                                      Full Year        Full Year
  (unaudited, dollars in millions)                                             March 31,             June 30,               September 30,        December 31,    December 31,     December 31,
                                                                                 2018                 2018                      2018                2018              2018             2017
  Total Revenues                                                           $               668   $              731     $              652   $             686   $        2,737   $        2,791
     Less: Other revenue                                                                    17                   17                     19                  19               72               64
     Less: Revenues from hotels disposed of                                                 17                   —                      —                   —                17              131
     Less: Revenues from non-comparable hotels(1)                                           44                   41                     35                  41              161              184
  Comparable Hotel Revenues                                                $               590   $              673     $              598   $             626   $        2,487   $        2,412

       (1)   Includes revenues from Park's non-comparable hotels and rental revenues from office space and antenna rent leases located at our hotels.

36 |
Non-GAAP Financial Measures (continued)

  Historical Comparable Hotel Adjusted EBITDA – 2017

The financial information below is for the 44 comparable hotels owned as of December 31, 2018.

                                                                                                           Three Months Ended                                            Full Year          Full Year
  (unaudited, dollars in millions)                                          March 31,              June 30,               September 30,         December 31,         December 31,       December 31,
                                                                              2017                  2017                      2017                 2017                   2017               2016
  Net income                                                            $             2,350    $              115     $              105    $                  61    $         2,631    $           139
     Depreciation and amortization expense                                               70                    73                     74                       71                288                300
     Interest income                                                                     —                     (1)                    (1)                      —                  (2)                (2)
     Interest expense                                                                    30                    31                     32                       31                124                181
     Income tax (benefit) expense                                                    (2,281)                  (19)                   (44)                      (2)            (2,346)                82
     Interest expense, income tax and depreciation and
        amortization included in equity in earnings from
        investments in affiliates                                                         5                     7                      6                    6                     24                 24
  EBITDA                                                                                174                   206                    172                  167                    719                724
     Gain on sales of assets, net                                                        —                     —                      —                    (1)                    (1)                (1)
     (Gain) loss on foreign currency transactions                                        (1)                    4                      1                   —                       4                 (3)
     Transition expense                                                                   1                     1                      3                    4                      9                 26
     Transaction expense                                                                 —                     —                      —                     2                      2                 —
     Severance expense                                                                   —                     —                      —                     1                      1                 —
     Share-based compensation expense                                                     3                     4                      3                    4                     14                 —
     Casualty loss (gain) and impairment loss, net                                       —                     —                       2                   24                     26                 15
     Impairment loss included in equity in earnings from
        investments in affiliates                                                        —                     —                      —                    —                      —                  17
     Other items                                                                         —                      2                      2                  (21)                   (17)                36
  Adjusted EBITDA                                                                       177                   217                    183                  180                    757                814
     Less: Spin-off adjustments(1)                                                       —                     —                      —                    —                      —                  49
     Less: Adjusted EBITDA from investments in affiliates                                 9                    15                     11                   10                     45                 44
     Less: All other(2)                                                                 (12)                  (11)                   (11)                 (12)                   (46)               (34)
  Hotel Adjusted EBITDA                                                                 180                   213                    183                  182                    758                755
     Less: Adjusted EBITDA from hotels disposed of                                        4                     9                     11                    9                     33                  1
     Less: Adjusted EBITDA from non-comparable hotels                                    17                    11                     10                    6                     44                 82
  Comparable Hotel Adjusted EBITDA                                      $               159    $              193     $              162    $             167        $           681    $           672

  (1)   Includes adjustments for incremental fees based on the terms of the post spin-off management agreements.
  (2)   Includes other revenues and other expenses, non-income taxes on REIT leases included in other property-level expenses and corporate general and administrative expenses in the
        consolidated statement of operations.

37 |
Non-GAAP Financial Measures (continued)

  Historical Comparable Hotel Revenues – 2017
The financial information below is for the 44 comparable hotels owned as of December 31, 2018.

                                                                                                             Three Months Ended                                        Full Year        Full Year
(unaudited, dollars in millions)                                              March 31,             June 30,                September 30,          December 31,    December 31,     December 31,
                                                                                2017                  2017                      2017                  2017              2017             2016
Total Revenues                                                            $               684   $              733      $              688    $              686   $        2,791   $        2,727
   Less: Other revenue                                                                     13                   16                      18                    17               64               23
   Less: Revenues from hotels disposed of                                                  26                   35                      36                    34              131               —
   Less: Revenues from non-comparable hotels(1)                                            57                   48                      45                    34              184              334
Comparable Hotel Revenues                                                 $               588   $              634      $              589    $              601   $        2,412   $        2,370

  (1)   Includes revenues from Park's non-comparable hotels and rental revenues from office space and antenna rent leases located at our hotels.

38 |
Non-GAAP Financial Measures (continued)

   Net Debt and Net Debt to Pro-forma Adjusted EBITDA Ratio

          (unaudited, in millions)
                                                                                                            December 31, 2018           December 31, 2017
          Debt                                                                                             $               2,948        $             2,961
          Add: unamortized deferred financing costs                                                                           10                         12
           Long-term debt, including current maturities and excluding
             unamortized deferred financing costs                                                                          2,958                      2,973
             Add: Park's share of unconsolidated affiliates debt,
               excluding unamortized deferred financing costs                                                                233                        236
             Less: cash and cash equivalents                                                                                 410                        364
             Less: restricted cash                                                                                            15                         15
          Net debt                                                                                         $               2,766        $             2,830
          Pro-forma Adjusted EBITDA(1)                                                                     $                 751        $               717
          Net debt to Pro-forma Adjusted EBITDA ratio                                                                       3.7x                       3.9x

          (1)   See slide 18 for Pro-forma Adjusted EBITDA at December 31, 2018. Pro-forma Adjusted EBITDA excludes results from the 13 hotels disposed of in 2018.

39 |
Non-GAAP Financial Measures (continued)

  Pro-forma Adjusted EBITDA

                                                                                                            Year Ended
       (unaudited, in millions)                                                                             December 31,
                                                                                                    2018                   2017
       Net income                                                                               $          477      $          2,631
          Depreciation and amortization expense                                                            277                   288
          Interest income                                                                                   (6)                   (2)
          Interest expense                                                                                 127                   124
          Income tax (benefit) expense                                                                      23                (2,346)
          Interest expense, income tax and depreciation and amortization
              included in equity in earnings from investments in affiliates                                  26                    24
       EBITDA                                                                                               924                   719
          Gain on sales of assets, net                                                                      (96)                   (1)
          Gain on sale of investments in affiliates(1)                                                     (107)                   —
          Loss on foreign currency transactions                                                               3                     4
          Transition expense                                                                                  3                     9
          Transaction expense                                                                                 2                     2
          Severance expense                                                                                   2                     1
          Share-based compensation expense                                                                   16                    14
          Casualty (gain) loss and impairment loss, net                                                      (1)                   26
          Other items                                                                                         8                   (17)
       Adjusted EBITDA                                                                                      754                   757
          Less: Adjusted EBITDA from hotels disposed of                                                       1                    33
          Less: Adjusted EBITDA from investments in affiliates disposed of                                    2                     7
       Pro-forma Adjusted EBITDA                                                                $           751     $             717

        (1)   Included in other (loss) gain, net in the consolidated statement of operations.

40 |
Definitions

  EBITDA, Adjusted EBITDA, Hotel Adjusted EBITDA and Hotel Adjusted EBITDA Margin

  Earnings before interest expense, taxes and depreciation and amortization (“EBITDA”), presented herein, reflects net income excluding depreciation and amortization,
  interest income, interest expense, income taxes and interest expense, income tax and depreciation and amortization included in equity in earnings from investments in
  affiliates.

  Adjusted EBITDA, presented herein, is calculated as EBITDA, as previously defined, further adjusted to exclude:
  • Gains or losses on sales of assets for both consolidated and unconsolidated investments;
  • Gains or losses on foreign currency transactions;
  • Transition expense related to the Company’s establishment as an independent, publicly traded company;
  • Transaction costs associated with hotel acquisition or disposition costs expensed during the period;
  • Severance expense;
  • Share-based compensation expense;
  • Casualty and impairment losses; and
  • Other items that management believes are not representative of the Company’s current or future operating performance.

  Hotel Adjusted EBITDA measures hotel-level results before debt service, depreciation and corporate expenses of the Company’s consolidated hotels, including both
  comparable and non-comparable hotels but excluding hotels owned by unconsolidated affiliates, and is a key measure of the Company’s profitability. The Company
  presents Hotel Adjusted EBITDA to help the Company and its investors evaluate the ongoing operating performance of the Company’s consolidated hotels.

  Hotel Adjusted EBITDA margin is calculated as Hotel Adjusted EBITDA divided by total hotel revenue.

  EBITDA, Adjusted EBITDA, Hotel Adjusted EBITDA and Hotel Adjusted EBITDA margin are not recognized terms under United States (“U.S.”) GAAP and should not
  be considered as alternatives to net income (loss) or other measures of financial performance or liquidity derived in accordance with U.S. GAAP. In addition, the
  Company’s definitions of EBITDA, Adjusted EBITDA, Hotel Adjusted EBITDA and Hotel Adjusted EBITDA margin may not be comparable to similarly titled measures
  of other companies.

  The Company believes that EBITDA, Adjusted EBITDA, Hotel Adjusted EBITDA and Hotel Adjusted EBITDA margin provide useful information to investors about the
  Company and its financial condition and results of operations for the following reasons: (i) EBITDA, Adjusted EBITDA, Hotel Adjusted EBITDA and Hotel Adjusted
  EBITDA margin are among the measures used by the Company’s management team to make day-to-day operating decisions and to evaluate its operating
  performance between periods and between REITs by removing the effect of its capital structure (primarily interest expense) and asset base (primarily depreciation and
  amortization) from its operating results; and (ii) EBITDA, Adjusted EBITDA, Hotel Adjusted EBITDA and Hotel Adjusted EBITDA margin are frequently used by
  securities analysts, investors and other interested parties as a common performance measure to compare results or estimate valuations across companies in the
  industry.

  EBITDA, Adjusted EBITDA, Hotel Adjusted EBITDA and Hotel Adjusted EBITDA margin have limitations as analytical tools and should not be considered either in
  isolation or as a substitute for net income (loss) or other methods of analyzing results as reported under U.S. GAAP.

41 |
Definitions (cont’d)

  Net Debt

  Net debt, presented herein, is a non-GAAP financial measure that the Company uses to evaluate its financial leverage. Net debt is calculated as (i)
  long-term debt, including current maturities and excluding unamortized deferred financing costs; and (ii) the Company’s share of investments in
  affiliate debt, excluding unamortized deferred financing costs; reduced by (a) cash and cash equivalents; and (b) restricted cash and cash
  equivalents.

  The Company believes Net debt provides useful information about its indebtedness to investors as it is frequently used by securities analysts,
  investors and other interested parties to compare the indebtedness of companies. Net debt should not be considered as a substitute to debt
  presented in accordance with U.S. GAAP. Net debt may not be comparable to a similarly titled measure of other companies.

  Net Debt to Pro-forma Adjusted EBITDA Ratio

  Net debt to Pro-forma Adjusted EBITDA ratio, presented herein, is a non-GAAP financial measure and is included as it is frequently used by
  securities analysts, investors and other interested parties to compare the financial condition of companies. Net debt to Pro-forma Adjusted EBITDA
  ratio should not be considered as an alternative to measures of financial condition derived in accordance with U.S. GAAP and it may not be
  comparable to a similarly titled measure of other companies.

  Comparable Hotels

  The Company presents certain data for its consolidated hotels on a comparable hotel basis as supplemental information for investors. The
  Company defines its comparable hotels as those hotels that: (i) were active and operating in the Company’s portfolio since January 1st of the
  previous year; and (ii) have not sustained substantial property damage, business interruption, undergone large-scale capital projects or for which
  comparable results are not available. The Company presents comparable hotel results to help the Company and its investors evaluate the ongoing
  operating performance of its comparable hotels. Of the 46 hotels that are consolidated as of December 31, 2018, 44 hotels have been classified as
  comparable hotels. Due to the conversion of a significant number of rooms at the Hilton Waikoloa Village to HGV timeshare units in 2017, and due
  to the effects of business interruption from Hurricane Maria at the Caribe Hilton in Puerto Rico and the continued effects from business interruption,
  the results from these properties were excluded from comparable hotels in 2018. The Company’s comparable hotels also exclude the 12
  consolidated hotels that were sold in January and February 2018.

  Pro-forma

  Certain financial measures and other information have been adjusted to reflect the effects of hotels disposed of during the periods presented.
  When presenting such information, the amounts are identified as “Pro-forma.”
42 |
About Park and Safe Harbor Disclosure

  About Park Hotels & Resorts Inc.
  Park (NYSE: PK) is the second largest publicly traded lodging real estate company with a diverse portfolio of market-leading hotels and resorts with
  significant underlying real estate value. Park’s portfolio consists of 52 premium-branded hotels and resorts with over 30,000 rooms, primarily located
  in prime U.S. markets with high barriers to entry. Visit www.pkhotelsandresorts.com for more information.

  Forward-Looking Statements
  This presentation contains forward-looking statements within the meaning of Section 27A of the Securities Act of 1933, as amended, and Section
  21E of the Securities Exchange Act of 1934, as amended. Forward-looking statements include, but are not limited to, statements related to Park’s
  current expectations regarding the performance of its business, financial results, liquidity and capital resources, the effects of competition and the
  effects of future legislation or regulations, the expected completion of anticipated acquisitions and dispositions, the declaration and payment of
  future dividends and other non-historical statements. Forward-looking statements include all statements that are not historical facts and, in some
  cases, can be identified by the use of forward-looking terminology such as the words “outlook,” “believes,” “expects,” “potential,” “continues,” “may,”
  “will,” “should,” “could,” “seeks,” “projects,” “predicts,” “intends,” “plans,” “estimates,” “anticipates” or the negative version of these words or other
  comparable words. Forward-looking statements involve risks, uncertainties and assumptions. Actual results may differ materially from those
  expressed in these forward-looking statements. You should not put undue reliance on any forward-looking statements in this presentation and Park
  urges investors to carefully review the disclosures Park makes concerning risk and uncertainties in Item 1A: “Risk Factors” in Park’s Annual Report
  on Form 10-K for the year ended December 31, 2018, as such factors may be updated from time to time in Park’s periodic filings with the SEC,
  which are accessible on the SEC’s website at www.sec.gov. Except as required by law, Park undertakes no obligation to update or revise publicly
  any forward-looking statements, whether as a result of new information, future events or otherwise.

  Supplemental Financial Information
  Park refers to certain non-generally accepted accounting principles (“GAAP”) financial measures in this presentation, including Funds from
  Operations (“FFO”) calculated in accordance with the guidelines of the National Association of Real Estate Investment Trusts (“NAREIT”), Adjusted
  FFO, FFO per share, Adjusted FFO per share, Earnings before interest expense, taxes and depreciation and amortization (“EBITDA”), Adjusted
  EBITDA, Hotel Adjusted EBITDA, Hotel Adjusted EBITDA margin, Net debt and Net debt to Pro-forma Adjusted EBITDA ratio. These non-GAAP
  financial measures should be considered along with, but not as alternatives to, net income (loss) as a measure of its operating performance. Please
  see the schedules included in this presentation including the “Definitions” section for additional information and reconciliations of such non-GAAP
  financial measures.

43 |
You can also read