Investor Presentation 26th Vontobel Summer Conference - Interlaken- June 5th/ 6th, 2018 - Investors

Page created by Daryl Maldonado
 
CONTINUE READING
Investor Presentation 26th Vontobel Summer Conference - Interlaken- June 5th/ 6th, 2018 - Investors
Investor Presentation
26th Vontobel Summer
Conference
Interlaken- June 5th/ 6th, 2018

 CEVA Logistics AG – Q1 2018
Investor Presentation 26th Vontobel Summer Conference - Interlaken- June 5th/ 6th, 2018 - Investors
CEVA Logistics – A Leading Global Logistics Company

                                       Global Player                                                         Blue-Chip Customer Base     Broad Service Range

                                                                                                                                             Manages c. 9 MM sqm
                                                                                                                                                warehouse space

                      $                                                                                                  57%
                                                                                                                                             across c. 750 locations

                                                                                                         of Gross Revenue with top 100
                                                                Present in over                                    customers
              c.7.0   Bn
                 Revenue                                              160                                                                        480,000 Tons
                                                                                                                                                   Air Freight
                                                                    countries1

                                                                                                                                                729,000 TEUs
                                                                                                                                                  Ocean Freight
                                                                                                              Average relationship of

                   More than
                                                                                                                   15 years
              56,000                                       #5                    #10                        with the top 30 customers
                                                                                                                                                 1.9 MM Tons
     employees and temporary                           in Contract           in Freight                                                              Ground
            workers2                                    Logistics3          Management4

1 Direct presence in more than 60 countries and exclusive agents in more than 100
2 As of 31 December 2017
3 Transport Intelligence report, Global Contract Logistics 2017
4 Transport Intelligence report, Global Freight Forwarding 2017, #7 in Air ranked by Revenue, #12 in Ocean ranked by Volume

2
Investor Presentation 26th Vontobel Summer Conference - Interlaken- June 5th/ 6th, 2018 - Investors
New CEVA since 2014

                                                                                       1      Rebuilding foundations                                 2   Executing improvements –
                                                                                                                                                              Growth, margin

                                                                                                        New management Excellence
          Creation of                                                            Xavier Urbain           and operating  Program
            CEVA1                                     Debt for Equity              new CEO                  model        started                                 IPO       More to come

                                                                                                                                                          …
                                         …                                                                                                               …

               2006                                             2013                     2014                    2015                     2016                2018

                                 “Old” CEVA                                                                                         “New” CEVA
         ▪    Poor organisational set-up, many layers,                             ▪    New operating model – matrix organisation with strong emphasis on
              no product focus                                                          business lines and products
         ▪    Leadership without industry experience                               ▪    Almost entirely new management team
         ▪    Underinvested, fragmented technology                                 ▪    IT and processes standardisation, upgrading of technology
         ▪    Not winning enough new businesses                                    ▪    New business development approach
         ▪    Weak performance management                                          ▪    Tight performance management
         ▪    Distracted by financial situation                                    ▪    Cost reductions, productivity, working capital and addressing legacy issues

1 Established through Apollo’s 2006 acquisition of TNT’s Contract Logistics business and its subsequent merger with Eagle Global Logistics in 2007

3
Investor Presentation 26th Vontobel Summer Conference - Interlaken- June 5th/ 6th, 2018 - Investors
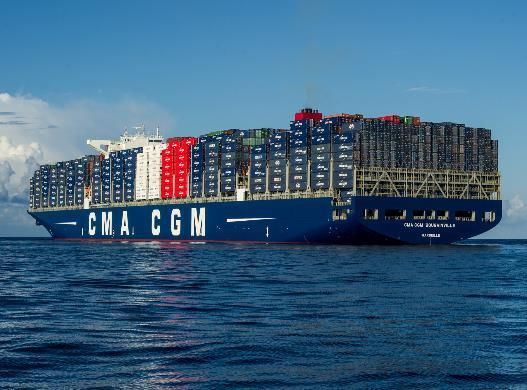
CEVA is Poised to Benefit from Favourable Industry Dynamics

         Market Size and Growth                                           Growth Drivers and Industry Themes

          Outsourced Contract Logistics Market                                                                                            Outsourcing Levels and Growth (CL),
                                                                                         Outsourcing
          $ Bn                                                                                                                            Examples1

                                                   262                                                                                    UK                                 c. 60%
                      214                                                                E-commerce
                                                                                                                                          Other
                                                                                                                                          Developed Economies c. 40%

                                                                                         Digital/Technology                               China                               c. 5%

                     2016                         2020
                                                                                                                                           Integrated Solutions
                                                                                         Consolidation
          Outsourced Air & Ocean Freight                                                                                                    Customers Requiring Full-Service Offering
          Market                                                                                                                            % of respondents
          $ Bn
                                                                                         Urbanization and growing                                   Not Important                       Very Important
                                                   175
                      149                                                                middle classes                                             11%                                 55%

                                                                                                                                             Somewhat
                                                                                         Changing supply chains and                          Important
                                                                                         global trade patterns                               26%

                                                                                         Integrated supply                                        Absolutely Crucial
                     2016                         2020                                   chain solutions                                          8%

1- Management estimate
SOURCE Transport Intelligence report Total Logistics 2017, Transport Intelligence report Global Contract Logistics 2017, Transport Intelligence report Global Freight Forwarding 2017

4
Investor Presentation 26th Vontobel Summer Conference - Interlaken- June 5th/ 6th, 2018 - Investors
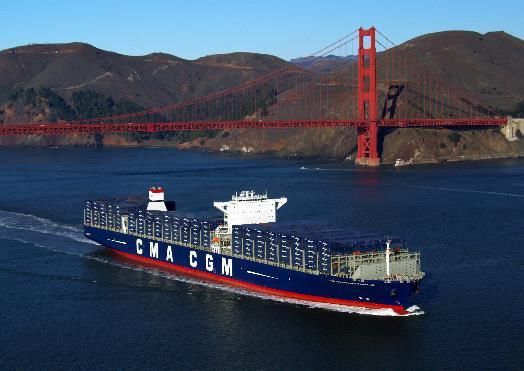
Integrated Solutions Provider with Balanced Portfolio

Broad Service Offering, Comprehensive Solutions                                     Balanced Product, Geographic and Industry Exposure2
                                                                                     Business Line                                                 Customer Segment
     Freight Management                          Contract Logistics                  % Gross Revenue; FY17A                                        % Gross Revenue; FY17A
                                                                                          Freight
 ▪   Air Freight                          ▪    Warehousing                            Management                                                            Other
                                                                                             47%                                                             43%
 ▪ Ocean Freight                          ▪ Value added services                                                                 Contract
                                                                                                                                 Logistics
 ▪   Ground transportation                ▪    Transportation and                                                                53%
                                               distribution                                                                                                                          Top 100
 ▪   Value added services,                                                                                                                                                           57%
     incl. customs
     brokerage
                                                                                     Region                                                        Industry
                                                                                     % Gross Revenue; FY17A                                        % Gross Revenue; FY17A
           Integrated Supply Chain Solutions / SCS1                                                                                                            Energy, 3% Other,1%
                                                                                     Europe/MEA5                                Americas3
                                                                                                                                                     Healthcare, 5%                  Consumer &
                                                                                             40%                                33%
                                                                                                                                                     Technology                       Retail, 29%
                                                                                                                                 Asia Pacific4       15%
                                                                                                                                 26%
                                                                                                                                 incl. Anji-
                                                                                                                                                  Industrial &
                                                                                                                                 CEVA                                                Automotive
                                                                                                                                                  Aerospace, 22%
                                                                                                                                 32%                                                 25%

                                                                                             Strong Strategic Platform
                                                                                             ▪ Global presence, strong footprint in growth markets, notably Asia
                                                                                             ▪ Blue-chip customer base
                                                                                             ▪ Diversified industry sector mix
                                                                                             ▪ Broad service offering, contract logistics / solutions capability
1 Reported in Contract Logistics
2 Excluding contribution from Anji-CEVA JV
3 Comprising North America, Central America, and South America clusters
4 Comprising South East Asia, Mekong, India, Australia and New Zealand, China, and North Asia clusters
5 Comprising UK, Ireland and Nordics, Benelux, France, Germany, Central and Eastern Europe, Italy, Iberia, and BAMECA (Balkans, Middle East and Africa) clusters

5
Investor Presentation 26th Vontobel Summer Conference - Interlaken- June 5th/ 6th, 2018 - Investors
Strong Strategic Platform – Uniquely Positioned to Compete also with
the Largest Players
 Largest Logistics Players                                                                        Business Mix of Selected Logistics Players
                                                                                                                                       Geographical Split                           Segment Split
 FY17A Gross Revenue (Selected Players)                                                                                                  by Revenue(7)                              by Revenue(8)
    $ Bn1
            2
                                                                                                                                  40                33              26         47                    53
                                                                                      31.9
                                                                        18.9
                                                                       18.3                                                            64                     23         13          80                   20
                                                               15.4
                                                             14.9                                                        9
                                                                                                                                  37                     62               1               100
                                                    11.2
            3
                                              9.6
                                             9.1                                                                                            71                 18        10               85                  15
                                                     CEVA Competitive Strengths
                                       7.0
                                                     ▪     Global coverage, strong footprint in
                                      6.9                  Asia / growth markets                                    10
            4                                                                                                                          66                     23         11    46                    54
                                      6.2            ▪     Broad service portfolio across               (private)
                                                           Freight Forwarding and Contract
                                      6.2                  Logistics
            5
                                      6.1            ▪     Integrated, end-to-end solutions;                                 22             33                46                          100
                                                           supply-chain management
                                   5.6                     capabilities
            6
                                4.6                  ▪     Track record of cross-selling,
                                                           accompanying customers globally                                        42               26              32                    90                   10
                                4.6
            6                                        ▪     Strong understanding of evolving
                             3.5                           customer requirements
                                                                                                                             EMEA                Americas               APAC        FM          CL    Other
                          2.7                                                                                                Other

                                                                                                  5 Represents 2016A gross revenue (latest financials available)
1 Estimates for non-$ reported Revenues, based on the average of daily exchange rates             6 Represents LTM 6/30/17 gross revenue (latest financials available)
  throughout the year                                                                             7 Allocating revenue generated from ‘Other’ geographies to EMEA for XPO Logistics
2 Restricted to Global Forwarding, Freight and Supply Chain Solutions divisions                   8 Ground operations considered as Freight Management
3 Restricted to Freight Forwarding and Logistics divisions                                        9 Transportation classified as CL
4 Represents Japan Post Group’s international logistics business segment revenue for the fiscal   10 Revenue breakdown per FY14 results; Distribution & Express classified as CL
  year ended 30 March 2017                                                                        SOURCE Company Reports, Capital IQ

6
Investor Presentation 26th Vontobel Summer Conference - Interlaken- June 5th/ 6th, 2018 - Investors
Why do Customers Choose CEVA?

Automotive1                                                                                          Consumer & Retail1
                                                         ▪ Long term relationship since                                   ▪ Won significant contracts in
                                                           the 1980s with operations in                                     ANZ and US after operating
                                                           26 countries                                                     DC in UK successfully
                                                         ▪ Broad range of services:                                       ▪ US contract is largest IKEA
                                                           inbound, outbound,                                               operation in the States
                                                           manufacturing support                                          ▪ Key success factors:
                                                         ▪ Key success factors:                                             — Globally deployable
                                                           — Capabilities, expertise                                           solution
                                                           — Customer intimacy                                              — Strong team, industry
                                                           — Flexibility                                                       expertise
                                                           — Team, executive                                                — Leveraged IT to create
                                                              involvement                                                      value

Industrial1                                                                                          Consumer & Retail1
                                                         ▪ Global supply chain solution,                                  ▪ Won landmark contract
                                                           sole provider for inbound and                  A Leading         against DHL, Schenker,
                                                           aftermarket                                                      Kühne + Nagel
                                                         ▪ Won significant contract from                 E-commerce       ▪ First time customer
                                                           Kühne + Nagel                                    Player          outsourced such
                                                         ▪ Key success factors:                                             comprehensive services
                                                           — Solution design for                                          ▪ Key success factors:
                                                              complex operation                                             — Designed pragmatic,
                                                           — Strong global project                                              scalable solutions in
                                                              management team                                                   complex context
                                                           — IT solutions and capability                                    — Local management team
                                                           — Undertaking to optimise                                        — CEVA as strategic partner
                                                              supply chain cost for RR in                                       for further regions
                                                              years to come
1 Images are illustrative and not necessarily representative of the respective customer operations

7
Investor Presentation 26th Vontobel Summer Conference - Interlaken- June 5th/ 6th, 2018 - Investors
Long-Standing Contract Logistics JV in China

Key Facts1                                        Overview

                                                   ▪ Complements CEVA’s Freight Management business in China
                                                   ▪ 50/50 owned by CEVA and Anji Logistics (part of SAIC Group, the premier auto
                                                     group in China) since 2002, renewed for 15 years until 2032
                                                   ▪ Service portfolio:
                                  $                   − Automotive inbound logistics (warehousing, line feeding)
     #1 automotive        Revenue of $1.1 BN
                                                      − Automotive parts aftermarket logistics (warehousing, distribution)
    logistics provider   EBITDA of >$100 MM
         in China              in FY17A               − Ground transport network
                                                      − Expanding Contract Logistics for Industrial & Aerospace, Consumer & Retail,
                                                        Technology customers

        More than        Ground transportation     ▪ FY17A Revenue of $1,146 MM, CAGR of 12% since FY14A
          19,000           network covering        ▪ Strong profitability with 9% EBITDA margin in FY17A
        employees             >200 cities
                                                     ‒ Contributed $50 MM to CEVA’s Adj. EBITDA
                                                   ▪ $15 MM cash dividend paid to CEVA in FY17A
                                                   ▪ Anji-CEVA results are not consolidated in CEVA accounts
       >2MM sqm          Supports production of
        warehouse         >4MM vehicles p.a.
          space              (for inbound)

1 As of FY17A

8
Investor Presentation 26th Vontobel Summer Conference - Interlaken- June 5th/ 6th, 2018 - Investors
Asset-Light, Low Risk Business Model

    ▪    Leased or customer-owned facilities (often coterminous with                                                  Capital Employed as % LTM Revenue2
         customer contracts), also other equipment largely on
                                                                                                                                                                                            24.1%
         operating leases
    ▪    Largely subcontracted transportation (including ground
         transportation)                                                                                                                                    12.4%
    ▪    Risk-minimising contract terms (e.g. early termination rights,                                                                     10.8%
         investment protection)
                                                                                                                                                                             9.5%
    ▪    c. 25% of workforce on temporary contracts or through
         external agents                                                                                                     8.1%

    ▪    Despite investments in the future (notably technology), capex
         only at 1.4% of Revenue for 2017
         – Capex of $102 MM in FY17A
         – Tangible assets of $169 MM, intangible assets of $64 MM
               (excluding acquisition intangibles)
    ▪    Net Working Capital intensity of (3.6%)1 through favourable CL
         payment profile in some countries and actively managing
         Working Capital

1 Net Working Capital intensity calculated as Net Working Capital divided by LTM Revenue; Net Working Capital defined as Non-interest Bearing Current Assets minus Non-interest Charging Current Liabilities
2 Capital Employed defined as Total Assets excluding Intangible Assets less Current Liabilities excluding Current Borrowings

SOURCE: Company Reports

9
Investor Presentation 26th Vontobel Summer Conference - Interlaken- June 5th/ 6th, 2018 - Investors
Financial Performance Since 2014

     Total Revenue                                                      Adjusted EBITDA                                 EBITDA Margin Progression vs Peers
     $ MM in Constant FX1                                               $ MM in Constant FX1                            %

                                                                                                                                                    3.3
                                                                                                                                 2.6
          6.914                                        6,994                                                    280
                         6.735          6.634
                                                                                              254      249

                                                                                213
                                                                                                                                 5.7               6.2

                                                                                                                                  2.6     +0 bps    2.6

         FY14A           FY15A          FY16A          FY 17A                 FY14A          FY15A    FY16A    FY 17A           FY14A              FY17A

     $MM in Reported FX                                                 $MM in Reported FX
       7,8643           6,959           6,646            6,994               2423            273     254      280

1 Constant FX retranslates all years at 2017 FX rates for both revenue and Adjusted EBITDA
2 Operating Cash Flow post Dividends Received from Anji-JV, Tax and Capital Expenditure
3 Including S.I.T.T.A.M. S.r.l. operations ($107 MM Revenue, $ 3 MM EBITDA)

10
Strong Quarterly Momentum – Continued Good Trading in Q1

     Total Revenue Growth                                          Adjusted EBITDA Growth
     YoY, % in Constant FX                                         YoY, $ MM in Constant FX

                                 6.2                                                                                        12
                                                  5.7
                                                          5.4                                                                       11
                                         5.0                                                                9       9
                         4.7
                 3.9                                                                         Sale of PPE
                                                                                               in 2016

                                                                             Peaks trading
                                                                                                  1

        0.7                                                            (1)

                                                                                 (4)
       Q3 16   Q4 16    Q1 17   Q2 17   Q3 17    Q4 17   Q1 18       Q3 16     Q4 16          Q1 17        Q2 17   Q3 17   Q4 17   Q1 18

      Key LTM figures:
      • Revenue growth (const FX.):             + 5.5 %
      • Adjusted EBITDA:                        $ 291m , up $40m
      • Operating Cash Flow:                    $ 202m, up $45m

11
Further Margin Improvement Opportunity

     Freight Management EBITDA Margin                                                            Example: Air Freight KPIs
     %, FY17A1                                                                                   Volume Growth, % YoY, FY17A
            7.1                                                                                                      20
                             6.3
                                                                                                        12                                              11
                                                                                                                                   8        9

                                              2.5              2.6                        3.0
                                                                              2.3
                                                                                          A&O2
                                                                                                 Yield, Net Revenue / Ton, FY17A, $3
                                                                                                                                                       1.100
                                                                                                       645          703           684
                                                                                                                                           480

     Contract Logistics EBITDA Margin
     %, FY17A1
            8.3
                                                                                                 Conversion Rate, EBITDA / Net Revenue, FY17A, %
                             6.2               6.0
                                                                                                                     32                                 37
                                                                     4.1                                                          20        16
                                                                                    3.2                 13

                                                                                                                                                   4           5

1 EBITDA before specific items
2 Air and Ocean, part of FM                                                                      ▪ Good volumes
3 Converted to $ from local currency at spot exchange rate as of March 2018                      ▪ Decent yields
4 Approximate, based on Global Forwarding results, breakdown into Air and Ocean not available
5 Air & Ocean Freight combined                                                                   ▪ Conversion lower due to still too high cost base
SOURCE Company Reports

12
Significant Medium-Term Earnings Improvement Potential

EBITDA
Margin1        3.3%                                                                                    > 4.0%                  Key Initiatives
                                                                                                                Margin Improvement
                                                                                                                ▪ Narrow FM productivity gap through
                                                                                                                  process improvements / automation
                                                                                                                ▪ Improve performance at key CL operations
                                                                                                                ▪ Address low-margin businesses (e.g. US
                                                                                                                  other FM, CL low margin contracts)
                                                                                                                ▪ SG&A efficiency
            $280 MM
                                                                                                                ▪ Commercial acumen, pricing

                                                                                                                Accelerated Revenue Growth
                                           ▪ FM Margin: 2.3% to c.3.5%                                          ▪ Strengthen key account relations, increase
                                           ▪ CL Margin: 4.1% to 4.5% – 5.0%                                       share of wallet
                                                                                                                ▪ Develop more multi-national customers,
                                                                                                                  new names
                                                                                                                ▪ Leverage products and solutions expertise,
           Adj. EBITDA          Growth         FM Margin      2
                                                                  CL Margin     2
                                                                                     Anji JV
                                                                                 Adj. EBITDA                      innovate
             FY 17A                                                                Target
                                                                                                                ▪ Selective M&A
                                                                                  Medium
                               Contribution to EBITDA improvement – illustrative    Term
                                                                                       Longer Term
                                                                                          > 5.0%
1 EBITDA margin excludes share of Anji JV EBITDA and is before specific items and share-based compensation
2 Including SG&A

13
Examples of achieved and upcoming margin improvement initiatives

  FM Productivity                                CL Productivity                                 Indirect Cost
   Example: Ocean Freight                        Example: Aftermarket Contracts                  Example: Finance Shared Service Center
   Files / Operator                              Lines (‘000s) per Head per Hour                 FTE, Constant Scope

                                         75                                                             514

                                                                         Upper quartile
                                                                                                                     388
                          56

            42
                                                                                                                                   c. 250
                                                                          Double-digit $MM
                                                                            improvement
                                                                             opportunity

          FY15A          FY17A      Benchmark1    0             10            20           30         Mar-17        Dec-17      Benchmark1

     ▪   >20% productivity potential from        ▪    Double-digit $million potential on c.50    ▪   Headcount reduction achieved through
         automation, process standardisation,         auto / industrial aftermarket contracts        process standardisation and automation –
         training                                ▪    Focused contract approach is expected to       working on further > 30% reduction,
     ▪   Further cost reduction in support            yield results in other sectors also            partially contractually guaranteed
         functions                                                                               ▪   Important opportunity also in retained
                                                                                                     organisation – finance, general
                                                                                                     management, HR, etc.

1 Management estimates

14
Deleveraging Will Unlock Additional Opportunities

     ▪   Additional business opportunities with existing and new clients where CEVA is currently
         not considered
         – Positive client reaction to IPO
         – Already engaging on several new discussions, expect impact in 2018
     ▪   More favourable terms and conditions with suppliers/customers (pricing, payment
         terms, guarantees) – benefit to cost and NWC
     ▪   Interest cost reduction from lower debt and refinancing – expect >$100m reduction in
         annual finance charges
     ▪   Ability to undertake selected value-creating investments and, at some stage,
         bolt-on acquisitions
     ▪   Freeing up management time – talking business rather than financial position

15
CMA CGM – our new Strategic Partner

                                          ▪ 3rd largest container shipping group
                                            worldwide with >500 vessels, flagship carrier
                                            of the Ocean Alliance (with COSCO, others)

                                          ▪ Eventually 24.99% shareholder, has
                                            nominated two directors to CEVA’s Board

                                          ▪ Arms length supplier to CEVA in ocean freight
                                            – CEVA will continue to work as always with
                                            other ocean carriers

                                          ▪ CEVA and CMA CGM are exploring business
                                            opportunities to expand geographic coverage
                                            and offer integrated end-to-end solutions

     The photos are credited to CMA CGM
     Source: CMA CGM

16
Capital Structure, Refinancing and Dividend Policy

                                                            ▪ Leverage c.3x following IPO1
           Capital Structure                                ▪ Further deleveraging towards 1.5x- 2x over time
                                                            ▪ Temporary higher leverage if selective M&A

                                                            ▪ IPO proceeds used to repay debt
                                                            ▪ Plan to refinance large parts of remaining debt in coming
           Debt Refinancing                                   months
                                                            ▪ Expect significantly reduced interest rates post transaction,
                                                              c. 4.5% vs. current 6.5%2

                                                            ▪ Delivering shareholder returns through share price
                                                              appreciation and dividend
           Dividend Policy                                  ▪ Target to pay a first dividend in FY19 for FY18
                                                            ▪ Payout of at least 40% once further delevered
                                                            ▪ Detailed policy to be defined by new Board

1 Leverage expressed as 2017 PF Net Debt divided by LTM Adj. EBITDA;
2 Based on base rates and spreads at time of IPO; actual rates could differ

17
Wrap-up

          Favourable industry dynamics – Poised to benefit from
     1    structural growth and ongoing consolidation

          Strong strategic platform – Uniquely positioned through
     ☻2   broad service offering, global presence, blue-chip customer base
                                                                             What CEVA can achieve:
          and solutions capabilities
                                                                                Revenue growth
          Business much transformed – New management has                         above market,
     3    strengthened the business and improved results                          at least >4%

                                                                                 EBITDA Margin
          Further important earnings upside – Clear plans and                  > 4% medium-term
     4    continued disciplined execution of important cost and growth
          opportunities
                                                                                 > 5% long-term

          Attractive financial profile – Flexible, asset-light business
     5    model and deleveraging will support cash generation

18
A
Appendix
Freight Management at a Glance

                          Air Freight                                   Ocean Freight                           Other Services
                          ▪ Air Freight Services                         ▪ Full Container Load                                              Additional
                            – Standard                                   ▪ Less than Container                  Ground                      Services
                                   expedited service                          Load                              ▪ Full and less-than-full   ▪ Value Added Service
                               – Shipment with                           ▪ Freight Management                     truckload services          (VAS) – complemen-
                                   transit time 48 –                                                                                          ting services e.g.
Short                                                                         Services                          ▪ Expedite network US         cross-docking,
                                   96 hours
Description                                                              ▪ Ocean Charter and                    ▪ Dedicated transport         packing/repacking
of Activities
                               – Consolidation                                Project Solutions
                                   through CFS                                                                  ▪ Asset-light model         ▪ Customs brokerage
                          ▪    Air Charter and On-                                                                                            (standalone)
                               board Courier

Selected                  ▪ Global #71 with 480k                         ▪ Global #121 with 729k ▪ Total Ground shipments 2.4 MM
Facts                          tons of volume                              TEUs of volume        ▪ 0.5% EBITDA margin
2017 –                    ▪    Gross revenues of                         ▪ Gross revenues of
Illustrative                   $1,384 MM                                      $962 MM
                          ▪    2.9% EBITDA margin                        ▪    3.2% EBITDA margin
                          ▪    13% conversion ratio                      ▪    15% conversion ratio

1 Transport Intelligence report, Global Freight Forwarding 2017; ranking in Revenue for Air and TEU for Ocean
Note: Product financials based on management estimates and cost allocations not audited

20
Contract Logistics at a Glance

                          Warehousing and                         Transportation and                  Supply chain
                          value added services                    distribution                        solutions
                          ▪ Central & regional distribution ▪ Just-In-Time transportation & ▪ Supply chain design and
                               centers                              sequencing                          execution over multiple modes
                                                                                                        and geographies
                          ▪ Light manufacturing /                 ▪ Outbound / store delivery incl.
Description                    customization and other value        mission-critical spares           ▪ Controlling and monitoring
                               added services                                                           solutions
of Activities                                                     ▪ White Glove delivery and
                          ▪ Returns and reverse logistics           installation                      ▪ 4PL service offering integration
                                                                                                        and management of other 3PL
                          ▪ Quality control and export                                                  providers
                               services

                          #51 Global Player in CL specializing in end-to-end supply chain solutions
Selected
                          c. 28MM order lines and shipments per month
Facts
2017 –
                          c. 9MM sqm warehouse space, over 750 locations in >30 countries
Illustrative
                          Revenues of $3,724MM and EBITDA of $154MM (4.1% margin)

1 Transport Intelligence report, Global Contract Logistics 2017

21
Customer Portfolio – Blue Chip Customer Base, Well Balanced across
Industry Sectors
Customer Facts                                                     Industry Sector Coverage and Customer Examples

 ▪ Strong base of multi-national customers                                        Share of
                                                                                                   Up from 24% in FY14A
                                                                                  Revenue1
     — 57% of Revenue with top 100 accounts
                                                                   Consumer
                                                                                    29%
     — 39% of Revenue with Fortune Global 500 Companies            & Retail

 ▪ No customer greater than 3.5% of Revenue (FY17A)
                                                                   Automotive       25%
 ▪ Top 30 customers:

     — Represent 41% of Revenue
                                                                   Industrial &
                                                                                    22%
     — Average relationship of 15 years                            Aerospace

     — 29 served in CL and FM ‒ cross-selling is working

     — 29 served in more than 10 countries                         Technology       15%

 ▪ Substantial room for growth even with key accounts: CEVA’s
     estimated share of wallet is 3.1%                             Healthcare        5%
 ▪ Margins of top accounts in line with average margins

 ▪ Differentiated go-to-market approach for key accounts, global   Energy            3%
     customers and medium-local customers

1 As of FY17A; 1% of Revenue in other / non-classified

22
Significant Performance Improvement in 2017

 EBITDA Bridge – Management Estimate
  $ MM

                                                                                                                                                  280
                                                                                                                                18     9
      254
                                                                                                                   64
                          (5)
                                              (17)
                                                                                                         21
                                                                 (34)
                                                                                     (29)

                                                                                                ▪ Underlying c. $100 MM improvement
                                                                                                ▪ Annualised cost savings >$120 MM

                                                      1                   2                 3                  4         5                   6
     EBITDA            Currency             Sale of             Bonus               A&O               Growth       DOE        SG&A,   Anji       EBITDA
     FY16A                                 Property              Cost              Margin                                     Other              FY17A
                                                                 Diff.            (Market)                                   Income

1 Proceeds from sale of property in FY16 of $17 MM
2 Difference in bonus cost FY17 vs FY16, lower payout in FY16 due to weak performance
3 A&O margin difference FY17 vs FY16, to a large extent from temporary margin pressure due to rate increases
4 EBITDA contribution at estimated flow-through margin
5 Direct operating expenses
6 Including $6 MM from sale of property in FY17

23
Freight Management Margin Improvement

  FM EBITDA Margin Progression, %
                                                                      A
                                                                          Narrow Air & Ocean Productivity Gap
                                                                          Example: Ocean Freight                Actions
                                                          c.3.5%          Files / Operator
                                                                                                      75
                                                                                                                ▪   Standardise processes
                                                                                                                ▪   Bolt-on technology
                                                                                            56                      enhancements /
                                                                                42                                  automation (CSP / RMS)
     2.3%
                                                                                                                ▪   Station improvement
                                                                                                                    program (LEAP)
                                                                                                                ▪   Training
                                                                              FY15A       FY17A    Benchmark1
                                                         Medium-                                                        Targeting > 20%
     FY17A          A       B          C          D        Term                                                       productivity increase
                                                         Aspiration
                                                                      D
                                                                          Address Low-margin / Loss-making Activities
         Narrow Air and Ocean productivity gap through process
     A   improvements and technology                                      Example: Other FM –VAS                Actions
                                                                          EBITDA, $MM
                                                                                                                ▪   Downsize real estate /
     B   Improve net revenue: procurement and pricing                                                               relocate
                                                                                                     >0
                                                                                                                ▪   Re-pricing, portfolio
     C   Strengthen Ocean and grow through solutions                                                                review

         Address our low margin / loss-making activities in                                                     ▪   Ops processes site-by-
     D Other Services                                                                      > -10                    site apply CL
                                                                              FY16A       FY17A     Target          methodology

                                                                                                                            > 10 $ MM
1 Management estimates                                                                                                    loss reduction

24
Contract Logistics Margin Improvement

  CL EBITDA Margin Progression, %
                                                                             A
                                                                                 Improve Performance in Focus CL Operations
                                                                                 Aftermarket contracts opportunity          Actions
                                                                 4.5-5.0%        Lines per head per hour                    ▪ Opportunities identified
                                                                                                                              through benchmarking
                                                                                                           Upper            ▪ Focused improvements at
      4.1%                                                                                                 quartile
                                                                                                                              selected contracts
                                                                                                                            ▪ Intensive BPE team on-site
                                                                                                             Double-digit     intervention to drive
                                                                                                                $MM           changes
                                                                                                            improvement
                                                                                                                just in
                                                                                                                            ▪ More than 30% productivity
                                                                                                             aftermarket      delivered on certain
                                                                                                                              contracts
                                                                                 -       5     10     15   20    25   30
                                                               Medium-Term                                                                Double-digit $MM
     FY17A            A              B              C      D                                                                                opportunity
                                                                  Target

                                                                             B
                                                                                 Address Low-Margin Contracts and Sites
     A Improve performance in focus CL operations
                                                                                 Contract distribution by EBITDA margin 1 Actions
                                                                                 Share of FY17A Gross Revenue (%)
                                                                                                                            ▪ Contracts categorized by one
     B    Address low-margin contracts and sites                                     Fully-costed view –                      key lever to focus action
                                                                                                                79%
                                                                                     many low margin                         – Operational improvement
          Win new business more effectively – Standardised                           contracts with
                                                                                                                             – Contract repricing
     C    solutions and showcases
                                                                                     positive gross
                                                                                     margin                                  – Scope / service change
          Commercial acumen – Discipline in pricing and                                                                      – Termination
     D capital employed                                                                      21%
                                                                                                                            ▪ Centrally managed and
                                                                                                                              monitored, executed by
                                                                                                                              cluster
                                                                                             0%
                                                                                                                                       > 10 $MM opportunity
1 Based on EBITDA margin. Excluding contracts below $2MM                                                                               to average zero margin

25
Business Development – Accelerating Growth

  A                                                                  B                                                   C
         Strengthen key account relations,                                     Develop more multi-national
              increase share of wallet                                          customers, increase shares                        Grow field sales effectively

           CEVA’s share of logistics spend,                                           Share of logistics spent, %                Field Sales Agents Added Value1
               top c. 45 customers %
                                                                                         3,1
        100% = $97bn                              3.1%                                                                                           3,3x
                                                                                                                                    2,7x
                                                                                                          0,6

                                                                                      Current Key   Identified Hunting
                                                                                       Accounts        Customers                   FY15A         FY17A     Target

      Approach                                                           Approach                                            Approach
      ▪ Dedicated senior account                                         ▪ “Hunting” team set up in late                     ▪ Product training and coaching
        managers for top c. 45                                             2017, led by senior executive                     ▪ Rigorous weekly performance
        customers                                                        ▪ Targeted customer identification                    reviews
      ▪ Partnership emphasis                                               – 400 “hunting” customers (of                     ▪ Highly attractive commissions for
      ▪ Executive sponsorship                                              which 200 not yet served)                           top performers
      ▪ Proactiveness                                                    ▪ Willingness to invest in                          ▪ Terminating poor performers
                                                                           customers
                                                                                                                             ▪ Increasing headcount sales force
                                                                         ▪ Rigorous opportunity evaluation

                  Hypothetical impact
                                                                                        Sales opportunity                                  More sales, higher
                   of +0.5% share =
                                                                                            c.$300m2                                        effectiveness
                    $500m revenue

1 Defined as Field Sales agents Net Revenue generated as multiplier of compensation
2 Management estimate based on 0.1% increase in share of wallet

26
Robust, Standardized IT Platform to Support CEVA’s Global Business
and Future Aspirations

                             Overview Matrix solutions
                                                          Warehouse                    Transportation
                              One Freight System                                                                    Supply Chain
                                                          Management System            Management System
                              (OFS)                                                                                 Management (SCM)
                                                          (WMS)                        (TMS)
                             ▪ Single global system      ▪ Global standards           ▪ Fully integrated with      ▪ Comprehensive
                               (export to import)          developed, being              WMS and OFS                 supply chain tools,
                             ▪ Manage freight across       rolled-out (150+ in 2      ▪ Visibility, traceability     including asset, order,
                               multiple carriers /         years)                        of goods                    data transport, carrier
                               modes                     ▪ Still local / customer –   ▪ Fleet monitoring,            and disruption
                             ▪ Optimize global             specific systems              mobile app, PoD1, etc.      management
                               capacity allocation

                                                                                         In-House developed             In-House developed

Breadth of services delivered

               12 million                                Over 30,000 users                        2 Petabytes                                  $10 million
               transactions per month                    globally                                 operational storage                          in annual IT investment
               processed

                  Approx. 3,000 servers across                       More than 1,000 EDI connections                                    More than 850
                  5 global data centers                              with customers                                                     IT professionals globally

1 Proof of Delivery

27
Leadership Team

                                    Xavier Urbain                                 Peter Waller
                                         CEO                                          CFO
                                                                                                                            Wider Leadership Team
                                               Since Jan-14                              Since Oct-16                       ▪ 17 cluster MDs, e.g.:
                                                                                                                               — Nortam – US, Canada
                                               Kühne+Nagel,                              Eurofins,                             — SEA – SIN, Malaysia, Indonesia
                                               ACR,                                      Thomas Cook,
                                               Hays Logistics                            McKinsey, Alix                        — Benelux – Belgium, Netherlands
                                                                                         Partners                              — Italy
                                                                                                                            ▪ 25+ Group Functional Leaders
             Jérôme Lorrain                                  Brett Bissell                       Christophe Cachat          ▪ 125+ Senior Managers
                COO - FM                                      COO - CL                                  CIO
                        In Position                                    In Position                          Since Jun-14
                        Since Jan-161                                  Since Jul-14                                         Management Team Fundamentally
                                                                                                                            Changed Since 2014
                                                                       Flextronics,                         Kühne+Nagel,
                        Wallenborn,                                    Qualcomm                             ACR Logistics   ▪ Executive team:
                        Kühne+Nagel
                                                                                                                               — 7 out 8 newly appointed
                                                                                                                               — 4 out of 7 hired externally
                                                                                                                               — 52 years average age
             Kenneth Burch                                 Pierre Girardin                         Leigh Pomlett
                  CLO                                           CHRO                             Executive Director            — >20 years logistics experience
                        In Position                                    In Position                         Since Nov-10     ▪ Cluster MDs:
                        Since May-14                                   Since Jan-15
                                                                                                                               — 15 out of 17 newly appointed
                        TNT Logistics                                  TNT Logistics,                      Exel, DHL
                                                                       Caterpillar,                        Supply Chain        — 7 out 15 hired externally
                                                                       McKinsey                                                — 50 years average age
                                                                                                                               — >20 years logistics experience

1 Took responsibility as COO – FM in Nov-17, previously COO - Ground

28
Governance

      Board Structure:
         ▪       8 directors, including 2 from CMA; eventually 9 directors
         ▪       7 independent directors, including the new Chairman
         ▪       Corporate governance has been adopted in line with Swiss code of best practices

     Board composition

             Rolf Watter,                       Marvin Schlanger,              Emanuel Pearlman,
             Chairman                           Independent                    Independent
                                                Director                       Director

             John Smith,                        Rosalind Rivaz,                Victor Balli,
             Independent                        Independent                    Independent
             Director                           Director                       Director

             Rodolphe Saadé,                    Daniel Hurstel,                To be appointed,
             CMA                                CMA                            Independent
             representative                     representative                 Director

29
1Shareholder Structure post IPO
      After conversion of CMA securities, pre-greenshoe

                                                                 24.99%       CMA CGM

         Various institutional                            ~60%
         and retail investors
                                                                    ~15%
                                                                              Apollo, Franklin,
                                                                              Capital Research

         ▪ Diversified, long-term shareholder base
         ▪ CMA CGM securities to mandatorily convert into common shares following regulatory
           approvals

 30
30
Q1 2018 Financial Results Overview

      Quarter Ending                      Q1 2018                 Q1 2017                   Delta                 Q1 2017                   Delta
      31 March                                                                                                  at const. FX            at const. FX
                                         ($ million)             ($ million)           (%/$ million)             ($ million)           (%/$ million)
      Revenue                               1,790                   1,596                  12.2%                   1,699                    5.4%
      Adjusted EBITDA1                        66                      54                     12                      55                      11
      EBITDA Margin2                        3.0%                    2.8%                   20 bps                   2.6%                  40 bps
      Net Income                             (67)                    (57)                   (10)
      Change in NWC                         (120)                    (97)                   (23)
      Free Cash Flow                        (130)                   (133)                     3

      ▪ Last financials with old capital structure
      ▪ Good growth in Air, Ocean and Contract Logistics – 5.4% in const. FX
      ▪ 40 bps margin improvement in const. FX, better margin in both FM and CL
      ▪ Adjusted EBITDA up $11m in const. FX
      ▪ Net income as higher EBITDA, lower specific items but impacted by FX, higher finance
        charges, accelerated D&A
      ▪ Free Cash Flow improved yoy but seasonally negative

      1 Adjusted EBITDA includes the Group’s share of EBITDA from the Anji-CEVA joint venture, and excludes specific items and Share-based compensation (SBC) cost
      2 Before specific items and SBC; EBITDA excludes the Group’s share of EBITDA from the Anji-CEVA joint venture.

 31
31
Q1 2018 Results Freight Management
     All figures are before specific items and SBC

     Quarter Ending                                  Q1 2018          Q1 2017             Delta           Q1 2017            Delta
     31 March                                                                                          at constant FX   at constant FX
                                                 ($ million)         ($ million)      ( %/$ million)     ($ million)    ( %/$ million)
     Revenue                                          803               702              14.4%              739             8.7%
     Purchased Transportation                         (579)             (499)            16.0%             (527)            9.9%
     Net Revenue                                      224               203              10.3%              212             5.7%
     Personnel Cost                                   (137)             (127)                              (133)
                                                                                          8.3%                              3.5%
     Other Operating Expenses                         (72)              (66)                                (69)
     EBITDA                                            15                10                 5               10                5
     EBITDA Margin                                    1.9%              1.4%             50 bps            1.4%            50 bps
     Conversion rate
                                                      6.7%              4.9%            180 bps            4.7%            200 bps
     (EBITDA/Net Revenue)

      Revenue of               Q1 2018           YoY Growth           YoY Growth          Comments
      FM Products1                                                   at constant FX
                                                                                          ▪ Revenue growth of 8.7% from volume and
                              ($ million)               (%)               (%)
                                                                                            price
     Air                          335                 21.8%              13.9%            ▪ Cost growing less than revenue, reflecting
     Ocean                        247                 13.8%              6.0%               productivity/efficiencies
     Other FM                     221                  6.3%              4.2%             ▪ Margin up 50 bps
                                                                                          ▪ Conversion up 200 bps in const. FX
     1 Revenue by products excludes Miscellaneous operating income

32
Q1 2018 Results Contract Logistics
     All figures are before specific items and SBC

     Quarter Ending                          Q1 2018      Q1 2017         Delta           Q1 2017            Delta
     31 March                                                                          at constant FX   at constant FX
                                           ($ million)   ($ million)   (%/$ million)     ($ million)    (%/$ million)
     Revenue                                   987          894           10.4%             960             2.8%
     Net Revenue                               691          624           10.7%             671             3.0%
     Personnel Cost                           (412)        (373)                           (404)
                                                                          10.9%                             2.7%
     Other Operating expenses                 (241)        (216)                           (232)
     EBITDA                                     38           35             3               35                3
     EBITDA Margin                             3.9%        3.9%           0 bps            3.6%            30 bps

      Comments
      ▪ Revenue growth of 2.8% in const. FX – volume and new business partially offset by the transfer of the China
        CL activities to Anji JV (as of July 2017) and termination of certain contracts
      ▪ Growth particularly strong in Western/Central Europe, Turkey, Latin America and South-East Asia
      ▪ Productivity improvements at many contracts and cost savings
      ▪ Margin up 30 basis points in const. FX

33
Q1 2018 FM – Air and Ocean Volume and Yields

            Air export volumes (t) quarterly growth (YoY, in %)        Yield: Net Revenue/t ($)                                       +17.1%
                                                                                                                           772
                            15.6                                           659         641        657          626
                                    11.8
                                             10.2
               8.6

                                                              ~5%*
                                                       1.6

              Q1 17         Q2 17   Q3 17   Q4 17     Q1 18   Market       Q1 17      Q2 17      Q3 17        Q4 17       Q1 18
                                                              Q1 18
             Volumes (thousand t)
              105.6    121.8    122.9       129.6    107.3                 CEVA 2017 current quarter      CEVA prior periods         Market

            Ocean volumes (TEU) quarterly growth (YoY, in %)           Yield: Net Revenue/TEU ($)                                      0%
                                                                           286         289         282                         285
                                                       8.5                                                      266
                                              6.9
                5.9
                                                              4-5%*
                             3.5
                                     2.8

               Q1 17        Q2 17   Q3 17    Q4 17    Q1 18   Market       Q1 17      Q2 17       Q3 17        Q4 17       Q1 18
                                                              Q1 18
             Volumes (thousand TEU)
               167.4    180.0   192.4       189.1    181.6                 CEVA 2017 current quarter      CEVA prior periods         Market

     1 Company’s estimate

34
Group P&L - Historical Data

                                                                                             FY 17A Delta vs.                            FY 17
$ MM                              FY14A         FY15A         FY16A         FY17A
                                                                                                  FY16A                                Proforma
                                                                                           Reported Constant
                                                   Reported FX
                                                                                              FX         FX
Revenue1                          7,864         6,972         6,646         6,994             5.2%          5.4%                        6,994
Purchased
                                 (3,949)       (3,456)       (3,201)        (3,526)          10.2%         10.5%                        (3,526)
Transportation
Net Revenue1                      3,915         3,516         3,445         3,468             0.7%          0.7%                        3,468

Personnel                        (2,357)       (2,107)       (2,085)        (2,104)                                                     (2,104)
Other Net Operating                                                                           0.2%          0.2%
                                 (1,352)       (1,175)       (1,148)        (1,134)                                                     (1,134)
Expenses
EBITDA1                            206           234           212            230               18           22                          230

EBITDA margin                     2.6%           3.4%          3.2%          3.3%                                                        3.3%

Specific Items and SBC2            (64)          (23)          (59)          (45)               14           14                          (41)

D&A                               (183)         (171)          (153)         (129)              24           26                         (129)

Net Finance Expense               (368)         (267)          (195)         (258)             (63)          (74)                        (78)
Net Result from Joint
                                    16            17            19            23                4             5                           23
Venture
Tax                                (20)           15            17           (18)              (35)          (35)                        (24)

Net Income                        (413)         (195)         (159)          (197)             (38)          (42)                        (19)

Anji-CEVA EBITDA Share              36            39            42            50                8             9                           50

Adjusted EBITDA3                   242           273           254            280               26           31                          280
1 Before Specific Items and Share-based Compensation
2 SBC reported from FY15 onwards
3 Adjusted EBITDA includes the Group’s share of EBITDA from the Anji-CEVA JV, and before Specific Items and Share-based Compensation

35
Freight Management Financials - Historical Data

     $ MM                            FY14A1         FY15A           FY16A        FY17A             FY 17A Delta vs. FY16A

                                                        Reported FX                                Reported FX Constant FX

     Revenue2                         3,472          3,196          3,002         3,270                8.9%         8.6%

     Net Revenue2                       913           893            875            875                0.0%         (0.3%)

     Net Revenue Margin               26.3%          27.9%          29.1%        26.8%               (2.4%)         (2.4%)

     EBITDA2                            26             64            65              76                 11           13

     EBITDA Margin                     0.7%          2.0%           2.2%            2.3%               0.1%         0.2%

     Conversion Ratio
                                       2.8%          7.2%           7.4%            8.7%               1.3%         1.5%
     (EBITDA / Net Revenue)

                                                              Gross         EBITDA        Conversion
                                     By Product3
                                                            Revenue4        Margin           Rate
                                    Air Freight               1,384          2.9%            13%
                                    Ocean Freight             962            3.2%            15%
                                    Other FM                  919            0.5%            1%

1 Business line segmentation changed in FY16, therefore FY14 figures not aligned to Annual Report
2 Excluding Specific Items and Share-based Compensation
3 Product financials based on management estimates and certain assumptions, notably cost allocations, not audited
4 Difference of $5 MM for sum of product Revenue compared to total FM Revenue due to miscellaneous other income

36
Contract Logistics Financials - Historical Data

$ MM                                    FY14A1           FY15A            FY16A            FY17A                 FY 17A Delta vs. FY16A

                                                              Reported FX                                     Reported FX         Constant FX

Revenue2                                 4,392            3,776            3,644            3,724                  2.2%               2.8%

EBITDA3                                   180              170              147              154                     7                  9

EBITDA Margin                            4.1%             4.5%             4.0%             4.1%                   0.1%               0.2%

                                                                                                    Underlying improvement
                                                                                                     across whole business:
                                                                                                    $26 MM / 50 bps margin4

1 Business line segmentation methodology changed in FY15, therefore FY14 figures not aligned to Annual Report; S.I.T.T.A.M. disposed in 2015, FY
  2014 Revenue of $107 MM and EBITDA of $3 MM
2 Excluding Specific Items, in new segment split (i.e. FY15 Revenue aligned with the restated figures in FY16 annual report)
3 Excluding Specific Items and Share-based Compensation
4 At constant FX; percent improvement calculated as FY17A EBITDA divided by FY16A EBITDA at constant FX, adjusted for sale of property of $16 MM

37
Specific Items - Historical Data

     Historical Evolution of Specific Items                           Breakdown of Specific Items and SBC1
                                                                                                                                  ▪   Lower levels of specific items under new
     $ MM, Reported FX                                                                                                                management team
                               New
                                                                       $ MM,
                                                                                          FY14A FY15A FY16A FY17A                 ▪   Still working through legacy issues
                                                                       Reported FX                                                    – Legal (e.g. independent contractor claims,
                            Management
                                                                                                                                            CIL litigation), Tax
                      101                                              Total Specific
                                                                                             64       23        59        45          – Certain restructurings (e.g. Italy)
                                                                       Items and SBC
                                                                                                                                      – Largest part is behind us
                                                                                                                                  ▪   SBC reflects current PE-type equity
                                                                       SBC                    -        1        12         9          management plan, non-cash
               76
        74                                                                                                                        ▪   Restructuring costs relating to:
                                       64                              Specific Items,                                                – FY14: reorganisation/removal of regional
                                                                                             64       22        47        36
                                                                       Thereof:                                                             management structure
                               58
                                                                                                                                      – FY 16/17: Excellence Program
                                                       47
                                                                       Litigation &
                                                                                             18        -        15         -      ▪   $30 MM restructuring charges in FY17 with
                                                                       Legacy Tax                                                     short paybacks and lasting improvements, key
                                                               36                                                                     items:
                                                                       Write-offs             -        6         -         -          – $10 MM US turnaround (>1,000
                                                                                                                                            redundancies)
                                               22
                                                                                                                                      – $6 MM Italy restructuring (>200 people,
                                                                       Advisory,
                                                                       Other2
                                                                                              7       12         9         6                expected >$9 MM p.a. saving for total
                                                                                                                                            expected cost of c.$15 MM)
                                                                                                                                      – $5 MM Benelux delayering (>80 people, $4
                                                                       Restructuring         40        4        23        30                MM p.a. savings)
      FY10A           FY12A           FY14A           FY16A
              FY11A           FY13A           FY15A           FY17A                                                               ▪   Some restructuring charges still in 2018, not
                                                                                                                                      much anticipated for 2019

1 Due to changes in accounting policy, historical (FY10 – FY14 inclusive) Specific Items exclude Share Based Compensation (SBC)
2 Reflects advisor costs related to strategic project

38
Constant FX Performance - Historical Data

     ($ MM)                                2014     2015     2016    2017

     Revenue (as reported)                 7,864   6,959    6,646    6,994

     Revenue at average 2017 FX rate       6,914   6,735    6,634    6,994

     Constant FX Revenue Growth              -     (2.6%)   (1.5%)   5.4%

     Adj. EBITDA (as reported)              242     273      254      280

     Adj. EBITDA at average 2017 FX rate   213      254      249     280

39
Capital Expenditures- Historical Data

     Capital Expenditures
     $ MM, Reported FX                                                         ▪   Higher investments under new
                                                                                   management team
                                                                      102
                                                                               ▪   Net capex over the last three years ($89
                                               91                                  MM) in line with D&A adjusted for
                                                                       24          amortisation of acquisition intangibles ($83
                                                                                   MM)1
                                                               74
                                               36                              ▪   Investments in PP&E predominantly
                  66                                                               racking, other equipment, facility fit-outs
                                                               28              ▪   Intangibles represent capitalised IT
                  21                                                               development as well as licenses, etc.
                                                                               ▪   Capex predominantly weighted towards CL
                                                                       78          for new contracts / renewals but also
                                                                                   maintenance
                                               54
                  45                                           46              ▪   CL contract-related capex typically
                                                                                   amortised over contract term; other
                                                                                   investments normally c. 5 years
                                                                               ▪   2017 includes c.$10 MM of customer
                                                                                   funded capex (reimbursed as incurred) and
                FY14A                       FY15A             FY16A   FY17A
                                                                                   $15 MM historically funded off-balance
              PP&E             Intangibles                                         sheet (operating lease)

                                                                              Contract Logistics2: $79 MM
1 Amortisation of customer relationships of $53 MM in FY17A                   Freight Management2: $23 MM
2 Based on gross capex of $102 MM in FY17A

40
Net Working Capital - Historical Data

 NWC Evolution (End of Period)                                                                     Working Capital Achievements and Further Opportunities

     $ MM

          0                                                                                              (3%)       Overdues reduced by $20m in 2017; 12%
                                                                                                                    of total AR in Dec 2017
      (50)

     (100)
                                                                                                                    Across 2017 we received payments from
                                                                                                                    customers 1 day earlier on average than in
     (150)                                                                                                          2016
                                                                                          (2.7%)
     (200)                                                                                (2.8%)

                                                                                                                    12% reduction in unbilled in CL and FM
     (250)
                                                                                          (3.6%)                    from Dec 2016 to 2017

     (300)

              Q1                      Q2                      Q3                      Q4                            Held terms with suppliers despite greater
                                                                                                                    use of suppliers with short-terms (e.g.
                    FY17A               FY16A                FY15A
                                                                                                                    charters)

1 Defined as Days Sales Outstanding less Days Payables Outstanding; comparing Dec-17 to Dec-16

41
Cash Flow Overview - Historical Data

  $ MM, Reported FX                                           FY14A                  FY15A                    FY16A        FY17A

  EBITDA before Specific Items and SBC                         206                     234                      212         230

  Cash-Relevant Specific Items1                                (64)                    (23)                     (31)       (43)

  Gain on Disposal of PP&E                                      (2)                     (1)                     (17)        (1)

  Retirement Benefit Obligations                               (10)                     (5)                     (5)         (8)

  Provisions                                                   (11)                     (2)                      11         (2)

  Change in Working Capital                                      -                      11                      (42)        33

  Other                                                        (17)                      2                       15          -

  Operating Cash Flow                                          102                     216                      143         209

  Dividends Received (Anji JV)                                  18                       -                       27         15

  Net Finance Expenses                                         (229)                  (166)                    (170)       (178)

  Tax                                                          (29)                    (22)                     (39)       (37)

  Capital Expenditure                                          (66)                    (91)                     (74)       (102)

  Free Cash Flow                                              (204)                    (63)                    (113)       (93)

                                                                                   ▪ Management Normalisations
                                                                                     — Higher growth / NWC in Q4: $28 MM
                                                                                     — Asset financed within FCF: $15 MM
                                                                                   ▪ Management Normalised FCF of ($50 MM)

1 Specific Items only categorised into Cash and Non-Cash from FY16; prior years assume all Specific Items are Cash Items

42
Balance Sheet December 31, 2017

     $ MM                        FY17A   $ MM                                FY17A

     Property, Plant and                 Equity Attributable to the Equity
                                  169                                        (677)
     Equipment                           Holders of the Parent Company

     Goodwill                    1,346   Non-controlling Interests            3

     Other Intangibles            102    Total Equity                        (674)

                                         Borrowings                          2,197
     Others                       356
                                         Retirement Benefit Obligations       111
     Non-current Assets          1,973
                                         Other                                193

     Trade Receivables           1,053   Non-current Liabilities             2,501

     Cash and Cash Equivalents    295    Trade and Other Payables            1,449

                                         Borrowings                           187
     Others                       226
                                         Others                               84
     Current Assets              1,574
                                         Current Liabilities                 1,720

     Total Assets                3,547   Total Liabilities and Equity        3,547

43
Debt Repayment with IPO Proceeds

          $ million                                              31.12.2017   31.03.2018   Repayment

         Cash and cash equivalents                                  295          203

         Revolver due March 2019                                     0            0
         Term loans due March 2021                                  756          757         Partial
         US ABL Facility due August 2020                            186          190
         ABS Europe due March 2020                                  185          185
         Australian Receivables Facility due September 2020         31           35
         7.0% First Lien Senior Secured Notes due March 2021        297          298          Full
         4% Senior Secured Notes due May 2018                       39           39           Full1
         9% First Lien Senior Secured Notes due September 2020      371          422
         Finance Leases and Other Secured Debt                      33           34

         9.0% 1.5 Lien Priority Lien Notes due September 2021       322          323          Full

         12.75% Senior Notes due March 2020                         27           27           Full
         Other Debt                                                 137          121         Partial
         Net Debt                                                  2,089        2,228

                  ▪ $1.1bn of debt repaid
                  ▪ Other facilities to be repaid in due course

       1 Repaid prior to completion of IPO

4444
Thank you

45
You can also read