INVESTOR PRESENTATION - FCA Bank Group

Page created by Leonard Logan
 
CONTINUE READING
INVESTOR PRESENTATION - FCA Bank Group
I N V E S T O R P R E S E N TAT I O N
             2017 H1
INVESTOR PRESENTATION - FCA Bank Group
Disclaimer
By opening this presentation and/or attending the meeting where this presentation is made, you agree to be bound by the following limitations and restrictions.

This presentation is solely for use at a meeting where this presentation is to be held. It is for information purposes only and does not constitute or form part of, and should not be construed as, any offer for sale or subscription of, or solicitation of
any offer to buy or subscribe for, any securities of FCA Bank S.p.A. or any of its subsidiaries (together, “FCA Bank”), nor should this presentation or any part of it form the basis of, or be relied on in connection with, any contract or commitment
whatsoever. If any offer for any such securities is made, it will be done so pursuant to separate and distinct documentation in the form of a prospectus or offering circular and such other documentation as may be required for the purposes of such
an offer and any decision to purchase or subscribe for any securities pursuant to such offer should be made solely on the basis of such prospectus, offering circular or other documentation and not this presentation. This presentation may be
amended and supplemented, but may not be relied upon for the purposes of entering into any transaction. This presentation is strictly confidential, is being distributed to a limited range of persons solely for their own information and may not (i) be
distributed to the media or disclosed to any other person in any jurisdiction, nor (ii) be reproduced in any form, in whole or in part, without the prior written consent of FCA Bank. This presentation does not constitute a recommendation regarding
any securities of FCA Bank.

The information in this presentation is confidential and this document is being made available to selected recipients only and solely for the information of such recipients. This document may not be reproduced, redistributed or passed on to any
other persons, in whole or in part. This presentation is not intended for distribution to or use by any person or entity in any jurisdiction or country where such distribution or use would be contrary to local law or regulation.

The information set out in this presentation may be subject to updating, revision, verification and amendment and such information may change materially. In giving this presentation, none of FCA Bank nor any of its affiliates, subsidiaries,
shareholders, representatives, agents, employees or advisors, undertakes any obligation to amend, correct or update this presentation or to provide the recipient with access to any additional information that may arise in connection with it. FCA
Bank is under no obligation to update or keep current the information contained in this document and any opinion expressed herein is subject to change without notice. None of FCA Bank S.p.A. nor any of its affiliates, subsidiaries, shareholders,
representatives, agents, employees or advisors shall have any liability whatsoever (in negligence or otherwise) for any loss whatsoever arising from any use of this document or its contents, or otherwise arising in connection with this presentation.
No representation, warranty or undertaking, express or implied, is made or given by or on behalf of FCA Bank or any of its affiliates, subsidiaries, shareholders, representatives, agents, employees or advisors, as to, and no reliance should be
placed on, the fairness, accuracy, completeness, fairness or correctness of the information or the opinions contained herein or any other material discussed at the presentation and no responsibility or liability is assumed by any such persons for
any such information or opinions or for any errors or omissions

This document is an advertisement and does not constitute a prospectus for the purposes of Article 2003/71/EC (as amended) (the “Prospectus Directive”).

In any member state of the European Economic Area, this presentation is directed only at “qualified investors” within the meaning of Article 2(1)(e) of the Prospectus Directive (Directive 2003/71/EC as amended, including by Directive 2010/73/EU).

This presentation and the information contained herein are not an offer of securities for sale in the United States and are not for publication or distribution to persons in the United States, its territories or possessions or to any U.S. person (within
the meaning of Regulation S under the United States Securities Act of 1933, as amended (the “Securities Act”)) or in any other jurisdiction where it is unlawful to do so. Any failure to comply with this restriction may constitute a violation of U.S.
securities laws. This presentation is not an offer of securities for sale in the United States.

This presentation is being communicated in the United Kingdom only to persons who have professional experience in matters relating to investments falling within Article 19(5) of the Financial Services and Markets Act 2000 (Financial Promotion)
Order 2005 (the “Order”) and to persons to whom it may otherwise be lawful to communicate it to (all such persons being referred to as relevant persons). This presentation is only directed at relevant persons and any investment or investment
activity to which the presentation relates is only available to relevant persons or will be engaged in only with relevant persons. Other persons should not rely or act upon this presentation or any of its contents.

This document is for distribution in Italy only to "qualified investors" (investitori qualificati), as defined pursuant to Article 100, paragraph 1(a), of Legislative Decree no. 58 of 24 February 1998, as amended and restated from time to time (the
“Financial Services Act”), and as defined in Article 34-ter, paragraph 1(b) of CONSOB Regulation no. 11971 of 14 May 1999, as amended and restated from time to time (the CONSOB Regulation), or in other circumstances provided under Article
100 of the Financial Services Act and Article 34-ter, CONSOB Regulation, where exemptions from the requirement to publish a prospectus pursuant to Article 94 of the Financial Services Act are provided.

These materials may contain projections and forward-looking statements. Forward looking statements, projections, objectives, estimates and forecasts are generally identifiable by the use of the words “may,” “will,” “should,” “plan,” “expect,”
“anticipate,” “estimate,” “believe,” “intend,” “project,” “goal” or “target” or the negative of these words or other variations on these words or comparable terminology. Forward-looking statements involve known and unknown risks, uncertainties and
other factors which may cause FCA Bank's actual results, performance or achievements to be materially different from any future results, performance or achievements expressed or implied by such forward-looking statements. These forward-
looking statements include, but are not limited to, all statements other than statements of historical facts, including, without limitation, those regarding FCA Bank’s future financial position and results of operations, strategy, plans, objectives, goals
and targets and future developments in the markets where FCA Bank participates or is seeking to participate. All statements, other than statements of historical facts, contained herein regarding FCA’s strategy, goals, plans, future financial
position, projected revenues and costs or prospects are forward-looking statements. Forward-looking statements are subject to inherent risks and uncertainties, some of which cannot be predicted or quantified. Any such forward-looking
statements will be based on numerous assumptions regarding FCA Bank's present and future business strategies and the environment in which FCA Bank will operate in the future. Further, any forward-looking statements will be based upon
assumptions of future events which may not prove to be accurate and future events or actual results could differ materially from those set forth in, contemplated by or underlying forward-looking statements. Any such forward-looking statements in
these materials will speak only as at the date of these materials and FCA Bank assumes no obligation to update or provide any additional information in relation to such forward-looking statements. By attending the meeting where this presentation
is made or by accepting a copy of this presentation, you agree to be bound by the foregoing and to maintain confidentiality regarding the information disclosed in this presentation.

                                                                                                                                                                                                                                                    2
INVESTOR PRESENTATION - FCA Bank Group
FCA Bank: a JV between FCA and Crédit Agricole
  FCA Bank is one of the largest specialized auto finance and lease companies operating in Europe,
  diversified across products, geographies and brands
  50 / 50 Joint Venture between Fiat Chrysler Automobiles and Crédit Agricole
  Long-Term Partnership signed in December 2006 and extended until December 2021, at least
  A unique business model, focusing on the automotive industry and combining the commercial
  effectiveness of an industrial partner, with the risk discipline and financial strength of a universal
  banking group
  FCA Bank is regulated as a bank by the Bank of Italy under the Italian Banking Act
  Board Composition: 10 members, 2 independent, 4 appointed by each shareholder

                                                                                                           3
INVESTOR PRESENTATION - FCA Bank Group
About FCA Bank
 Business deployed in 3 Business lines, 12 Brands, 18 Countries

 Significant brand diversification, compared to the other Automotive Captive European peers,
 offering services and open market solutions to:
           FCA brands                  Jaguar and Land Rover (Mainland Europe)
           Maserati                    Erwin Hymer Group (leisure vehicles)
           Ferrari

                                    FCA BANK RATINGS

                      Baa1 Long-term (Stable Outlook) / P-2 Short-term / A3 Deposits Long-term
                      (Negative Outlook)

                      BBB- Long-term (Stable Outlook) / A-3 Short-term

                      BBB+ Long-term (Stable Outlook) / F2 Short-term

                                                                                           4
INVESTOR PRESENTATION - FCA Bank Group
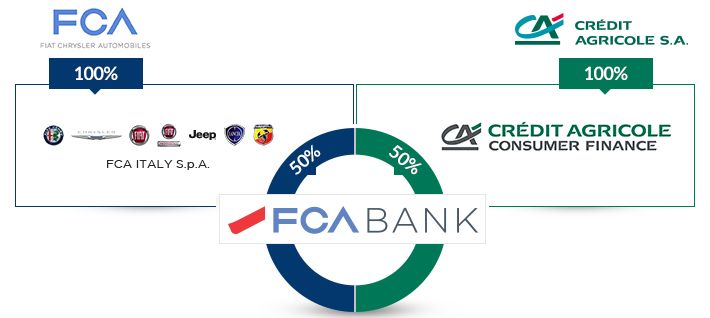
FCA Bank Group – Business Overview
Multi-Brand and Multi-Business

 Total Outstanding 2017 H1 (EoP): 22.7 €/Bn
                                                         Dealer Financing
 3 Business lines                              OEM Dealer Networks
                                               Outstanding 2017 H1 (EoP): 6.6 €/Bn
 12 Brands
                                               29% of outstanding assets
 27 Legal entities and 7 branches
                                                         Retail Financing
 2,066 Employees                                 Private customers
                                                 Channel: Dealership
 18 Countries                                    Outstanding 2017 H1 (EoP): 14.0 €/Bn
                                                 62% of outstanding assets

                                                         Long Term Rental
                                                 Corporate customers
                                                 Channel: Dealership/Direct
                                                 Outstanding 2017 H1 (EoP): 2.1 €/Bn
                                                 9% of outstanding assets

                                                                                         5
INVESTOR PRESENTATION - FCA Bank Group
FCA Bank Group –2017 H1 Highlights
 Outstanding commercial performance with an average managed portfolio equal to €
 21.2 Bn compared to € 17.8 Bn in the first half of 2016
 Net Banking Income increasing compared with previous years
                                                           INTERNATIONALIZATION ROAD MAP
 Cost of risk improving
 Cost of funding decreasing
 Net Profit reaching € 190 M, best ever half-year result
 Stronger liquidity position enhanced by further diversification on secured and unsecured
 capital markets
 Core Tier 1 set at 11.4% (Consolidated perimeter); Equity equal to € 2.4 Bn

                                                                                           6
INVESTOR PRESENTATION - FCA Bank Group
Performance Indicators

 (€ and %)                                                                                                                                               2017
                                                   2007        2008      2009      2010      2011      2012      2013      2014      2015      2016
                                                                                                                                                          H1

 Average Managed Outstanding                     14.6 Bn      15.5 Bn   15.5 Bn   16.4 Bn   15.8 Bn   14.9 Bn   14.6 Bn   14.7 Bn   16.1 Bn   18.5 Bn   21.2 Bn

     Net Banking Income /
                                                   3.5%        3.5%      3.7%      3.7%      3.9%      4.1%      4.0%      3.8%      4.2%      4.0%      3.9%
 Average Managed Outstanding

               Net Profit                         119 M       137 M     105 M     147 M     153 M     167 M     172 M     182 M     249 M     312 M     190 M

                  CET 1                            7.2%        8.2%      8.0%      8.8%      9.2%     10.6%     11.0%     11.7%     11.2%*    11.3%*    11.4%*

*Basel III Banking Group (effective 2015)

  Note:
  i) Managed Portfolio figures are net of credit risk funds

                                                                                                                                                           7
Capitalization Consolidated Perimeter
                    2007   2008   2009     2010      2011      2012      2013    2014    2015        2016     2017 H1
Outstanding EOP
(€/Bn)
                    14.9   15.2   16.1     16.1      15.9      14.5      15.0    15.3    17.2        20.8      22.7

                                  JVA perimeter / Basel II Rules                                 Basel III
                                                                                                               12,1%
                                                                                 11,7%
                                                                         11,0%           11,2%        11,3%
                                                               10,6%
                                                      9,2%                       11,7%                         11,4%
                                            8,8%                         11,0%           11,2%        11,3%
                           8,2%   8,0%                         10,6%
Total Capital
                    7,2%                              9,2%
Ratio                                       8,8%
                           8,2%   8,0%
                    7,2%

                                                                                                      312
 CET 1                                                                                   249
                                                                   167   172     182                            190
                           137              147       153
                    119           105
 Net Profit (€/M)
                    2007   2008   2009     2010      2011      2012      2013    2014    2015         2016    2017 H1

       FCA Bank subsidiaries not needing additional capital
       FCA Bank regulated legal entities above Minimum Capital Requirement "MCR"

                                                                                                                        8
Outstanding by Business Line End of Period
                                                                                    22,7
                                                                            20,8
 (€/Bn)                                                                              2,1
                                                                            1,7
                                                                17,2
     16,1     15,9                                                                   6,6
                                   15,0           15,3           1,4
                        14,5                                                6,0
     1,6       1,5
                                    1,3           1,3
                        1,3                                      4,8
     3,7       4,1
                        3,7         3,9           4,0

                                                                            13,0    14,0
     10,8     10,3                  9,8           10,0          11,0
                        9,5

    2010      2011      2012       2013           2014          2015        2016   2017 H1

                     Retail    Dealer Financing          Long term Rental

                                                                                               Spain   Other
                                                                                                6%     12%
                                                                                      France
                                                                                        8%

                                                                                     UK
      FCA Brands currently account for around 80% of                                 10%
      FCA Bank total portfolio                                                                   2017 H1
                                                                                                               Italy
                                                                                     Germany                   46%
                                                                                       18%

                                                                                                                       9
Key Financial Indicators
                  Net Banking Income (€/M) & Percentage                                                                             Cost / Income Ratio (%)
                  on Average Outstanding
                                             4,1%   4,0%          4,1%   4,0%
  800                                 3,9%                 3,8%                 3,9%            4,50%
                                                                                                        46,5%
                        3,7%   3,7%
  700
          3,5%   3,5%                                                                           4,00%
                                                                                                                 42,8%
                                                                         732                    3,50%                    40,6%        40,0%                               40,1%
  600
                                                                  667                                                                          38,8%      38,6%   39,4%
  500
                        576    596    609    608    587
                                                                                                3,00%
                                                                                                                                                                                  35,4%
                 536                                       566                  416             2,50%                                                                                     33,5%
  400
          517                                                                                                                                                                                     31,7%
                                                                                                2,00%
  300
                                                                                                1,50%
  200
                                                                                                1,00%
  100                                                                                           0,50%
      0                                                                                         0,00%
          2007   2008   2009   2010   2011   2012   2013   2014   2015   2016 2017 H1                   2007     2008        2009     2010     2011       2012    2013    2014    2015    2016    2017 H1

                          Net Banking Income         NBI / Average Outstanding

                                                                                                                     Net Profit (€/M) & Percentage on Average
            Pre-Tax Income (€/M) & Percentage on
                                                                                                                     Outstanding
            Average Outstanding
                                                                  2,2%   2,3%    2,4%                                                                                                     1,7%    1,8%
450                                                                                     2,5%

                                                                                                        350                                                                       1,6%
                                                                                                                                                                                                            1,70%
400                                          1,7%   1,7%   1,7%
                                                                         417            2,0%
                                                                                                        300
                                                                                                                                                                   1,2%   1,2%
350       1,3%                 1,3%   1,4%                                                                                                                 1,1%                           312
                 1,2%   1,2%                                      359                                   250
                                                                                                                                        0,9%       1,0%                                                     1,20%
300                                                                              259    1,5%

                                                                                                              0,8%    0,9%
                                                                                                                               0,7%                                               249             190
250                                                                                     1,0%
                                                                                                        200

200                                          257    248    257                                                                                                                                              0,70%
                               213    229                                                               150
                                                                                                                                                                   172     182
150       190    189                                                                                                                               153      167
                        184
                                                                                        0,5%

                                                                                                        100           137                147
100                                                                                                            119                                                                                          0,20%
                                                                                        0,0%
                                                                                                                                105
 50                                                                                                     50

  0                                                                                     -0,5%

                                                                                                          0                                                                                                 -0,30%
          2007   2008   2009   2010   2011   2012   2013   2014   2015   2016 2017 H1                         2007    2008     2009     2010       2011    2012    2013   2014    2015    2016 2017 H1

                 Pre-Tax Income        Pre-Tax Income / Average Outstanding                                                           Net Profit             Net Profit / Average Outstanding

           Sound performance highlighted by positive trend of all main financial indicators

                                                                                                                                                                                                                     10
Credit Risk Performance
                         Cost of Risk (€/M) & Ratio (%) on Average Outstanding

     160                                                                                                                2,50%
                             145         145        144
     140
                                                                                                                        2,00%
                   117                                      116
     120                                                            109

     100
           87                                                                   83                                      1,50%

      80                                                                                       70
                             0,93%       0,89%      0,91%
      60                                                    0,78%                                      55               1,00%
                   0,76%                                            0,75%
           0,60%
      40                                                                        0,57%
                                                                                                                27      0,50%

      20                                                                                      0,44%
                                                                                                      0,30%    0,25%
       0                                                                                                                0,00%

           2007    2008      2009        2010      2011     2012    2013        2014          2015    2016    2017 H1

                                     Provisions (€/M)                      Cost of Risk (%)

 Cost of Risk performance continuing to improve

                                                                                                                                11
Credit Quality
                                      December 31st, 2016                          June 30th, 2017
                                             Allowance for                           Allowance for
                                 Gross                         Net       Gross                         Net
                       (€/ M)               loan and lease                          loan and lease
                                Exposure                     Exposure   Exposure                     Exposure
                                                 losses                                  losses

Non-performing loans             298.1         (143.0)        155.1      283.5         (142.0)        141.5

Performing loans                18,540.6       (139.7)       18,400.8   20,121.5       (139.5)       19,982.0

Total                           18,838.7       (282.8)       18.555.9   20,405.0       (281.5)       20,123.5

                                      December 31st, 2016                          June 30th, 2017
                                 Gross                                   Gross
                                            Net Exposure     Coverage                Net Exposure    Coverage
                                Exposure                                Exposure
                                               weight          ratio                    weight         ratio
                                 weight                                  weight

Non-performing loans             1.58%          0.84%         47.98%     1.39%          0.70%         50.09%

Performing loans                 98.42%        99.16%         0.75%      98.61%        99.30%         0.69%

Total                           100.00%       100.00%         1.50%     100.00%        100.00%        1.38%

                                                                                                                12
Residual Value Risk

                    euro/mln                   December 31st, 2015   December 31st, 2016        June 30th, 2017
      Consumer loans and leases:
      - Residual Risk assumed by FCA Bank             1,086                   926                    952
                          of which UK market            1,036                    879                    878

                                                                 Provision for residual value         56
                                                                            Provision / Risk        5.88%

                    euro/mln                   December 31st, 2015   December 31st, 2016        June 30th, 2017
      Long-Term Rental:
      - Residual Risk assumed by Leasys                576                     638                    765

                                                                 Provision for residual value         41
                                                                             Provision / Risk       5.36%

                                                                                                                  13
Funding Sources Evolution
                                                                               21.2
                                                                       19.5
                                                                                          Bonds
                                                                                          CA Group
                                                                16.0            8,0       Deposits
        14.9   14.3   14.9   14.7   14.5                                7,5
(€Bn)
                                                  13.9   13.7                             Banks
         0,5                         0,5
                0,5                        13.0
                                                                 5,1                      ECB
                                                   2,3
                                            1,5           3,1
         5,2                                                                    2,9       Securitizations
                6,4    8,4    8,0    7,1                                2,8
                                                                                0,4
                                                                 2,7
                                            5,2    5,1                  0,2
                                                          4,1
                                                                                4,5                         17%
                                                                        3,8
         4,8
                                                                 4,1
                3,9           3,2    3,1           2,4    2,7
                       3,5                  3,0                                 1,8     38%
          -                                         -                   1,8
                 -             -      -                    -     1,0
                                             -
         4,3
                        -                                                                       2017 H1           21%
                3,5           3,5    3,8           4,1    3,8           3,5     3,7
                       3,0                  3,3                  3,1

                                                                                           2%
        2007   2008   2009   2010   2011   2012   2013   2014   2015   2016   2017 H1
                                                                                                            8%
                                                                                                  14%

                                                                                                                    14
CONTACTS
FCA Bank SpA

Riccardo Mesturino     Treasurer                   riccardo.mesturino@fcagroup.com
Niccolò Camerana       Debt Capital Markets & IR   niccolo.camerana@fcagroup.com

Bloomberg
Ticker: FCABANK

Website
www.fcabankgroup.com

                                                                                     15
You can also read