Investor Presentation - gruma

Page created by Kenneth Day
 
CONTINUE READING
Investor Presentation - gruma
Investor
Presentation
Investor Presentation - gruma
COMPANY OVERVIEW
Investor Presentation - gruma
GRUMA IS THE WORLD’S LARGEST CORN FLOUR AND TORTILLA
 PRODUCER, WITH OPERATIONS IN THE UNITED STATES, MEXICO, CENTRAL
 AMERICA, EUROPE, ASIA AND OCEANIA
                                  Subsidiaries                                     Products                 % Sales % EBITDA

  Family: 52%                      GRUMA USA                                       • Corn flour
                                                                                   • Tortillas, other
  Float:        48%

                                   GIMSA                                           • Corn flour                   54           59
   GRUMA,
 S.A.B. de C.V.                    GRUMA EUROPE                                    • Grits, corn flour
                                                                                   • Tortillas, other
  BMV: GRUMAB

     LTM SEP’181                  GRUMA CENTROAMÉRICA                              • Corn flour, other
  Sales: US$3.9 billion                                                                                           28
EBITDA2: US$628 million
                                                                                                                               27
Market Cap: US$5 billion3         GRUMA ASIA-OCEANÍA
                                  MISSION MEXICO                                   • Tortillas, other
  74 plants and 20,600
                                  TECHNOLOGY AND SERVICES
                                                                                                                   7           4
       employees
                                  ELIMINATIONS                                                                     6           4
         1                                                                                                         5           6
             Convenience translation at an exchange rate of Ps.18.8120/dollar as of September 30, 2018.
         2 EBITDA = Operating income + depreciation, amortization and impairment of long lived assets +(-) expenses (income)
 3        unrelated to core business operations.
         3 As of November 6, 2018
Investor Presentation - gruma
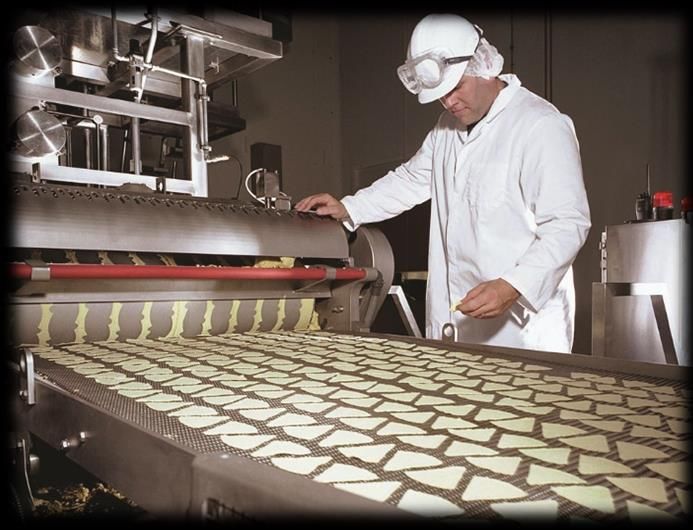
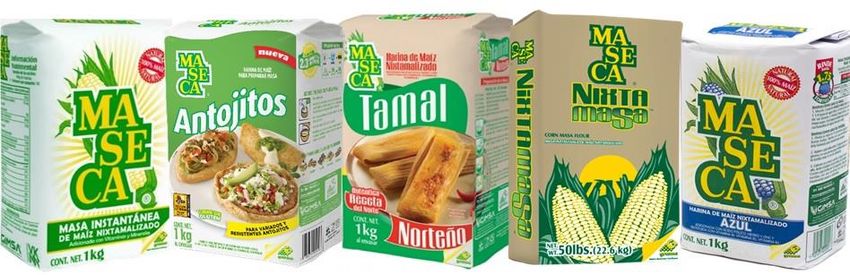
GRUMA’S LEADING BRANDS         SHOW   STRONG       AWARENESS   AND
CONSUMER LOYALTY

        REGION        BRANDS          PRODUCTS          POSITION

                                      CORN FLOUR           1

     UNITED STATES                    TORTILLAS            1

                                      TORTILLAS            2

        MEXICO                        CORN FLOUR           1

                                      CORN FLOUR           1

    CENTRAL AMERICA                   TORTILLAS            1

                                      TORTILLAS            2

        EUROPE                        TORTILLAS            3

     ASIA & OCEANIA                   TORTILLAS            1

4
Investor Presentation - gruma
GRUMA IS LEADING IMPORTANT PRODUCT INNOVATION TO SATISFY THE
  GROWING MARKET OF HEALTH-ORIENTED CONSUMERS
                                                • Consumers replacing breads with wraps

                                                • Increased popularity of healthier snack options, such as
                                                  gluten-free organic corn chips

To satisfy these megatrends, GRUMA
offers a line of healthier alternatives,
such as:                                          As a result, our healthier
                                                  product lines are generating
• Organic             • Multi-grain               low double-digit sales growth
• Gluten-free         • Fat-free
• Carb-balance        • Chia and quinoa wraps
• Preservative-free   • Baked tostadas
• Whole-wheat

 5
Investor Presentation - gruma
NEW PRODUCT LAUNCHINGS AND COLORFUL IN-STORE DISPLAYS
    ENHANCE SALES OF VALUE-ADDED AND HIGHER-MARGIN PRODUCTS

6
Investor Presentation - gruma
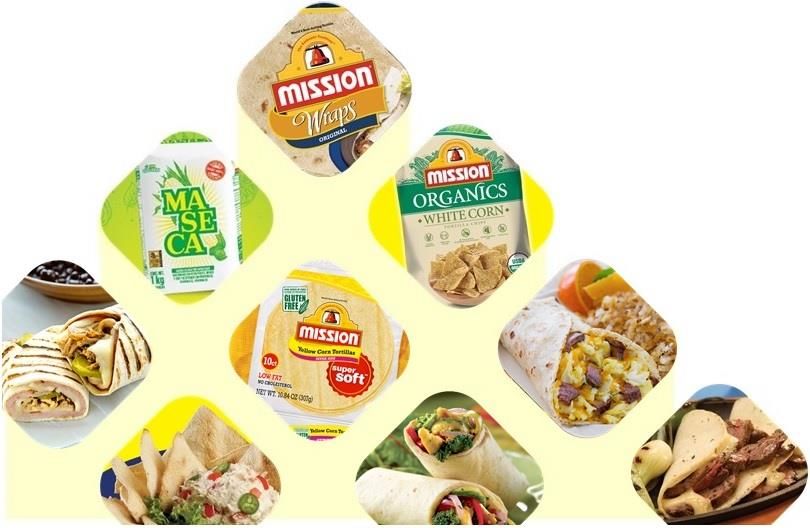
GRUMA HAS ACHIEVED CONSISTENT GROWTH IN NET SALES DRIVEN
MAINLY BY THE U.S. OPERATIONS…
                  GRUMA                                                  GRUMA
                  Volume                                          Net Sales and EBITDA
            (thousand metric tons)                                    (millions of pesos)

                    CAGR:                            CAGR Net Sales:                  CAGR EBITDA:
            ’15 – LTM SEP’18: 2%                   ’15 – LTM SEP’18: 9%           ’15 – LTM SEP’18: 10%

                            4,009      4,064                                                         73,293
               3,959                                              68,206          70,581
    3,831
                                                   58,279

                                                                                          11,344             11,822
                                                                         10,964
                                                          9,139

    2015       2016         2017     LTM SEP'18    2015           2016             2017            LTM SEP'18

                                          EBITDA
                                                   15.7           16.1             16.1               16.0
                                          Mg (%)

…WHICH HAS BEEN IN LINE WITH EBITDA EXPANSION
7
Investor Presentation - gruma
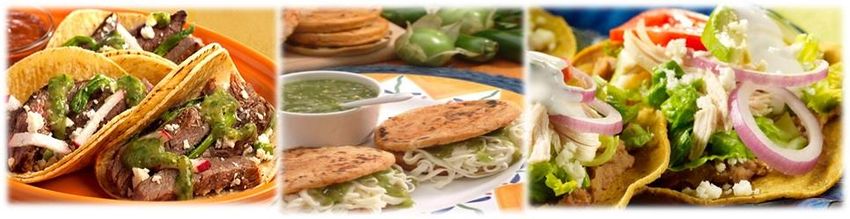
EBITDA GENERATION HAS CONTRIBUTED TO GRUMA’S SOLID FINANCIAL
POSITION…

                GRUMA                                    GRUMA
                 Debt                                Net Debt/EBITDA
             (millions of US$)                              (times)

                                   1,110
                           1,030

     769      775
                                                                      1.5
                                                                             1.4
                                             1.1
                                                      1.0

    DEC'15   DEC'16       DEC'17   SEP'18   DEC'15   DEC'16       DEC'17    SEP'18

8
Investor Presentation - gruma
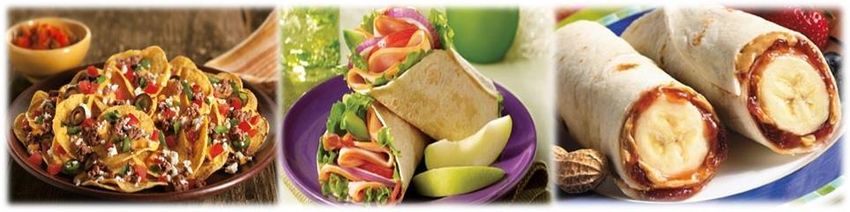
…WHILE THE COMPANY ENJOYS A HEALTHY DEBT MATURITY PROFILE,
WHERE 64% OF DEBT IS DOLLAR-DENOMINATED, BACKED BY OUR U.S.
OPERATIONS
                                                   GRUMA
                                             Debt Maturity Profile
                                           As of September 30, 2018
                                                    (millions of US$)

                                                          Rate          2018 2019 2020 2021 2022              2023 2024 TOTAL
Senior Notes 2024 (USD $400)                           Fixed 4.875%                                                   400.0   400.0
Rabobank Syndicated Term Loan (USD $150)               LIBOR + 1%               18.8   22.5   26.3    82.5                    150.0
Rabobank Syndicated Revolving Facility (USD $250)      LIBOR + 1%                                     160.0                   160.0
CEBURES 2023 (MSN $3,000)                              TIIE + 0.38%                                           159.5           159.5
Scotiabank Syndicated Term Loan (MXN $2,000)           TIIE + 0.55%                           106.3                           106.3
Other:
         MXN                                              8.27%         111.6                                                 111.6
         USD                                              3.24%          4.5                                                   4.5
         EUR                                              1.48%          1.2    5.0    3.8     2.4     2.1     2.0     2.0    18.4
TOTAL                                                    5.61% (avg.) 117.4 23.7       26.3 135.0 244.6 161.4 402.0 1,110.4

 9
Investor Presentation - gruma
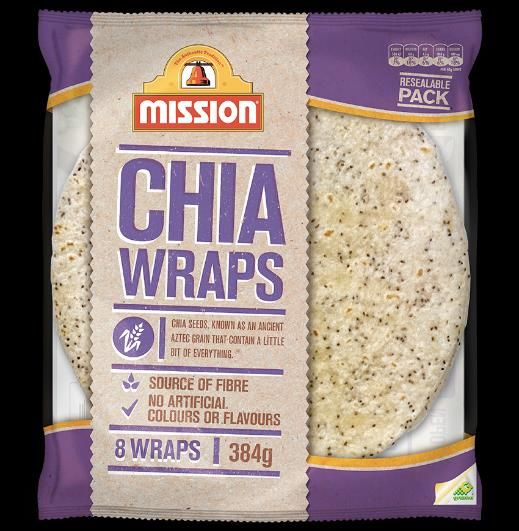
IMPROVEMENTS IN RESULTS IN ALL SUBSIDIARIES, HIGHER CASH
GENERATION AND HEALTHY FINANCIAL STRUCTURE HAS ENABLED
GRUMA TO INCREASE ITS DIVIDEND PAYMENT…
                                    GRUMA
                               Dividend Payments
                                 (millions of pesos)
                                                                        1.9 %
                                                       1.7 %

          1.0 %
                                        0.8 %          1,848            1,852
                         0.8 %

                                           865
           649           692

          2014          2015              2016         2017             2018
                  Total Dividend Payment ($)           Dividend Yield

10
…AND BUY BACK SHARES, TAKING ADVANTAGE OF THE CURRENT
VALUATION

                                      2017      NOVEMBER 20181

     REPURCHASE FUND                Ps.650 MM     Ps.2,500 MM
     SHARES REPURCHASED
                        - SHARES        -             4.5 MM
                        - DOLLARS       -          US$51 MM

     1   As of November 6, 2018
11
MAIN SUBSIDIARIES
GRUMA USA
GRUMA USA IS THE LARGEST SUBSIDIARY, AND THE LEADING CORN FLOUR
AND TORTILLA PRODUCER IN THE UNITED STATES

                                                                                    Net Sales LTM SEP’18: US$2.1 billion

                                                                                                    GRUMA USA
 Fife, WA

                              New Brighton, MN
McMinnville, OR
                                  *                         Mountain Top, PA
Hayward, CA                     Omaha, NE                                                                            Corn Flour
 Madera, CA                                    Evansville, IN                             Tortilla
  Fresno, CA           Pueblo, CO                                                        Operations                  Operations
   Panorama City, CA                                          Goldsboro, NC
   Olympic, CA                            Henderson, KY
    Rancho Cucamonga, CA                                                                      80%                         20%
              Albuquerque, NM Amarillo, TX Jefferson, GA
            Tempe, AZ                                                           • 20 Plants in the U.S.         • 6 Mills in the U.S.
                                        Dallas, TX          Lawrenceville, GA
                        Plainview, TX
                                          Houston, TX                           • Installed Capacity:           • Installed Capacity:
                     San Antonio, TX                    Lakeland, FL             1 million metric tons/year       850,000 metric tons/year
                           Edinburg, TX
                                                                                   •   Corn flour tortillas        • Tortilla corn flour
                                                                                   •   Wheat flour tortillas       • Chip corn flour
       Corn flour mills (6)                                                        •   Corn chips
                                                                                   •   Other related products
       Tortilla plants (20)
     * Temporarily closed

14
THERE IS GROWTH POTENTIAL FOR THE U.S. TORTILLA AND CORN FLOUR
  INDUSTRIES
  Growth Drivers                                                   Estimated U.S. Markets
• Hispanic Population1
  –18% of total U.S. population, out of which 63% are
   Mexican
  –Hispanic population increased 63% between 2000
   and 2016, accounting for half of total U.S.                     Tortillas/Tortilla chips
   population growth                                                    US$5 billion

• Popularity of Mexican Food
                                                                       Corn Flour2
  –Non-Hispanics account for the majority of Mexican                  US$1.3 billion
   food service purchases
  –The number of Mexican food restaurants continues
   to grow
  –More restaurants are featuring Mexican dishes in
   their menus
• Adoption of tortillas in non-Mexican dishes
  (wraps)
• Wraps, burritos, tacos, quesadillas, nachos, etc.
  becoming mainstream foods
        1   United States Census Bureau, updated as of July 2016
15      2   Includes traditional method
AS GRUMA USA CONTINUES TO SEE GROWTH POTENTIAL, ITS LARGEST
 PLANT BUILT IN DALLAS STARTED OPERATIONS IN AUGUST

      • 10% of additional tortilla capacity in the first stage, which could be doubled on
        a second stage when required

      • Closing of the former plant in Dallas in October

      • Production efficiencies through better technology

      • Transportation and logistic efficiencies

      • Opportunity to continue adding capacity at lower cost

      • Capabilities to produce preservative-free tortillas and healthier alternatives

      • Flexibility to develop new types of products (i.e. flatbreads)

16
OVER THE PAST FEW YEARS, SALES VOLUME GROWTH HAS BEEN LOWER
DUE TO SIGNIFICANT SKU RATIONALIZATION, WHICH HAS RESULTED IN
IMPROVED PROFITABILITY
                                                                             GRUMA USA
                GRUMA USA                                                Net Sales and EBITDA
                  Volume                                                   (millions of pesos)
             (thousand metric tons)
                     CAGR:                                  CAGR Net Sales:                 CAGR EBITDA:
             ’15 – LTM SEP’18: 1%                         ’15 – LTM SEP’18: 2%           ’15 – LTM SEP’18: 6%

               1,374         1,367       1,391                                                          2,096
     1,341
                                                                                         2,051
                                                                          2,024
                                                          1,989

                                                                                                                369
                                                                                  345            352
                                                                  311

 2015          2016         2017      LTM SEP'18                  2015            2016           2017    LTM SEP'18
                                                 EBITDA
                                                 Mg (%)
                                                                  15.6            17.1           17.2       17.6

17
GRUMA USA EXPECTS CONTINUED MARGIN IMPROVEMENT BASED
 PRINCIPALLY ON:

         • Change of sales mix toward higher margin SKUs
           – Healthier alternatives
           – More value-added products
           – Smaller counts

         • SKU rationalization, especially in the food service channel

         • Efficiencies arising from the new plant expected from 2019 and onwards

         • Important benefits resulting from tax reform

 ONCE SKU RATIONALIZATION IS COMPLETE, GRUMA USA SALES VOLUME
 IS EXPECTED TO GROW AT HIGHER THAN RECENT RATES

18
GIMSA
GIMSA IS GRUMA’S SECOND LARGEST SUBSIDIARY AND THE LEADER OF
 THE CORN FLOUR INDUSTRY IN MEXICO

 Mexicali

                                                                                                             GIMSA
                           Chihuahua
                                                                                   • Net Sales LTM SEP’18: US$1.1 billion1
                         Obregón
                                                                                   • 18 plants, with total annual capacity of 2.4
                                                       Río Bravo
                                                                                     million metric tons of corn flour
                            Culiacán    Nuevo León                                 • GIMSA’s market share within the corn flour
                La Paz                                                               industry is approximately 74%
                                                        Tampico
                                    Acaponeta
                                               Bajío
                                             *     México                Mérida
                                   Jalisco
                                           Celaya          Veracruz
                                                 Chalco
                                                           Chinameca

      Corn flour mills (18)                                            Chiapas

     * Temporarily closed

20          1   Convenience translation at an exchange rate of Ps.18.8120/dollar as of September 30, 2018.
CORN FLOUR IS ONLY USED TO PRODUCE 34% OF THE TORTILLAS IN
  MEXICO, THUS THERE IS A GREAT POTENTIAL FOR LONG-TERM GROWTH

       Potential Corn Flour Market in Mexico
           7.3 Million Metric Tons of Corn Flour1
                       US$4.2 billion2
                                                                                           Corn Flour Market in Mexico
                                                                                         2.5 Million Metric Tons of Corn Flour1
                                                                                                     US$1.4 billion2

                                                  GIMSA
                                                   25%
                                                                                                       MINSA
                                                                                      HARIMASA 3%       20%
                                                                                 OTHERS 2%
                                                         MINSA                                                  GIMSA
                                                          7%                      CARGILL 1%                     74%

                                                                    HARIMASA 1%
CORN 66%

                                                                     OTHERS 1%

       1   One corn flour metric ton = 1.8 tortilla metric tons.
21     2   Based on an exchange rate of Ps.18.8120/dollar as of September 30, 2018.
GIMSA’S SALES GROWTH MAINLY REFLECTS COMMERCIAL INITIATIVES
AIMED AT STRENGTHENING CUSTOMER SERVICE…
                   GIMSA                                                    GIMSA
                   Volume                                            Net Sales and EBITDA
             (thousand metric tons)                                     (millions of pesos)

                     CAGR:                                   CAGR Net Sales:                 CAGR EBITDA:
             ’15 – LTM SEP’18: 4%                          ’15 – LTM SEP’18: 9%          ’15 – LTM SEP’18: 3%
                                                                                         19,601         20,335
                           2,039       2,073
               1,965                                                    17,866
     1,847
                                                            15,871

                                                                2,942            2,964          3,084        3,173

     2015      2016        2017        LTM                  2015        2016             2017      LTM SEP'18
                                      SEP'18
                                               EBITDA Mg
                                                             18.5        16.6             15.7            15.6
                                                   (%)

…TAKING GIMSA TO MARGIN LEVELS WHERE IT CAN GROW AT 2-3% RATES
22
EXPECTATIONS FOR GIMSA’S RESULTS ARE BASED ON:

     • Stability of its operations arising from the defensive nature of its
       products, not impacted by economic or political matters

     • Sales volume growth coming mainly from the substitution of the
       traditional method

23
GRUMA EUROPE
GRUMA EUROPE IS THE COMPANY’S THIRD LARGEST SUBSIDIARY,
FOCUSED MAINLY ON THE TORTILLA BUSINESS
                                                                           Net Sales LTM SEP’18: US$281 million1
                                                                                          GRUMA Europe

                                                                            Tortilla                       Corn Milling
                                                                           Operations                      Operations
                                                                              70%                                  30%
                                                                      • 6 Plants in Europe              • 3 Mills in Europe
                                                                         • England (2)                     • Italy
                                                                         • The Netherlands                 • Ukraine
                                                                         • Russia                          • Turkey
                                                                         • Spain (2)
                                                                      • Installed Capacity:       • Installed Capacity:
                                                                        169,000 Metric tons/year    345,000 Metric tons/year
                                                                         • Wheat flour tortillas      • Tortilla corn flour
                                                                         • Corn chips                 • Chip corn flour
     Corn flour mills (3)                                                                             • Grits
     Tortilla plants (6)
                                                                         • Flatbreads
                                                                         • Other related products
25     1   Convenience translation at an exchange rate of Ps.18.8120/dollar as of September 30, 2018.
THERE IS GROWTH POTENTIAL FOR THE TORTILLA MARKET IN EUROPE

 Growth Drivers                                  Estimated European Markets

• Adoption of tortillas in non-Mexican dishes
  (wraps)

• Wraps, burritos, tacos, quesadillas, nachos,
  etc. becoming mainstream foods

• Popularity of Mexican food
     –The number of Mexican food restaurants
      continues to grow
     –More restaurants are including Mexican
      dishes in their menus                                   Tortillas/Tortilla chips
                                                                  US$1.2 billion
                                                                  Corn Milling
                                                                 US$400 million

26
GROWTH IN GRUMA EUROPE’S RETAIL TORTILLA BUSINESS HAS
IMPROVED ITS EBITDA MARGINS, A TREND THAT IS EXPECTED TO
CONTINUE
              GRUMA EUROPE                                                  GRUMA EUROPE
                 Volume                                                   Net Sales and EBITDA
             (thousand metric tons)                                         (millions of dollars)

                   CAGR:                                      CAGR Net Sales:              CAGR EBITDA:
           ’15 – LTM SEP’18: (6)%                           ’15 – LTM SEP’18: 0%        ’15 – LTM SEP’18: 5%

     404                                                    281                          272             281
                            374                                           265
               370
                                         344

                                                                   18.8          16.5          18.3            19.8

 2015         2016         2017       LTM SEP'18            2015          2016          2017          LTM SEP'18

                                                   EBITDA
                                                   Mg (%)
                                                              7.4           6.9           7.7             8.4

27
IMPROVED PROFITABILITY FOR GRUMA EUROPE WILL RESULT FROM:

     • A better sales mix favoring the retail tortilla business, particularly
       with branded products, supported by enhanced marketing and
       distribution efforts

     • Production efficiencies at tortilla plants, coupled with packaging
       automation

     • Potential M&A of tortilla companies to increase footprint, scale and
       better absorb marketing and logistic expenses

28
ADDITIONAL OPPORTUNITIES
       FOR GRUMA
ALONG WITH ITS THREE MAIN SUBSIDIARIES,                                         GRUMA      SEES
 OPPORTUNITIES IN OTHER GROWING MARKETS

     • Presence in Asia and Oceania with three tortilla production facilities and sales
       close to US$200 million, growing at a double digit rate

     • In Mexico, packaged tortilla business represents a huge potential market,
       where GRUMA has grown from US$30 million to US$70 million over the last
       three years
          −   Product portfolio has expanded to corn and wheat tortilla, tostada, snacks,
              corn chips, and related products
          −   Construction of a plant in central Mexico to expand capacity and coverage

30
GRUMA’S KEY CONSIDERATIONS TO CREATE VALUE

      • Worldwide leader in an attractive & non-cyclical industry with staple products

      • Growing markets for its products in all regions

      • Global footprint with approximately 60% USD EBITDA generation

      • No impact from NAFTA negotiation outcomes

      • Margin improvements expected at Gruma USA, Europe and Asia-Oceania

      • Important cash tax benefits arising from the U.S. tax reform

      • Solid financial position, supported by low debt leverage

31
Contact Information
  Rogelio Sánchez                                     Lilia Gómez
   +52 (81) 8399 3312                              +52 (81) 8399 3324
rsanchezm@gruma.com                               lgomez@gruma.com
                            Investor Relations
                             +52 (81) 8399 3349
                               ir@gruma.com
                              www.gruma.com
You can also read