INVESTOR PRESENTATION - Including FY 17 Results - AA plc

Page created by Mathew Williams
 
CONTINUE READING
INVESTOR PRESENTATION - Including FY 17 Results - AA plc
INVESTOR
PRESENTATION
Including FY 17 Results
INVESTOR PRESENTATION - Including FY 17 Results - AA plc
FUNDAMENTALS
INVESTOR PRESENTATION - Including FY 17 Results - AA plc
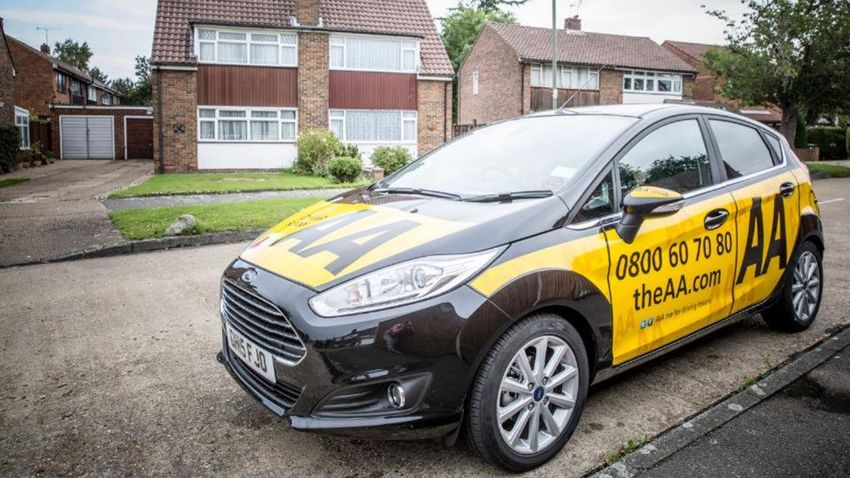
PROVIDING SERVICES TO AA MEMBERS SINCE 1905

                                                                                                                Brought under
                                                                                                                common
Founded by           Patrols on            35% share               Launched              Patrols issued         ownership with      DriveTech and
motoring             bicycles and          of 2m cars on the       Roadwatch and         with diagnostics       Saga in the         Auto Windshields       IPO
enthusiasts          uniforms              road                    Relay                 equipment              Acromas Group       acquired               26 June

  1905        1907    1909          1912      1939        1949           1973      1992           1999       2003      2004       2007    2009          2010     2014

1st AA insurance        Launched                  New fleet                 Launched                     AA members           Acquired by              BSM acquired,
policy                  AA Routes and             to enable four            AA Driving                   voted to             private equity           launch Home
                        AA Stars                  wheel patrols             School                       demutualize the      groups CVC and           Services
                                                                                                         AA and join          Permira Fund
                                                                                                         Centrica Group

                                                                                                                                                                        2
INVESTOR PRESENTATION - Including FY 17 Results - AA plc
THE LEADERSHIP TEAM

         Bob Mackenzie                                               Martin Clarke
         Executive Chairman                                          Chief Financial Officer
         Previously Chairman and CEO of National Car Parks           Previously Partner and Global Head of Consumer for
         and its subsidiary Green Flag                               Permira
         Prior to that CEO of Sea Containers                         Prior roles at Cinven, Silverfleet and
         and Chairman of PHS Group                                   board member of New Look and Gala Coral

         Mike Lloyd                                                  Janet Connor
         Commercial Director                                         Restructuring and Insurance Director
         Previously Partner at Oliver Wyman focused on               Previously Managing Director at More Than; MD at
         Consumer Service businesses in FS, Energy, Home,            Ageas-owned over-50s broker RIAS from 2006 to 2011
         TV and Telecoms                                             Accountable for Insurance Underwriter and Membership
         Responsible for Roadside Assistance and Insurance           policies and governance
         Services, marketing and digital functions

         Oliver Kunc                                                 Kirsty Ross
         Operations Director                                         Membership Services Director
         Previously Managing Director of Central Heating             Previously Strategy and Innovations Director;
         Installations at British Gas; prior roles at Barclays, BA   Principal at Oliver Wyman
         and LEK consulting                                          Responsible for Motoring Services, Media and Driving
         Responsible for operations including patrols,               School businesses, connected car strategy and
         deployment, call centres and technical development          Group strategy

                                                                                                                            3
INVESTOR PRESENTATION - Including FY 17 Results - AA plc
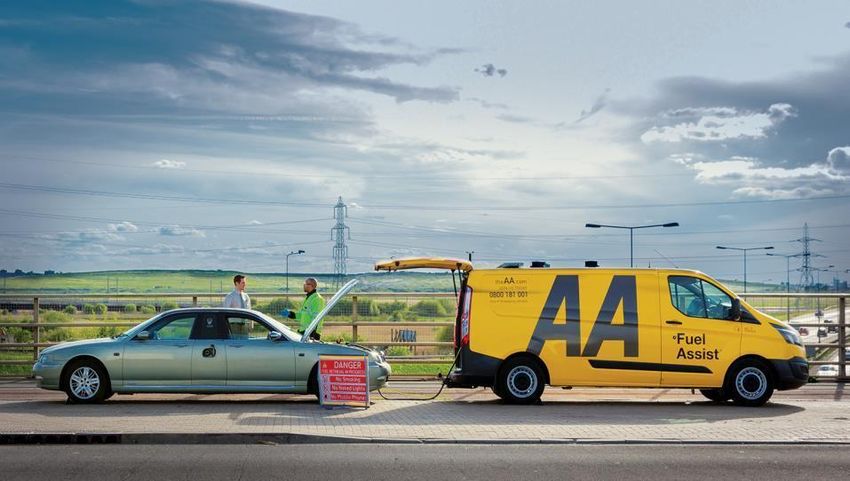
ROADSIDE ASSISTANCE AT THE CORE

 Roadside Assistance             Insurance Services                   Driving Services             Trading Revenue
                                                                                                         4%
Consumer                      Broking                             Driving Schools
                                                                                                   14%
 3.3m paid personal Members    Leading insurance broker            Largest driving school in the
                                                                   UK (by pupils)
 Average income per Members    Predominantly motor and
 £158                          home                                AA and BSM brands                             79%

 82% retention                 1.9m policies                       10% of pupils in highly
                                                                                                   Roadside Assistance
                                                                   fragmented market
                               Average income per policy                                           Insurance Services
B2B                            £70                                 2,607 instructors franchised    Driving Services
 10.0m business customers
                              Home Services                       DriveTech                        Trading EBITDA
 Largely pay-for-use
                               Developing home emergency           Provides driver awareness
 Average income per B2B                                                                                  4%
                               position                            training, fleet management
 customer £20                                                                                      17%
                                                                   and driver training
                              Financial Services
                               AA-branded partnership with
                               Bank of Ireland
                                                                                                                 79%
                               100k products in first full year

                                                                                                                         4
INVESTOR PRESENTATION - Including FY 17 Results - AA plc
RESILIENT AND CASH GENERATIVE BUSINESS MODEL

£m                                                               Trading EBITDA              Revenue

                                                                931           943           979            971          974         984          973         940
                                                  893
        755             794         808

                                                         369           371           366           395           423          430         415          403
               273            292          334
 219

  Year to  Year to 13 months                  FY09          FY10          FY11           FY12            FY13     FY14         FY15        FY16         FY17
 Dec 2005 Dec 2006 to Jan 2008

£m                                                          Operating cash flow               Cash Conversion

                                                 102%                            100%                            101%
                 94%                                                                                                                            92%

                                                  433                              431                            420
                  371                                                                                                                           371

                 FY13                            FY14                             FY15                           FY16                           FY17

Note: 2005, 2006, 2008 and 2009 unaudited; FY 17 excludes Ireland business disposed of in August 2016.
                                                                                                                                                               5
INVESTOR PRESENTATION - Including FY 17 Results - AA plc
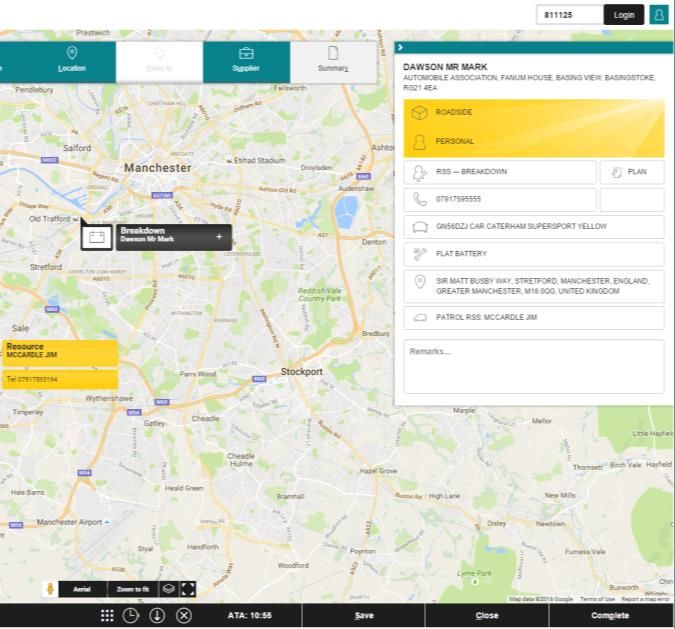
MARKET LEADERSHIP AND HIGH BARRIERS TO ENTRY

   Widely recognised and trusted brand                                         Consumer market share
                                                                                Others
   50% of households hold an AA product                                          19%

   Unique deployment IP                                                                                    40%
                                                                                GF
                                                                               14%
   3,000 patrols; average tenure 12 years
   attending 10,000 breakdowns per day                                               RAC
                                                                                     27%
   82% of breakdowns repaired at roadside
          3.6m                                                                       B2B market share

          B2B                2.4m

                                                  0.7m                   67%                63%
       Consumer                                                                                                  50%

                                                                        Motor         Fleets and Leasing         AVA
                                                                     manufacturers
Source: Industry sources;
Note: The number of breakdowns for GreenFlag is last year’s number
                                                                                                                       6
INVESTOR PRESENTATION - Including FY 17 Results - AA plc
A TRUSTED BRAND BASED ON EXCELLENT SERVICE LEVELS

       Which? total test score                            Call handling                80% in 20 seconds
          Major providers
                                                          Repair rate                                 82%
     74%
                                                          App usage                                  >22%
                                                          Average call time
INVESTOR PRESENTATION - Including FY 17 Results - AA plc
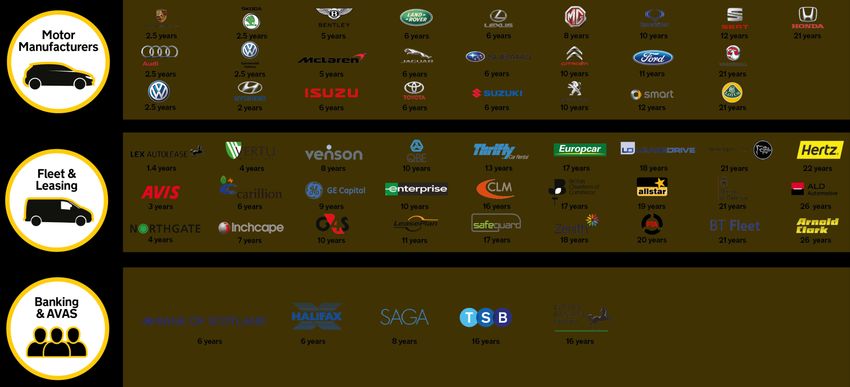
LONG TERM STRATEGIC PARTNERS
 Contract wins in the last two years: Lex Autolease, Porsche, Volkswagen Group
 Recent renewals or extended contracts: Alphabet, Barclaycard Buying Group, BT,G4S,Hertz, Isuzu, Lexus,
 Lotus, MG, Northgate, Subaru, South West Ambulance Trust, Toyota, Venson, Vauxhall
INVESTOR PRESENTATION - Including FY 17 Results - AA plc
STRONG BRAND IN INSURANCE

Insurance Services

            Core insurance revenue breakdown                                  Brand consideration for switching Motor Insurance
                    Other
                     9%                                                       40%
                                                                                                                               Direct Line

                                                                              35%

                                                   Unprompted awareness (%)
                                                                                                                                             Aviva
                                       Motor                                  30%
              Home                                                                                                                                    Admiral
              39%                      52%
                                                                              25%
                                                                                                                           Churchill
                                                                              20%
                                                                                                         Tesco   LV=                             AA
                                                                              15%
                                                                                                                 Axa
   No 1 motor insurance broker in the UK private                              10%              Swinton
                                                                                                             Hastings Direct

   car insurance market                                                                 Saga
                                                                                               Esure
                                                                              5%                             MoreTh>n
   No 2 private home insurance broker in the UK
                                                                              0%
                                                                                    0% 2% 4% 6% 8% 10% 12% 14% 16% 18% 20% 22%
                                                                                                Consideration (%)
Source: GfK FRS Study September 2016
                                                                                                                                                           9
RELATIVE RESILIENCE OF MEMBERSHIP BUT CHALLENGES IN RECENT YEARS

 Under-investment in
                              AA Members (m)                  AA Membership vs GDP Growth                        UK GDP growth (%)
 systems, brand and
 capabilities                5.0                                                                                              20%

 Legacy of short-term
 decision making             4.0                                                                                              15%
                                                                                  Membership run-up and
                                                                                  reduction following
 Premium position not                                                             demutalisation
                             3.0                                                                                              10%
 underpinned by marketing,
                                                                 US savings and
 advertising, proposition                                          loan crisis                            Financial
                                   Oil Crisis
                             2.0                                                                            crisis            5%
 IT platform dated and
 constraining growth
                             1.0                                                                                              0%
 (except Deployment
 system)
                             0.0                                                                                              -5%
                                   1975         1980   1985    1990      1995         2000        2005    2010         2015

                                                                                                                               10
STRATEGY TO TRANSFORM THE AA

                                       Grow our core Roadside Assistance business
                                         Reverse long standing decline
Strengthen the AA to become the pre-
eminent membership services              Refresh advertising and marketing
organisation in the UK                   Evolve new channels for Membership growth
                                         Strengthen our B2B positioning
Revolutionise the customer             Expand our technology capability
experience through investing in the      Strengthen IT systems and processes
brand and embracing new
technologies                             Realise the potential of digitalisation
                                         Develop our connected car positing

Reduce Group borrowings and the        Build on our brand
associated interest costs                Widen reach of AA Insurance through Underwriter
                                         Grow AA financial services position

                                                                                           11
THE UK’S PRE-EMINENT MEMBERSHIP SERVICES ORGANISATION

              Market leader              Resilient,
                  with a                high return
               trust brand            business model

             Clear strategy to      Platform for revenue
          transform the AA for a   growth and accelerated
                digital age           cash generation

                                                            12
FY 17 RESULTS
28 March 2017
DEFINITIONS

The following definitions apply throughout
•   Trading Revenue: Revenue excluding discontinued operations, business disposed of and exceptional revenue items
•   Trading EBITDA (earnings before interest, tax, depreciation and amortisation): excludes exceptional items, items not
    allocated to a segment and the Ireland discontinued business
•   Cash conversion: net cash flow from continuing operating activities before tax and exceptional items divided by Trading
    EBITDA
•   Continuing adjusted basic EPS: Earnings per share excluding discontinued operations adjusts for a number of one-offs of
    which the largest are exceptional items, items not allocated to a segment, and exceptional finance costs
•   Personal Members and Business Customers: measured as the number at the period end
•   IPT: Insurance Premium Tax

                                                                                                                              14
Headlines    Bob Mackenzie
AGENDA   Financials   Martin Clarke
         Strategy     Bob Mackenzie

                                      15
HEADLINES
GOOD PROGRESS TO DATE IN YEAR 2 OF THE TRANSFORMATION

                                             Transformation gaining momentum
   Results in           Strong            Growth in paid personal Members
    line with            cash
  expectations        generation          App used in 22% of personal breakdowns
                                          Call outs up 5% but costs partially offset
                                          Productivity improved
    Cost of         Total dividends       First motor insurance policy growth since 2008
  borrowings            of 9.3p
   reduced          recommended           Cost savings on target
                                          Normalised capex levels in sight

                        A platform for sustainable growth
             The UK’s pre-eminent Membership services organisation

                                                                                       17
FINANCIALS
FINANCIAL HEADLINES

 Trading Revenue up 1.6% at £940m despite IPT increase
 • Roadside up 2.5% to £742m

 Trading EBITDA up 0.2% at £403m
 • Roadside up 1.1% to £365m

 Trading EBITDA margin 42.9% (FY 16: 43.5%)

 Adjusted EPS 21.3p (FY 16: 21.8p)

 Cash conversion 92% (FY 16: 101%)

 Net debt of £2,704m (6.7x Trading EBITDA) post refinancing in December

 Total dividends of 9.3p per share recommended

                               In line with market expectations

                                                                          19
P&L

£m                                                 FY17    FY16      YoY   Items not allocated to segment reflect
                                                                           pension and share based payments
Trading Revenue                                     940     925     +2%
                                                                           Exceptional items mainly restructuring
                                                                           activities and provision for potential refund
Trading EBITDA                                      403     402        -   of customers with duplicate breakdown
Items not allocated to a segment                    (20)    (18)   +11%    cover
Depreciation & amortisation                         (67)    (51)   +31%    Increase in depreciation and amortisation
                                                                           due to elevated capex and roll out of first
Exceptional operating items including impairment    (32)    (36)    -11%
                                                                           phase of IT transformation spend
Operating profit                                    284     297      -4%
                                                                           Increase in PBT primarily reflects the
Net finance cost                                   (184)   (288)    -36%   decline in net finance cost due to the
Profit before tax                                   100       9      +91   absence of one-off costs from the prior
                                                                           year refinancing
Tax expense                                         (26)    (10)   +160%
                                                                           Tax expense reflects current tax charge of
Profit/(loss) for the period from continuing         74      (1)     +75
operations
                                                                           £20m; effective tax rate of 22%
Basic EPS – continuing operations                  12.2    (0.2)   +12.4   Adjusted basic EPS of 21.3p, marginally
                                                                           down on prior year due to increased
Adj Basic EPS –continuing operations               21.3    21.8      -2%
                                                                           share capital

                                                                                                                    20
ROADSIDE ASSISTANCE

 Trading Revenue +2.5% to £742m                                                       FY17    FY16    YoY   H117 FY on
                                                                                                                   H1
 Personal paid Members + 0.1%              Personal Members (‘000s)                   3,540   3,673   -4%   3,599   -2%
 • Retention 82% (FY 16: 81%)
                                           Average income per Member (£)               148     141    +5%    145    +2%
 • Average income +1.3% to £158 (net of
   3.5% uplift in IPT)                     Personal paid¹ Members (‘000s)             3,335   3,331     -   3,321     -
 • Ancillary revenue +17%                  Average income per paid¹ Member (£)         158     156    +1%    157    +1%

 B2B customers down 2% due to              Business customers (‘000s)                 9,976 10,216    -2% 10,179    -2%
 decline in bank holdings                  Average income per business customer (£)     20      18 +11%       19    +5%
 • Average income +11%
                                           Breakdowns attended (‘000s)²               3,635   3,459   +5%   1,759   n/a
 Trading EBITDA +1.1% to £365m
 • Revenue growth partially offset by 5%
   increase in number of breakdowns
   attended

                                                                                                                    21
INSURANCE SERVICES

Insurance Broking                                            Insurance                                         FY on
                                                             Broking            FY17    FY16     YoY   H117      H1
  Trading Revenue flat at £131m - lower core insurance and
                                                             Total insurance    1,879   2,074    -9%   1,962    -4%
  Home Services offset by increased Financial Services       policies (‘000s)
  Trading EBITDA down £2m to £76m
                                                             Motor policies      594     592       -    572     +4%
  • Increased aggregator spend
                                                             (‘000s)
  • Managed decline in Home Services policies
                                                             Home insurance      857     899     -5%    891     -4%
  Growth in motor policies – first since 2008
                                                             policies (‘000s)
  • Successful retention and direct sales initiatives
  • Incremental policies through in-house underwriter        Average income       70      63    +11%     67     +4%
                                                             per policy (£)
Financial Services
                                                             Financial
  Credit cards, loans, savings and mortgages                 Services
  Performance to plan: 100k products sold                    Products (‘000s)    100      33 +203%       82    +22%

In-house Underwriter                                         Underwriter

  Motor launched January 2016 – progressing well             Motor policies      115      na      na     25    +360%
                                                             (‘000s)
  Home launched August 2016 – on track

                                                                                                                22
DRIVING SERVICES

                                                                                                    FY on
 Trading Revenue down 2% to £67m                                      FY17    FY16    YoY   H117      H1
 Stabilisation of driving school franchisees reflects   Driving       2,607   2,574   +1%   2,516   +4%
 improvements to product portfolio                      Instructors

 DriveTech police speed awareness courses down
 Trading EBITDA up £1m to £20m
 Cost savings support EBITDA

                                                                                                     23
STRONG OPERATIONAL CASHFLOW

£m                                                                                  FY17    FY16
Net cash flows before tax and exceptional items¹                                     371     406
Tax, exceptional items and discontinued operations                                   (26)    (25)
Net operating cash flows                                                             345     381
Transformation capex                                                                 (41)    (54)
Underlying IT capex                                                                  (17)    (18)
Non-IT capex                                                                         (13)    (13)
Capex accruals                                                                          -     10
Capital repayment of finance lease net of disposal proceeds                          (25)    (23)
Proceeds from the sale of Ireland (net of cash disposed of)                           99        -
Other                                                                                 (6)    (15)
Net cash flows before refinancing, purchase of own shares, interest and dividends    342     268
Refinancing transactions                                                            (102)   (183)
Purchase of own shares                                                                 0     (22)
Interest paid                                                                       (143)   (178)
Dividend paid                                                                        (55)    (21)
Net increase/(decrease) in cash and cash equivalents                                  42    (136)

¹Continuing Operations                                                                              24
DEBT STRUCTURE

                                     Gross debt: £2,848m
                                                                                                Leverage net debt/EBITDA 6.7x
                                                           £700m
                                                                                                Blended cost of debt 4.63%
                                                                                £570m
                                                £500m                   £500m                   following pay down of £106m of
                                                                                                STF in August and refinance in
              £348m
                                                                                                December
                                                                                        £211m
                         £175m
                                                                                                Weighted average maturity just
                                      £55m
                                                                                                under 5 years
              Senior     Class A1 Class A4 Class A3 Class A5 Class A2 Class B2          Cash
               Term       notes    notes    notes    notes    notes    notes
                                                                                                Run rate cash interest cover*
              Facility                                                                          above 3x
Interest     5.00% 4.72% 3.78% 4.25% 2.88% 6.27% 5.50%                                          Class A FCF to DSCR** 3.3x
rate                                                                                            (covenant > 1.35x)
Effective     2019       2018        2019       2020        2022        2025    2022
maturity                                                                                        Class B FCF to DSCR** 2.3X
Note: Fixed interest rates with LIBOR hedged for Senior Term Facility
                                                                                                (covenant > 1.0x)
                                                                                                Senior debt all investment grade

 *Run rate cash interest: Trading EBITDA
 **Free cash flow: debt service cover ratio                                                                                     25
PENSIONS

 IAS 19 Group pension deficit of £395m (31 Jan 16: £296m)
 • Driven by decline in corporate bond yields

 Anticipate significant increase in triennial review valuation of UK scheme deficit from £202m
 (31 March 2013) due to reduction in long term gilt yields
 Proposed move from final salary to modified career average (CARE) defined benefit
 •   Mitigate the high cost to the business
 •   Reduce our exposure to pension risks
 •   Remain competitive within our industry
 •   Create a more consistent pension offering across our employees

 Commenced 60 day consultation on 20 March and engaged with the IDU (the AA’s recognised
 union)
 If implemented, these changes would be taken into account in agreeing the deficit cash
 funding plan with the pension trustees
 Deficit reduction plan expected to be finalised by end of June 2017

                                                                                                 26
FINANCIAL IMPLICATIONS OF THE TRANSFORMATION

 Investment in marketing and brand - £10m plus additional spend on the product proposition

 Post-transformation capex run rate £45m - IT c.£10m; property and equipment c.£10m; net vehicle
 costs c.£25m

 Restructuring costs - £45m over three years

 Cost savings - at least £40m in respect of the FY15 cost base from FY19

 Progressive dividend

 A platform for growth

                Driving growth in revenue, earnings and free cash flow

                                                                                              27
STRATEGY
BUILDING MOMENTUM IN YEAR 2 OF TRANSFORMATION

         The Strategic Priorities                       The Time Line

 Strengthen the AA’s foundations         Year 1 FY16 Stronger foundations delivered

 Revolutionise customer experience       Year 2 FY17 Momentum for change created

 Reduce Group borrowings and the         Year 3 FY18 Realise the transformation
 associated interest costs
                                         Year 4 FY19 Delivering growth

    Transforming the AA into the UK’s pre-eminent Membership organisation

                                                                                  29
IT SYSTEMS TRANSFORMATION (1)                        AA Help

               Support systems

 Installed new IT infrastructure and applications       AA Help2

 Throughout back office functions and call centres

      Service delivery and AA Help 2

 New version of AA Help rolled out
 All patrols have new communications devices

            Insurer hosted pricing

 Implementation in next few months
 Will transform our pricing agility

                                                                   30
IT SYSTEMS TRANSFORMATION (2)

                      CRM                                                            Digital

 Integrating system specifications for duplicate cover            New commercial website launched in May
 Roadside rollout under way but marketing element                 My AA launched in January
 brought forward                                                  Roadside app continuing to grow
 Receptiveness to tailored rewards communication
 Pulling forward main insurance system

Mitchells & Butlers membership benefit redemptions                       Breakdowns using the app (%)
                                                          25.0%

                                                          20.0%

                                         Christmas peak   15.0%

                                                          10.0%

                                                          5.0%

                                                          0.0%

                                                                                                           31
ROADSIDE - GROWTH IN PERSONAL MEMBERSHIP VOLUMES

 Growth in paid personal membership                           Monthly paid new business volumes
 numbers since April with acceleration in H2

 Retention improved to 82% (81%)                                                               YoY growth (%)

 • Number of calls to Stay AA continued to drop

 14% growth in new business volumes - 19%
 in second half
 •   Reinvigorated marketing approach
 •   Improved digital capabilities                                     Average revenue per member
 •   Smaller price increases (net of IPT)
 •   Advertising gaining traction                               Average revenue per Member (£)
                                                                IPT (%)*                                        158
 •   Membership benefits clearer                                                           156
                                                                              150                                       10%
 Average revenue per member up 1.3% to                            138
                                                                                                                        5%
 £158 driven by ancillary revenue increase
 • Price rises held back by significant IPT increase                                                                    0%
                                                                FY 14                    FY 15          FY 16   FY 17
                                                       * Standard rate of IPT at calendar year end

                                                                                                                        32
ROADSIDE – ANCILLARY SALES INCREASE

 Ancillary revenue up 17%                       Battery sales rolling trend
 • Battery sales up
 • Fuel Assist and Key Assist sales up
 • Tyre replacements and parts a future focus

 Battery sales volumes up 27%, driven by
 • Improved product range
 • Investment in battery testing equipment
 • Price guarantee for customers
                                                Battery sales conversion

                                                                              33
ROADSIDE - PRODUCTIVITY IMPROVEMENTS

 Which? Recommended                                      Rolling 12 month variable cost per case*
 provider for 11th
 successive year

 Auto Express best breakdown cover winner
 2016
    1st                 4th               5th

 Improved productivity from investment
                                                                        Fix time per job (minutes)
 • Roadside technology
 • Communications
 • Deployment system

 5% increase in breakdowns attended
 • £11m increase in total roadside operations costs
 • Partially offset by £5m of cost savings

                                                      *Inflation adjusted
                                                                                                     34
MOTOR INSURANCE – REVERSING THE DECLINE

 First growth in motor insurance policies           Motor insurance policies in force
 since 2008
 • Stabilised retention
 • Growth in new business volumes

 In-house underwriter is a key driver of new
 business
 • 115k policies written by end of January 17
 • Vast majority of policies for non-existing AA
   insurance customers                              AA underwritten policies by origin
 Home insurance launched in August; 25k
 policies underwritten by end of January 2017                      Has never been an AA insurance
                                                   28%             customer

 Early signs are promising but too early for                55%
                                                                   Was once previously an AA
                                                                   insurance customer
 material financial contribution
                                                   17%             An existing AA insurance customer
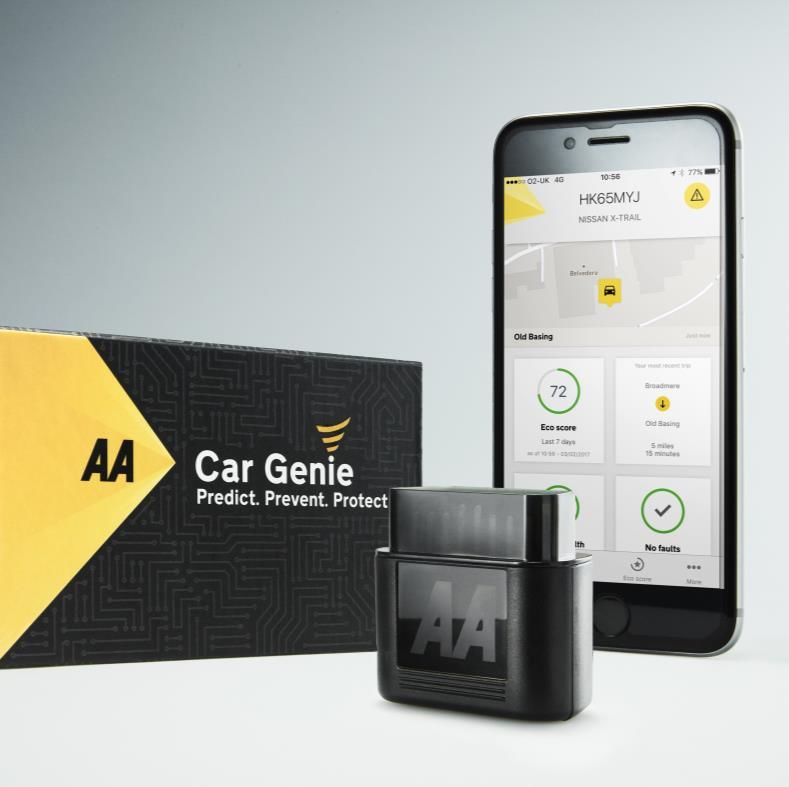
                                                                                                 35
CONNECTED CAR - TRIAL LEADS TO LAUNCH OF CAR GENIE

 AA Connect 10k car trial: 1/3 of problems could
 be identified before a breakdown

 Pre-registration for next generation device ‘Car
 Genie’ is now open

 Proven capability to improve service and reduce
 costs
 • Better prognostics and diagnostics
 • More accurate deployment and faster repair

 Also using data for targeted motor insurance
 sales

 Benefits for Members such as accident assist,
 vehicle location, driving monitoring

                                                     36
IN SUMMARY – OUR ACHIEVEMENTS
                                                      Strengthened and modernised
                                             Reversing long standing decline in Membership
 Results in line with expectations despite   Improving Roadside service levels and efficiency
 increased IPT and callouts                  Modernising back office and customer interface

 Transformation entering its final phase     Re-engaging with customers through marketing
                                             Enriching the Membership proposition
 Upside from full benefits still to come
                                             Retaining B2B contracts
 Free cash flow generation to accelerate     Developing our connected car positioning
                                                  Built on our Brand beyond Roadside
 Platform to realise the potential of our
 brand, technologies and market              Reversing long standing decline in motor insurance
 leadership                                  Growing Underwriter and FS business
                                             Refreshing Driving Services and Home Services
                                             First step in international markets in India
                                                     Reduced the cost of borrowing
                                             Cost of debt reduced to 4.6% from 6.1% at IPO
                                             Maturities extended

                                                                                                  37
The UK’s pre-eminent Membership services organisation
APPENDIX
REVENUE

                                               % of
£m                     FY17   FY16   Change   Group
Roadside Assistance     742    724    +2.5%    79%    Increase in average revenue per customer and
                                                      B2B revenue

Insurance Services      131    131        -    14%    Lower policy numbers offset by higher income
                                                      per policy
Driving Services         67     68    -1.5%     7%    Lower speed awareness courses

Insurance                 0      2        -       -   Launch of in-house Underwriter offset by
Underwriting                                          impact of deferred broker commission

Trading revenue         940    925    +1.6%
Revenue from              -     10
business disposed of
Exceptional revenue     (7)      -
provision
Total revenue           933    935    -0.2%

                                                                                                 40
TRADING EBITDA

                                                                  % of
£m                                     FY17    FY16    Change   Group¹
Roadside Assistance                     365     361     +1.1%     79%    EBITDA up 1.1%
                                                                         Revenue growth partly offset by increased
                                                                         breakdown incidents
Insurance Services                       76      78     -2.6%     17%    Increased aggregator spend
                                                                         Lower contributions from Home Services

Driving Services                         20      19     +5.3%      4%    Increase driven by efficiency savings

Insurance                                (1)       -        -
Underwriting
Head office costs                       (57)    (56)    -1.8%            Incremental IT licensing costs partially offset
                                                                         by cost savings
Total Trading                           403     402     +1.6%
EBITDA

1   % of Group pre head office costs
                                                                                                                       41
SEGMENTAL ANALYSIS

                                              YoY                                               YoY
Roadside Assistance                FY17    Change   Insurance Services              FY17     Change
Trading Revenue (£m)                742     +2.5%   Trading Revenue (£m)             131          -
Trading EBITDA (£m)                 365     +1.1%   Trading EBITDA (£m)               76      -2.6%
Paid personal Members (‘000s)      3,335    +0.1%   Policy numbers (‘000s)          1,879     -9.4%
Business customers (‘000s)         9,976    -2.3%   Average income per policy (£)     70     +11.1%
Average income per paid personal    158     +1.3%
Member (£)
Breakdowns attended (‘000s)        3,635    +5.1%                                               YoY
                                                    Driving Services                 FY17    Change
                                                    Trading Revenue (£m)               67     -1.5%
                                                    Trading EBITDA (£m)                20     +5.3%
                                                    Driving school instructors       2,607    +1.3%

                                                                                                42
PROFIT AND LOSS¹

                          £m                                                 FY17    FY16
                          Revenue                                             933     935
                          Cost of sales                                      (341)   (337)
                          Gross profit                                        592     598
                          Admin and marketing including JVs and associates   (308)   (301)
                          Operating profit                                    284     297
                          Trading EBITDA                                      403     402
                          Items not allocated to a segment                    (20)    (18)
                          Depreciation & amortisation                         (67)    (51)
                          Impairment of investment in joint venture            (1)       -
                          Exceptional operating items                         (31)    (36)
                          Operating profit                                    284     297
                          Net finance costs                                  (184)   (288)
                          Profit before tax                                   100       9
                          Tax expense                                         (26)    (10)
                          Profit/(loss) for the period from continuing         74      (1)
                          operations
                          Basic EPS – continuing operations (p/share)        12.2    (0.2)
                          Adj Basic EPS –continuing operations (p/share)     21.3    21.8

¹ Continuing operations
                                                                                             43
BALANCE SHEET
           £m                                               FY17       FY16
           Goodwill and other intangible assets             1,283      1,298
           Property, plant and equipment                      131        122
           Investments in joint ventures and associates         10         10
           Deferred tax assets                                  62         52
           Non-current assets                               1,486      1,482
           Inventories                                           6          5
           Trade and other receivables                        195        172
           Cash and cash equivalents                          211        166
           Current assets                                     412        343
           Total assets                                     1,898      1,825
           Trade and other payables                         (520)      (518)
           Current tax payable                                (11)        (7)
           Provisions                                         (19)        (8)
           Current liabilities                              (550)      (533)
           Borrowings and loans                           (2,819)    (2,920)
           Finance lease obligations                          (20)       (21)
           Defined benefit pension scheme liabilities       (395)      (296)
           Provisions                                         (11)        (7)
           Insurance technical provisions                     (16)        (4)
           Non-current liabilities                        (3,261)    (3,248)
           Total liabilities                              (3,811)    (3,781)
           Net liabilities                                (1,913)    (1,956)

                                                                                44
CASH FLOW
            £m                                                     FY17    FY16
            Operating profit including discontinued operations      368     305
            Depreciation and amortisation                             68      54
            Profit on sale of Ireland                               (77)       -
            Other items                                               15      12
            Cash exceptional items                                    15      37
            Change in working capital                                (8)      12
            Operating cash flow before tax and exceptional items    381     420
            Cash exceptional items                                  (15)    (37)
            Tax paid                                                (21)     (2)
            Net cash flows from operating activities                345     381
            Investing activities
            Capital expenditure                                     (71)    (75)
            Proceeds from the sale of Ireland                         99       -
            Other investing activities                                19       4
            Net cash flows use in investing activities                47    (71)
            Financing activities
            Refinancing transactions                               (102)   (183)
            Purchase of own shares                                     -    (22)
            Interest paid on borrowings                            (143)   (178)
            Payment of finance lease capital                        (43)    (34)
            Payment of finance lease interest                        (7)     (8)
            Dividends paid                                          (55)    (21)
            Net cash flows from financing activities               (350)   (446)
            Net increase/(decrease) in cash and cash equivalents      42   (136)
                                                                                   45
DEBT PACKAGE

                                                                                              Run rate cash
                                                                      Expected     Interest         interest Principal at 31 Principal at 31
                                                                  maturity date        rate             (£m)    Jan 17 (£m)     Jan 16 (£m)
Senior Term Facility                                            31 January 2019      5.00%              17.4            348             454
Class A1 notes                                                      31 July 2018     4.72%                8.3           175             475
Class A2 notes                                                      31 July 2025     6.27%              31.4            500             500
Class A3 notes                                                      31 July 2020     4.25%              21.3            500             500
Class A4 notes                                                      31 July 2019     3.78%                2.1             55            250
Class A5 notes                                                  31 January 2022      2.88%              20.1            700                -
Class B2 notes                                                      31 July 2022     5.50%              31.4            570             735
                                                                                     4.63%             131.8          2,848           2,914

Ring fenced cash and cash equivalents                                                                                   136              94
Non ring fenced cash and cash equivalents                                                                                75              72
Total cash and cash equivalents¹                                                                                        211             166

Class A Net Debt: Trading EBITDA2                                                                                       5.2x            5.0x
(STF & Class A notes less ring fenced cash)
Class B2 Net Debt: Trading EBITDA2                                                                                      6.7x            6.9x
(WBS debt less ring fenced cash)
Total Net Debt : Trading EBITDA3 (total debt less total cash)                                                           6.7x            7.0x

Class A FCF DSCR                                                                                                        3.3x            3.6x

Class B FCF DSCR                                                                                                        2.3x            2.4x

                                                                                                                                       46
You can also read