Investor Presentation January 2020 - Tricon Capital

Page created by Karl Norton
 
CONTINUE READING
Investor Presentation January 2020 - Tricon Capital
Investor Presentation
January 2020
Investor Presentation January 2020 - Tricon Capital
Disclaimer
General
You are advised to read this disclaimer carefully before reading, accessing or making any           IFRS financial measures do not have standardized definitions prescribed by IFRS, they
other use of the information included herewith. These materials are not an offer or the             are less likely to be comparable with other issuers or peer companies. A description of the
solicitation of an offer to purchase any securities or make any investment. This                    non-IFRS measures used by the Company in measuring its performance is included in its
presentation includes information about Tricon Capital Group Inc. and its subsidiaries and          Management Discussion and Analysis available on the Company’s website at
investees (together, the “Company”) as of September 30, 2019, unless otherwise stated.              www.triconcapital.com and on SEDAR at www.sedar.com.
These materials should be reviewed in conjunction with the Company’s Financial
Statements and Management Discussion and Analysis for the periods ending September                  This presentation may contain information and statistics regarding the markets in which
30, 2019 and are subject to the detailed information and disclaimers contained therein. All         the Company and its investees operate. Some of this information has been obtained from
dollar amounts are expressed in U.S. Dollars unless otherwise stated.                               market research, publicly available information and industry publications. This information
                                                                                                    has been obtained from sources believed to be reliable, but the accuracy or completeness
The Company measures the success of its business in part by employing several key                   of such information has not been independently verified by the Company and cannot be
performance indicators that are not recognized under IFRS. These indicators should not              guaranteed. Disclosure of past performance is not indicative of future results.
be considered an alternative to IFRS financial measures, such as net income. As non-

Forward-Looking Statements
This presentation may contain forward-looking statements and information relating to                These statements are based on management’s current expectations, intentions and
expected future events and the Company’s financial and operating results and projections,           assumptions which management believes to be reasonable having regard to its
including statements regarding the Company’s growth and investment opportunities and                understanding of prevailing market conditions and the current terms on which investment
the performance goals and expectations of its investees, including, in particular, targeted         opportunities may be available.
returns and growth projections, that involve risks and uncertainties. Such forward-looking
information is typically indicated by the use of words such as “will”, “may”, “expects” or          Projected returns and performance fees are based in part on projected cash flows for
“intends”. The forward-looking statements and information contained in this presentation            incomplete projects. Numerous factors, many of which are not in the Company’s control,
include statements regarding the Company’s strategic priorities; expected or targeted               and including known and unknown risks, general and local market conditions and general
investment returns and performance including project timing and cash flow; the ability of           economic conditions (such as prevailing interest rates and rates of inflation) may cause
the Company to generate fee income from investments and the quantum of these fees;                  actual investment performance and fee income to differ from current projections.
the ability to attract third-party investment; the timing and availability of new investment        Accordingly, although we believe that our anticipated future results, performance or
opportunities and pace of TAH home acquisitions; the proposed acquisition of Block 10;              achievements expressed or implied by the forward-looking statements and information are
future net income from investments; the funding of financing at The Selby; FFO growth               based upon reasonable assumptions and expectations, the reader should not place undue
and the potential drivers of that growth; expectations for the growth in the business; the          reliance on forward-looking statements and information. If known or unknown risks
availability and quantum of debt reduction opportunities and the Company’s ability to avail         materialize, or if any of the assumptions underlying the forward-looking statements prove
itself of them; and improvements to the Company’s financial reporting. In regards to the            incorrect, actual results may differ materially from management expectations as projected
targets presented on pages 18-21, 2019 Targets assume that future performance will be               in such forward-looking statements. Examples of such risks are described in the
materially consistent with performance for the first half of 2019, though there can be no           Company’s continuous disclosure materials from time-to-time, as available on SEDAR at
assurance this will be the case. 2022 Targets are based on the assumed impact of the                www.sedar.com. The Company disclaims any intention or obligation to update or revise
growth drivers listed and the assumption that other drivers of FFO performance will not             any forward-looking statements, whether as a result of new information, future events or
deteriorate over the relevant period. There can be no assurance that these growth                   otherwise, unless required by applicable law.
objectives will be realized or that actual performance will align with the Company’s targets.

                                                                                                1
Investor Presentation January 2020 - Tricon Capital
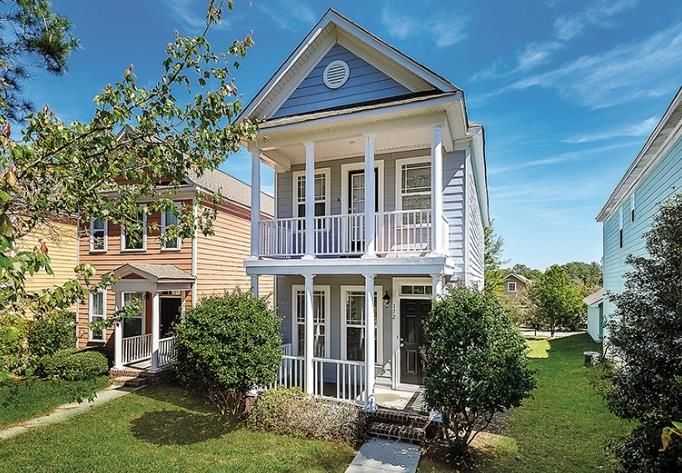
Tricon is a residential real estate company primarily                                                                                                       TSX: TCN
  focused on rental housing in North America, with
  $7.9 billion (C$10.5 billion) of assets under management

                    Single-Family Rental                                                        Multi-Family Rental                                   For-sale Housing

                                            Atlanta, GA
                                                                                                                      The James, Toronto, ON             Viridian, Arlington, TX

                                                                                                                      The Reserve at Alafaya,
                                           Charlotte, NC                          The Selby, Toronto, ON                        Orlando, FL     Cross Creek Ranch Houston, TX

The above photos may not be representative of all Tricon investment properties.

                                                                                                            2
Investor Presentation January 2020 - Tricon Capital
Our mission is to provide quality housing for families                                                                                                           TSX: TCN
  across North America and to generate strong risk-adjusted
  returns for our public and private investors

     1988                        Founded                                        19,962                             Single-Family
                                                                                                                   Rental (“SFR”)
                                                                                                                                                      C$2.0B   Market
                                                                                                                                                               Capitalization
                                                                                                                   Homes

                                                                                                                                                               Dividend Yield
     2010                        Listed (TSX)                                       7,289                          Stabilized
                                                                                                                   Multi-Family                        2.6%    (C$0.07/Quarter)
                                                                                                                   Rental Apartments

                                                                                                                                                           1
                                                                                                                   Multi-Family
                  31             Years of Investing
                                 In Communities                               ~3,600                               Rental Apartments                    19%    Annualized Growth
                                                                                                                                                               In Book Value Per
                                                                                                                   Under Development                           Share Since Entering
                                                                                                                                                               SFR In 2012

All data presented as at November 30th , 2019, All figures in U.S. dollars unless otherwise indicated.
1. Annualized growth in book value per share is calculated based on CAD book value since Tricon entered the Single Family Rental sector in Q1 2012.

                                                                                                                           3
Investor Presentation January 2020 - Tricon Capital
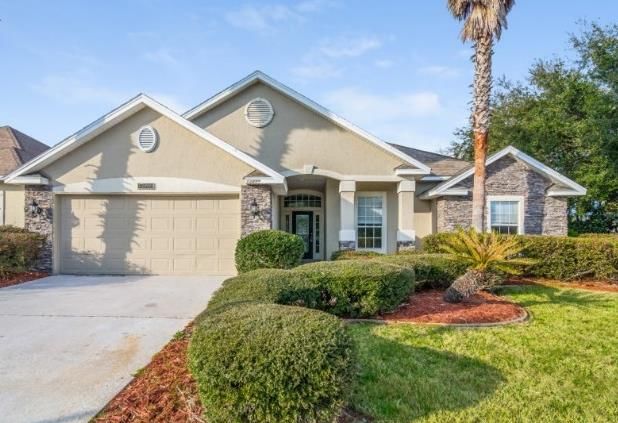
Our Strategic Vision
     Tricon generates predictable cash flow from rental assets and enhances its investment returns with
                         contractual fees earned from managing third-party capital

            Rental Income                                             Contractual Fees
                                                                         Earned from Managing
                                                                         Third-party AUM across
 Single-Family Rental         Multi-Family Rental
                                                                          all Business Verticals

          Centralized Management Office                                    Diverse Fee Streams

       Call Centre             Human Resources                             Asset Management Fees
  Resident Underwriting           Accounting                                  Development Fees
Technology and Innovation           Finance                               Property Management Fees
      Procurement                    Legal                                    Performance Fees

                                                       4
Investor Presentation January 2020 - Tricon Capital
Our Portfolio Composition
                       Tricon currently manages $7.9 billion of AUM, including $5.6 billion of principal investments
                                            and $2.3 billion on behalf of third-party investors

                                                                           $7.9B                        AUM

                                                       30% Third-Party                            70% Principal

                       Canada                                           $0.7B                 $3.6B
                         8%                                                                                                     Portfolio of 19,962 rental homes
                                                      Single-
                                                      Family                                                                    generating ~$85M of Core FFO
                                                      Rental
                                                                                                                                Joint venture with two leading

                                                                                                                                                                        Recurring cash flow
       U.S.                                                                                                                     institutional investors to acquire
       90%                                                                                                                      ~10,000 homes                                                 Increase
                U.S.
                92%                                                                                                                                                                           Balance
                                                                                                                                                                                              Sheet
              Geography                                                                                                                                                                       Exposure
                                                                        $0.4B                 $1.6B
                                                             Multi-                                                             Portfolio of 7,289 apartment units in
                         For-Sale                            Family                                                             the Sun Belt generating ~$28M of
                         Housing                             Rental                                                             Core FFO + ~3,600 development
                           20%
                                                                                                                                units in Toronto
    Single-                                                                                                                     Third-party managed assets generating
                                 Multi-
    Family
                                 Family                                                                                         ~$33M of annualized fee revenue and
    Rental
                                 Rental
     55%
                                  25%                              $1.2B                                                        projected to generate ~$88M of
                                                  For-sale                                                                      performance fees over 8 to 10 years1

                                                                                                                                                                           cash flow
                                                                                                                                                                           Episodic
                                                  Housing                                                                                                                                     Reduce
                                                                                                                                Land and homebuilding development
         Business Verticals                                                                                                     assets projected to generate ~$600M                           Balance
                                                                                                            $0.4B                                                                             Sheet
                                                                                                                                of cash to Tricon over 8−10 years
                                                                                                                                                                                              Exposure

1. Annualized fees based on Q3 2019 performance. Performance fees are based on current project plans. Realized fees may vary.

                                                                                                                         5
Investor Presentation January 2020 - Tricon Capital
The Case for Investing in Rental Housing
        The U.S. is facing a shortage of new affordable housing as many developers struggle to deliver entry level
         homes; we see a compelling case for investing in existing housing stock and providing affordable rental
                                         product with exceptional customer service

  U.S. Residential Permits and Building Intensity

                                       2,500                                                                                                                   8

                                                                                                                                    Building Intensity         7
                                       2,000                                                                                         is below prior
                                                           Recession
         Housing Permits (Thousands)

                                                                                                                                    recession levels           6

                                                                                                                                                                     Building Intensity
                                                                                                                                                               5
                                       1,500

                                                                                                                                                               4

                                       1,000
                                                                                                                                                               3

                                                                                                                                                               2
                                        500
                                                                                                                                                               1

                                          –                                                                                                                    –
                                                1980                         1990          2000                     2010                         2020-P

                                               Multi-Family Permits                               Single-Family Permits
                                               39-Year Average Total Residential Permits          Building Intensity (Annualized Housing Starts Per 1,000 Persons)

Source: John Burns Real Estate Consulting

                                                                                              6
Investor Presentation January 2020 - Tricon Capital
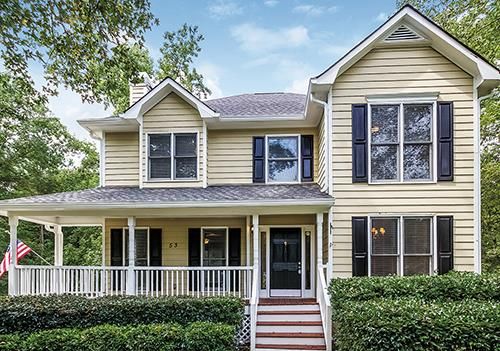
Millennials Driving Housing Demand
                                         Housing demand is being driven by Millennials forming new households with a higher
                                                            propensity to rent than their Boomer parents

                                                                                  Millennials are a larger

                                          103M Millennials                         cohort entering prime
                                                                                    years of household       72M Baby Boomers
                                                                                  formation, with a higher
                                                46% Homeownership                    propensity to rent      77% Homeownership
                                                      Rate                                                         Rate

                                                     (~ 10% lower today than in
                                                      1982 for 35-39 year olds)
                                5.5

                                5.0

                                4.5

                                4.0
   U.S. Population (Millions)

                                3.5

                                3.0

                                2.5

                                2.0

                                1.5

                                1.0
                                      11 13 15 17 19 21 23 25 27 29 31 33 35 37 39 41 43 45 47 49 51 53 55 57 59 61 63 65 67 69 71 73 75
                                                                                 Age (Years)

Source: John Burns Real Estate Consulting

                                                                                         7
Investor Presentation January 2020 - Tricon Capital
The U.S. Sun Belt - A Vast Residential Market Opportunity
                             The U.S. Sun Belt is home to about 40% of all U.S. households, and is expected to see
                                          60% of the growth in U.S. households over the next decade

      Projected population
      growth in the next 10 years                                   EDMONTON

                                                                        CALGARY
                10%−                                   VANCOUVER

                10% to 20%

                                                                                                                                TORONTO
                20%+

      Tricon Investments
                                                                 RENO                                   INDIANAPOLIS
                                                          RENO
            Tricon American Homes                     NORTHERN CALIFORNIA DENVER
                                                                             DENVER
                                                                     LAS VEGAS
             Single-Family Rental                             LAS
                                                        SOUTHERN  VEGAS
                                                                 CALIFORNIA                                                                     RALEIGH
                                                                                                                 NASHVILLE
                                                                                                                                            CHARLOTTE
                                                      SOUTHERN CALIFORNIA                                 NASHVILLE
            Tricon Lifestyle Rentals                                                     DALLAS-FORT WORTH                                COLUMBIA
                                                                                                                 ATLANTA
                                                                                                                     ATLANTA
             Multi-Family Rental                                        PHOENIX

                                                                   PHOENIX        DALLAS-FORT
                                                                                       AUSTIN WORTH
            Tricon Housing Partners                                                      SAN ANTONIO
                                                                                      AUSTIN
                                                                                                                                          JACKSONVILLE
                                                                                                       HOUSTON
                                                                                                                                           ORLANDO
             For-Sale Housing                                                           SAN ANTONIO
                                                                                                       HOUSTON                 TAMPA
                                                                                                                                              SOUTHEAST FLORIDA

Source: John Burns Real Estate Consulting

                                                                                  8
Investor Presentation January 2020 - Tricon Capital
Focus on the Middle Market
                         Tricon’s rental businesses are focused on the middle market, an addressable market of over
                                11 million households that possess strong long-term rentership fundamentals

                                                                                                           7M RENTERS
                                                                                           37M             $1,800+ Monthly Rent

                                                                                           HOUSEHOLDS      •   Temporary renters
                                                                                           >$100K          •   Higher turnover
                                                                                                           •   Higher ownership rate
                                                              $100K
Rent % of Household Income                                      HOUSEHOLD INCOME

                                                                                                           11.4M RENTERS
                                                                                           34M             $1,000 − $1,800 Monthly Rent

                                                                                           HOUSEHOLDS      •   Long-term residents
         30% HUD1
          threshold
                                                                                           $60K − $100K    •   Lower turnover
                                             Income cushion                                                •   Stable cash flow
~20%
avg. rent to income                          of ~$7,000 per
across the TAH &                             year
TLR US rental portfolio
                                                              $60K

                                                                                                           25.8M RENTERS
                                                                                           53M             < $1,000 Monthly Rent

                                                                                           HOUSEHOLDS      •   Higher eviction rates
Our People
              A dynamic, high-performing team of industry leaders and housing experts leading a team
                                           of ~700 dedicated employees

Toronto / San Francisco

26
Investment Team &
Tricon Development Group
                             Gary Berman              Wissam Francis                 David Berman                 Geoff Matus              Jonathan Ellenzweig        Andy Carmody

57
Finance, Accounting,
                             President & CEO      EVP & Chief Financial Officer     Executive Chairman
                                                                                      & Co-Founder
                                                                                                                   Co-Founder              Senior Managing Director   Managing Director

Tax and Legal Team

Houston

107                          Andrew Joyner              Kevin Baldrige                 Andrew Gray                Larry Johnson              David Veneziano            Wojtek Nowak
Johnson Development Corp.    Managing Director              President,                    President,                  President,           EVP & General Counsel       Managing Director,
                                                     Tricon American Homes        Tricon Development Group    The Johnson Companies LP                                  Capital Markets

Orange County /
Local Field Offices

505
Tricon American Homes         Evelyne Dubé            Douglas Quesnel                  Sandra Pereira               David Mark                  Gina McMullan         Geoffrey Gakundi
                             Managing Director,     Chief Accounting Officer      SVP, Head of Tax Services   Managing Director, Finance         Vice President,          Controller,
                               Private Funds                                                                                                  Corporate Accounting       Private Funds

                                                                                  10
Tricon American Homes
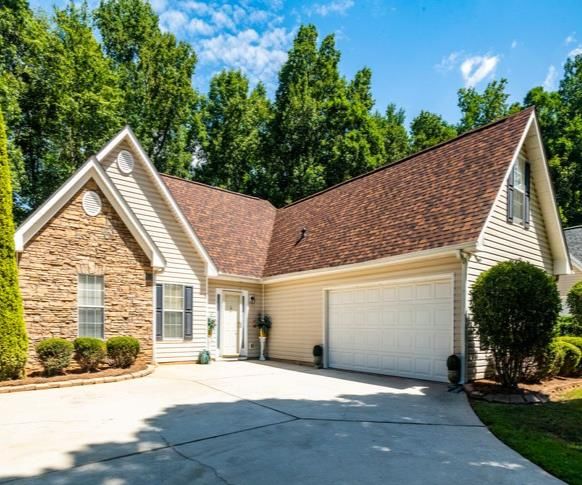
                                  An owner and operator of single-family rental homes focused on the U.S. Sun Belt

    $3.6B                                       $0.7B                       19,962        $1,403                 6.1%                  10.0%
    Principal Investments                       Third-Party AUM             Total Homes   Avg. Monthly Rent      Blended Rent Growth   Same Home NOI Growth

             Our
           20,000th
            Home

                                                              Atlanta, GA                              Houston, TX                              Charlotte, NC

                                                         Jacksonville, FL                             Columbia, SC                                Atlanta, GA
                                                      Jacksonville, FL

Note: Homes depicted may not represent all homes in the portfolio.

                                                                                            11
Strong Performance Metrics at TAH
                 TAH’s service-oriented and technology-enabled platform continues to drive strong operating results

    Total Portfolio
                 Blended Rental Growth                                       Annualized Turnover                       Number of Homes, NOI Margin and NOI1
                                                                                                                   $60.0M

                                                                                                                            16,766      17,442   18,131   19,080   19,962
                                          9.5% on new leases
                                           4.7% on renewals                                               29.2%                         64.5%    64.7%    65.1%    64.7%
                                                                  27.7%                           28.0%                     60.9%
                                                                          23.6%                                                                                    $49.7M
      6.7%          6.4%                                                             20.8%                                                                $47.1M
                                                   6.2%   6.1%
                                  5.7%                                                                             $45.0M
                                                                                                                                                 $43.7M
                                                                                                                                        $41.4M

                                                                                                                            $37.2M

                                                                                                                   $30.0M

    Q3 2018 Q4 2018 Q1 2019 Q2 2019 Q3 2019                       Q3 2018 Q4 2018 Q1 2019 Q2 2019 Q3 2019                   Q3 2018 Q4 2018 Q1 2019 Q2 2019 Q3 2019

   Same Home Portfolio

                Same Home NOI Growth1                                        Same Home NOI Margin Components                                             % of
                                                                             (in millions of U.S. dollars)                    Q3 2019                 Revenue
                                               11.6%                         Revenue                                                 $59.5

                                  9.3%                    10.0%
                                                                                  Repair, Maintenance & Turnover                       4.7                 8.0%
                    8.6%
      8.0%
                                                                                  Property Taxes                                       9.2                15.5%

                                                                                  Property Management Fees                             4.2                 7.1%

                                                                                  Other Expenses                                       2.5                 4.2%

                                                                             Total Operating Expenses                                 20.6                34.8%

    Q3 2018 Q4 2018 Q1 2019 Q2 2019 Q3 2019                                  Net Operating Income                                    $38.8                65.2%

1. All NOI metrics exclude impact of hurricanes.

                                                                                             12
TAH: Delivering on the Acquisition Plan
     TAH is on track to acquire ~3,000 homes this year with buying activity accelerating into the summer months;
             TAH’s upfront renovation program is designed to minimize deferred maintenance issues and
                               provide residents with a consistent high quality product

                                                                                                                               INDIANAPOLIS
                                Acquisitions                                                                                  Upfront Renovations

                                   173,721
                               New Q3 MLS homes                                                                                                                Chimney
                                      filtered by                                                                      Roof
                             proprietary TriAD platform
                                                                                                                                                                 Attic
                                    14,168                                                                Gutters
                               Underwritten homes
                                                                                         Bathrooms
                                     1,850
                                       Offers                                                        Plumbing
                                                                                                                                                               Windows
                                                                                                 Paint
                                       918
                                    Purchased                                      Siding
                                      in Q32

                                                                              Air Conditioning

      Planned acquisition pace of 700−900
      homes per quarter with the TAH JV1
                                                                                 Curb
                                                                                Appeal
                                                        Q3           Total
  Portfolio Metrics                           Acquisitions        Portfolio
                                                                                       Flooring
   Average Sq. Ft.                                        1,642       1,612                              Foundation/
                                                                                                                                        Electrical   Heating      Water
                                                                                                                       Appliances
   Average Monthly Rent                                 $1,462       $1,403                              Insulation                                               Heater

   Average Monthly Rent / Sq. Ft.                         $0.89       $0.87

1. Refer to the general disclaimer on page 1.
2. Includes homes purchased through MLS and other channels.

                                                                                            13
Industry Leading Technology Platform
         Innovative technology is at the core of TAH operations – from acquisition of homes to leasing
                                             and customer service

                                                                             Cloud
                               Cellular               Broadband
                                                                           Computing
                               Mobility               Networking
                                                                          and Analytics

                  Proprietary TriAD platform filters over
   Home           1 million MLS listing/yr based on 90 point         Revenue       Balancing rent vs. occupancy and
 Acquisitions     criteria with ability to issue a purchase         Optimization   time on market
                  agreement in under five minutes

                   Coded lock boxes allow for secure and                           3D imaging captures and
   Self                                                               Home
                   efficient showings at times that are             Documenting
                                                                                   documents key components of
 Showings
                   convenient for the potential resident                           the home

                                                                                   TriOPS platform enables real-time data
                                                                                   sharing by field staff and head office
                  Automated lease application,                       Repair &
  Leasing         resident underwriting and                         Maintenance    Mobile inventory management for
                  rental payment options                                           maintenance techs
                                                                                   Roof diagnosis using drones

                                                               14
Tricon Lifestyle Rentals – Canada
                 Tricon’s multi-family development and rental business, operated through an in-house investment,
                                           development and asset management platform

  $0.2B                                           $0.4B                                     ~3,100                                                 ~500                                                   73%
  Principal Investments                           Third-Party AUM                           Suites Under development                               Suites in Lease-up                                     The Selby Lease-up
                                                                                                                                                                                                          (112 leases signed during Q3;
                                                                                                                                                                                                          $3.75 Average In-Place Rent PSF1)

                                                                                                                                                            Cost to date
                                                                                                                                                              $338M

                                                                                                                                                                                                                   $36M
               The Selby                                The Taylor                               The James                                             Remaining Costs                                          (TCN share
                                                                                                                                                          $1,088M 2                                          = ~30% or ~$11M)
                                                                                                                                                              (mostly
                                                                                                                                                             funded by
                                                                                                                                                            construction
                                                                                                                                                               loans)

                                                                                                                                                                                                                                      3
                                                                                                                                                         Funding Status                                   Projected Annual FFO
                                                                                                                                                                                                            Upon Stabilization
          West Don Lands                                   Gloucester                               7 Labatt

1. As of September 30th, 2019.
2. Based on current project plans, which are subject to change.
3. Calculated on a total portfolio basis and based on target development yield of 5.25% on cost, with assumed financing of 65% loan-to-cost and interest rate of 3.5%; Tricon’s equity stake in the portfolio is approximately 30%.
There can be no assurance that actual performance will align with these projections.

                                                                                                                              15
Tricon Lifestyle Rentals – U.S.
                              An owner of multi-family garden-style apartment buildings focused on the U.S. Sun Belt

   ~$1.3B                            23                          7,289                        966 SF            $1,240                       $1.28                        2012
   Market      Value1                Properties                  Total Units                  Avg. Unit Size    Avg. Monthly Rent            Avg. Monthly Rent / SF       Average Vintage

                                Falls at Eagle Creek, Houston, TX                                                   The Allure, Austin, TX              The Reserves at Alafaya, Orlando, FL

                                                  The Callie, Dallas, TX                                       Carrick Bend, Denver, CO                      Altis at Sand Lake, Orlando, FL

Note: Representative images are of select units and may not represent all properties.
1. Market value reflects IFRS fair value of investment properties as at September 30, 2019.

                                                                                                               16
Tricon Housing Partners
      A leading equity investor in For-Sale Housing across North America, with a fully-integrated investment
                        management and development platform via Johnson Development

$0.4B                                    $1.2B             ~$600M                          78,900
Principal Investments                    Third-Party AUM   Projected distributions to      Planned residential units across 18
                                                           Tricon over 8-10 years          Johnson communities

                 Cross Creek Ranch, Houston, TX                     Viridian, Dallas, TX            Rockwell, San Francisco, CA

                        Massey Tower, Toronto, ON              Vida, San Francisco, CA        1101 El Camino, Mountain View, CA

                                                             17
FFO Growth Drivers
                                                       Targeting annual compounded growth of 10% in FFO per Share

                         Target FFO per Diluted Share1                                                                                          Selected Growth Drivers 1

                                                                                                                     1   Single-Family Rental
                                                                                                                                                               $8M            $108M
                                                                                                                                              $24M
                                       10%+                                                                                    $76M
                                Target Compounded
                                Annual Growth Rate

                                                                                                                         Q3 2019 FFO Impact of 4.5%    Impact of      Illustrative FFO
                                                                                                                          Annualized Same Home NOI Completing            Run-Rate in        + $0.15
                                                                                                                                        Growth      JV-1 Acquisitions        2022           FFO Per Share 3

                                                                                                                     2   U.S. Multi-Family Rental
                                                                                                                                                      $6M                    $33M

                                                                                                                                   $27M
                                                                $0.50 to $0.55
           $0.37 to $0.40
                                                             (C$0.66 to C$0.72)
        (C$0.48 to C$0.52)
                                                                                                                            Q3 2019 FFO       Impact of 3.0% Same        Illustrative FFO   + $0.03
                                                                                                                             Annualized        Property NOI Growth      Run-Rate in 2022    FFO Per Share 3

                                                                                                                     3    Contractual Fees
                                                                                                                                                                              $42M
                                                                                                                                                      $10M
               2019 Target                                         2022 Target
                                                                                                                                          2
                                                                                                                                   $32M

                                                                                                                            Q3 2019 FFO       Impact of Adding $1B of    Illustrative FFO   + $0.05
                                                                                                                             Annualized          Third-Party AUM        Run-Rate in 2022    FFO Per Share 3
1.   Refer to the Forward-Looking Statements in Page 1.                                                                                             at 1% Fee
2.   Q3 2019 annualized FFO excludes performance fees.
3.   FFO per share impact is calculated as the additional FFO divided by 215 million diluted weighted average shares outstanding

                                                                                                                          18
Targeted Asset Mix
                               Targeting higher contribution from predictable income streams and third-party capital

                                                                                    Current                                              2022 Target 3                      Drivers

            FFO Contribution                     1                              26%                                                           20%              •   Completing TAH JV – 1
                                                                                                                                         5%
                                                                                                                                                                   investment program
        Single-Family                    Multi-Family                                           49%                                                      55%
                                         Rental 2                          8%
        Rental 2
                                                                                                                                             20%
                                                                                                                                                               •   Assumed syndication of 50%
        Contractual Fees                 Residential                              17%                                                                              of the U.S. Multi-Family
                                         Developments
                                                                                                                                                                   Portfolio

                                                                                                                                                               •   Completion of Canadian Multi-
                                                                                                                                                                   Family development projects,
                                                                                             19%                                                    10% -15%
               Balance Sheet                                                                                                                                       including The Selby, The
                  Assets                                                                                                                                           Taylor, Gloucester, and WDL-
                                                                                  81%
                                                                                                                                                                   Block 8/20
         Rental    2                       Development                                                                                       85% - 90%

                                                                                                                                                               •   Reducing THP balance sheet
                                                                                                                                                                   exposure by half

                                                                                                                                                               •   Selling remaining TLR U.S.
                                                                                             30%
                                                                                                                                                      45%          non-core asset (The Maxwell)
                       AUM
         Principal                         Third-Party                            70%                                                        55%

1.   Current FFO per vertical (before corporate overhead) is based on Q3 2019 funds from operations as disclosed in Section 6 of the MD&A.
2.   Rental portfolio include single-family rental, U.S. multi-family rental and stabilized Canadian multi-family rental portfolios.
3.   Refer to the Forward-Looking Statements in Page 1.

                                                                                                                         19
Strategic Priorities1

                                                                          • Continue to transform Tricon into a residential real estate company primarily focused
         Grow FFO per                                                       on rental housing, providing stable, predictable income for shareholders
            Share                                                         • Target 10%+ compounded annual growth rate in FFO per Share

                                                                          • Raise third-party capital in all business verticals to enhance scale, improve operational
 Increase Third-Party                                                       efficiency, and drive return on equity with incremental fee income
        AUM                                                               • Add new third-party equity capital commitments of $1B+ over three years and generate
                                                                            fee income that largely covers Tricon’s corporate overhead

     Grow Book Value                                                      • Build shareholder value by deploying the majority of our free cash flow into accretive
        per Share                                                           growth opportunities focused largely on rental housing

                                                                          • Minimize corporate-level debt while maintaining prudent and largely non-recourse
                                                                            leverage at the subsidiary level
     Reduce Leverage                                                      • Pursue look-through leverage target of 50-55% net debt to assets, largely by
                                                                            reducing debt using THP cash flows

                                                                         • Adopt financial disclosure practices that reduce complexity and improve comparability
    Improve Reporting                                                      of results with real estate peers

1. There can be no assurance that these objectives will be achieved in line with the Company’s current expectations, or at al l.

                                                                                                                                   20
Performance Dashboard1
      Grow FFO per Share4                                                          Increase Third-Party AUM                                    Grow Book Value per Share
           Target 10%+ compounded                                                      Target raising $1.0B+ in fee-bearing                          19% annualized growth since 2012
                 annual growth                                                            capital over the next 3 years

                                                                                                                                                                                          C$11.04

                                                C$0.66 to C$0.73
                                                 ($0.50 to $0.55)
               67%
                                                                                                                          ~$3.3B +

                                                                                               $2.3B                                           C$3.38
                             C$0.15
     C$0.09                  ($0.11)
     ($0.07)
                                                                                                                                                 2012 2013 2014 2015 2016 2017 2018 Q3'19
 Q3 2018                     Q3 2019                   2022 FY                                Q3 2019                       2022
                                                        Target                                                             Target             Book Value per Share does not fully capture the value from:
                                                                                                                                              • Private Funds & Advisory fee stream ($11.3M in Q3/19)
                                                                                                                                              • Embedded growth in underlying investments

                                     Reduce Leverage2                                                                                               Improve Reporting
     Current Corporate                          Total Current                           Targeted Look-Through
         Leverage                          Look-Through Leverage3                        Leverage of 50-55%
                                                                                                                                                ✓
                                                                                                                                                □ Adopt more conventional company-
                                                                                                                                                     wide real estate performance metrics,
                  14%                                                                                                    Working towards
                                                  39%                                       45-50%                                                   such as FFO per share
                                                                                                                         the syndication of
                                                                                                                         wholly-owned THP       □ Adopt comprehensive ESG plan
          86%                                                  61%                                      50-55%           and TLR U.S.
                                                                                                                         investments            •    Review financial disclosure practices
                                                                                                                                                     vs. real estate peers
       Equity         Debt                                               Equity         Debt

1.      Refer to Page 1.
2.      All debt figures are presented net of cash and exclude Tricon’s outstanding 5.75% convertible debentures.
3.      Includes Tricon’s share of THP net asset value.
4.      USD/CAD exchange rates used are 1.32 at September 30, 2019 and going-forward;1.29 at September 30, 2018.

                                                                                                                    21
Gary Berman                             Wissam Francis                Wojtek Nowak
President and Chief Executive Officer   Executive Vice President      Managing Director, Capital Markets
                                        and Chief Financial Officer

416.928.4122                            416.323.2484                  416.925.2409
gberman@triconcapital.com               wfrancis@triconcapital.com    wnowak@triconcapital.com

                                            www.triconcapital.com
You can also read