Investor Presentation - June 2021 - Q4
←
→
Page content transcription
If your browser does not render page correctly, please read the page content below
Investor Presentation
June 2021
Disclaimer

This presentation has been prepared by CAE Inc. (“CAE” or the “Company”) solely for information purposes.

External Sources and Data (including Financial)

Where this presentation quotes any information or statistics from any external source, it should not be interpreted that the Company has adopted or endorsed such information or statistics as being accurate. We advise you that some
of the information presented herein is based on or derived from statements by third parties, has not been independently verified by or on behalf of the Company, and that no representation or warranty, express or implied, is made as
to, and no reliance should be placed on, the fairness, accuracy, completeness or correctness of this information or any other information or opinions contained herein, for any purpose whatsoever.

Pending the Acquisition closing, L3Harris Military Training is a fully integrated business unit of L3Harris, and separate financial statements historically have not been prepared for the L3Harris Military Training business. Consequently,
the financial information of the L3Harris Military Training business included in this document has been derived from the consolidated financial statements and historical accounting records of L3Harris and reflects certain significant
assumptions, judgments and allocations made by L3Harris. The financial position, net income and cash flows of the L3Harris Military Training business may not be representative of the financial performance if the L3Harris Military
Training business had been a stand-alone entity or operated independently of L3Harris. As a result, the historical financial information of the L3Harris Military Training business may not be a reliable indicator of future results.

Market Data

This presentation may contain or reference certain market, industry and peer group data which is based upon information from independent industry publications, market research, analyst reports and surveys and other publicly
available sources. Although the Company believes these sources to be generally reliable, such information is subject to interpretation and cannot be verified with complete certainty due to limits on the availability and reliability of raw
data, the voluntary nature of the data gathering process and other inherent limitations and uncertainties. The Company has not independently verified any of the data from third party sources referred to in this presentation and
accordingly, the accuracy and completeness of such data is not guaranteed. In addition, certain of the data contained in this presentation come from the Company’s own internal research and estimates based on the knowledge and
experience of the Company’s management in the market in which the Company operates. While the Company believes that such research and estimates are reasonable and reliable, they, and their underlying methodology and
assumptions, have not been verified by any independent source for accuracy or completeness and are subject to change without notice. Accordingly, undue reliance should not be placed on any of the contained estimates or research
in this presentation.

Currency

All amounts in this presentation are expressed in Canadian dollars unless otherwise indicated.

2                                                                                           CAE Inc. Proprietary Information and/or Confidential

Disclaimer
Caution Regarding Forward-Looking Statements

This presentation includes forward-looking statements about our activities, events and developments that we expect to or anticipate may occur in the future including, for example, statements relating to our activities, events and
developments that we expect to or anticipate may occur in the future including, for example, statements about our vision, strategies, market trends and outlook, future revenues, capital spending, expansions and new initiatives,
financial obligations, available liquidities, expected sales, general economic outlook, prospects and trends of an industry, expected annual recurring cost savings from operational excellence programs, estimated addressable markets,
statements relating to our proposed acquisition of the L3Harris Military Training business (L3H MT), the attractiveness of the L3H MT acquisition from a financial perspective and expected accretion in various financial metrics,
expectations regarding anticipated cost savings and synergies, the strength, complementarity and compatibility of the L3H MT acquisition with our existing business and teams, other anticipated benefits of the L3H MT acquisition and
their impact on our future growth, results of operations, performance, business, prospects and opportunities, our business outlook, objectives, development, plans, growth strategies and other strategic priorities, and our leadership
position in our markets and other statements that are not historical facts. Forward-looking statements normally contain words like believe, expect, anticipate, plan, intend, continue, estimate, may, will, should, strategy, future and
similar expressions. All such forward-looking statements are made pursuant to the 'safe harbour' provisions of applicable Canadian securities laws and of the United States Private Securities Litigation Reform Act of 1995.

By their nature, forward-looking statements require us to make assumptions and are subject to inherent risks and uncertainties associated with our business which may cause actual results in future periods to differ materially from
results indicated in forward-looking statements. While these statements are based on management’s expectations and assumptions regarding historical trends, current conditions and expected future developments, as well as other
factors that we believe are reasonable and appropriate in the circumstances, readers are cautioned not to place undue reliance on these forward-looking statements as there is a risk that they may not be accurate.

You will find more information about risk factors in CAE’s MD&A for the year ended March 31, 2021 and in our filings with the Canadian securities regulatory authorities and the U.S. Securities and Exchange Commission, all of which
are available under our profile on SEDAR at www.sedar.com and on EDGAR at www.sec.gov. Any one or more of the factors described above and elsewhere in this presentation may be exacerbated by the continuing COVID-19
pandemic and may have a heightened negative impact on CAE’s business, results of operations and financial condition. Accordingly, readers are cautioned that any of the disclosed risks could have a material adverse effect on CAE’s
forward-looking statements. Readers are also cautioned that the risks described in the MD&A and elsewhere in this presentation are not necessarily the only ones we face; additional risks and uncertainties that are presently unknown
to us or that we may currently deem immaterial may adversely affect our business.

The forward-looking statements contained in this presentation describe our expectations as of March 31, 2021 and, accordingly, are subject to change after such date. Except as required by law, we disclaim any intention or obligation
to update or revise any forward-looking statements whether as a result of new information, future events or otherwise. The forward-looking information and statements contained in this presentation are expressly qualified by this
cautionary statement. Forward-looking statements are presented in this presentation for the purpose of assisting readers in understanding certain key elements of the Acquisition and the related private placements. Readers are
cautioned that such information may not be appropriate for other purposes.

In addition, statements that “we believe” and similar statements reflect our beliefs and opinions on the relevant subject. These statements are based on information available to us as of the date of this presentation. While we believe
that information provides a reasonable basis for these statements, that information may be limited or incomplete. Our statements should not be read to indicate that we have conducted an exhaustive inquiry into, or review of, all
relevant information. These statements are inherently uncertain, and investors are cautioned not to unduly rely on these statements.

3                                                                                         CAE Inc. Proprietary Information and/or Confidential

Disclaimer
Material assumptions

The forward-looking statements set out in this presentation are based on certain assumptions including, without limitation: the anticipated negative impacts of the COVID-19 pandemic on our businesses, operating results, cash flows
and/or financial condition, including the intended effect of mitigation measures implemented as a result of the COVID-19 pandemic and the timing and degree of easing of global COVID-19-related mobility restrictions, the prevailing
market conditions, customer receptivity to CAE’s training and operational support solutions, the accuracy of our estimates of addressable markets and market opportunity, the realization of anticipated annual recurring cost savings and
other intended benefits from recent restructuring initiatives and operational excellence programs, the stability of foreign exchange rates, the ability to hedge exposures to fluctuations in interest rates and foreign exchange rates, the
availability of borrowings to be drawn down under, and the utilization, of one or more of our senior credit agreements, our available liquidity from cash and cash equivalents, undrawn amounts on our revolving credit facilities, the
balance available under our receivable purchase program, our cash flows from operations and continued access to debt funding will be sufficient to meet financial requirements in the foreseeable future, no material financial,
operational or competitive consequences from changes in regulations affecting our business, the satisfaction of all closing conditions of the L3H MT acquisition, including receipt of all regulatory approvals in a timely manner and on
terms acceptable to CAE, our ability to retain and attract new business, achieve synergies and maintain market position arising from successful integration plans relating to the L3H MT acquisition, our ability to otherwise complete the
integration of the L3H MT business acquired within anticipated time periods and at expected cost levels, our ability to attract and retain key employees in connection with the L3H MT acquisition, management's estimates and
expectations in relation to future economic and business conditions and other factors in relation to the L3H MT acquisition and resulting impact on growth and accretion in various financial metrics, the realization of the expected
strategic, financial and other benefits of the L3H MT acquisition in the timeframe anticipated, economic and political environments and industry conditions, the accuracy and completeness of public and other disclosure, including
financial disclosure, by L3Harris Technologies, absence of significant undisclosed costs or liabilities associated with the L3H MT acquisition, the ability of CAE to opportunistically access the capital markets before or after the L3H MT
acquisition closing and absence of material change in market conditions. For additional information, including with respect to other assumptions underlying the forward-looking statements made in this presentation, refer CAE’s MD&A
for the year ended March 31, 2021 and in our filings with the Canadian securities regulatory authorities and the U.S. Securities and Exchange Commission, all of which are available under our profile on SEDAR at www.sedar.com and
on EDGAR at www.sec.gov. Given the impact of the changing circumstances surrounding the COVID-19 pandemic and the related response from CAE, governments, regulatory authorities, businesses and customers, there is
inherently more uncertainty associated with CAE’s assumptions. Accordingly, the assumptions outlined in this presentation and, consequently, the forward-looking statements based on such assumptions, may turn out to be inaccurate.

Non-GAAP Measures

Except as otherwise indicated, all financial information has been reported in accordance with International Financial Reporting Standards (IFRS) as issued by the International Accounting Standards Board (IASB).

This presentation includes non-GAAP and other financial measures. Non-GAAP measures are useful supplemental information but do not have a standardized meaning according to GAAP. These measures should not be confused
with, or used as an alternative for, performance measures calculated according to GAAP. Furthermore, these non-GAAP measures should not be compared with similarly titled measures provided or used by other companies.
Management believes that providing certain non-GAAP measures provides users with a better understanding of our results and trends and provides additional information on our financial and operating performance.

For non-GAAP and other financial measures monitored by CAE, and a reconciliation of such measures to the most directly comparable measure under GAAP, please refer to Section 3.7 and 3.8 of CAE’s MD&A for the year ended
March 31, 2021 filed with the Canadian Securities Administrators available on our website (www.cae.com) and on SEDAR (www.sedar.com). Non-GAAP and other financial measure definitions and reconciliations to the most directly
comparable measures under GAAP can also be found in the Appendix of this presentation.

4                                                                                          CAE Inc. Proprietary Information and/or Confidential

OVERVIEW

We are a high-tech company with a noble purpose focused on safety

                      Our mission
                      To lead at the frontier of digital immersion with high-tech training and
                      operational support solutions to make the world a safer place.

                     Our vision
                     To be the worldwide partner of choice in civil aviation, defence and
                     security, and healthcare by revolutionizing our customers’ training and
                     critical operations with digitally immersive solutions to elevate safety,
                     efficiency and readiness.

5                                  CAE Inc. Proprietary Information and/or Confidential
OVERVIEW

CAE is a world leader in training and operational support solutions with three core
business units

                Civil Aviation Training               Defence and Security                              Healthcare
                       Solutions

                                                      We train and support
                We play a key role in
                                                      allied forces around                             We help make
                making air travel safer
                                                      the world for critical                        healthcare safer and
                        We deliver over                     missions                                  improve patient
                        1 million hours                                                                  outcomes
                                                         We help to ensure
                     of training annually*
                                                          their readiness

*FY2019 and FY2020
6                                            CAE Inc. Proprietary Information and/or Confidential
OVERVIEW

Diversified global business                                                                                                                               Total Revenue
                                                                                                                                                               Healthcare
 For the year ended, March 31, 2021. Metrics not reflective of recently announced Military Training and Simulation acquisition.
                                                                                                                                                  Defence and
                                                                                                                                                                      12
                                                                                                                                                  Security

                                                                                                                                                               41           %     47

                                                                                                                                                                                 Civil Aviation
                                                                                                                                                                                 Training Solutions

                                                                                                                                                      Products/Service
                                                                                                                                                           Mix*
                                                                                                                                                    Products

                                                                                                                                                          40
                                                                                                                                                                            %
                                                                                                                                                                                  60
                                                                                                                                                                                        Services

                                                                                                                                                        Geographic Mix
                                                                                                                                                                            44         U.S.A.

     Corporate head office

     Civil Aviation Training Solutions
                                                                                                                                                                            %      33
                                                             $3.0B                                    160+                           10,000+
     Defence & Security

     Healthcare                                                                                                                                  Europe & UK
                                                                                                                                                                  23
                                                                                                                                                                                           Rest of

                                                             FY21 Revenue                             locations                      employees                                          the World

* Approximate value including JV sales

7                                                                             CAE Inc. Proprietary Information and/or Confidential
OVERVIEW
We are a global leader in immersive synthetic training environments
Knowledge Leadership Industrial Champion Advanced Technologies
2,000+ engineers Best-in-class global supply Deep technology expertise
Electronics chain
Virtual and Augmented Reality
Systems Broad global Footprint Remote (real-time) networking
Mechanical & electrical World-class operational and Synthetic Environment
Software functional processes
Cloud- and AI-based solutions
Talented manufacturing Short prototype-to-production
workforce cycle time Complex man-to-machine
interface
Highly agile organization
8 CAE Inc. Proprietary Information and/or Confidential
OVERVIEW

CAE’s 8 pillars of strength

                                                       Industry leader with a           Potential for compound
                                                       strong competitive               growth and superior
                                                       moat                             returns over the long
                                                                                        term
      ‘8 Pillars of Strength’
      underlie CAE’s                                   High degree
      compelling investment                            of recurring                     Solid financial position and
                                                                                        highly cash generative
                                                       business
      thesis, culminating in a                                                          business model
      technology-focused,
      secular growth                                   Headroom
      company with market-                             in large
                                                                                        Excellent and diverse
                                                                                        team with a unique
                                                       markets
      leading positions and a                                                           social impact on safety
      high degree of
      recurring business                               Culture of innovation,
                                                       empowerment,                     Technology and
                                                       excellence and                   industry thought leader
                                                       integrity

9                                CAE Inc. Proprietary Information and/or Confidential
OVERVIEW

Recently announced highly strategic acquisition with significant financial benefits

               1     Accelerates CAE’s Defence & Security growth strategy

                     2       Enhances alignment with key US National Defence Strategy priorities and next gen platforms

                         3       Creates end-to-end suite of capabilities in military air training and simulation

                         4       Broadens position in other large and growing military training and simulation domains
 Military Training

                     5       Common culture focused on innovation, at the frontier of digital immersion

                6    Low-teens % EPS accretion expected in first full year post-close, including cost synergies

10                                                  CAE Inc. Proprietary Information and/or Confidential
Civil Aviation Training Solutions
CIVIL AVIATION TRAINING SOLUTIONS
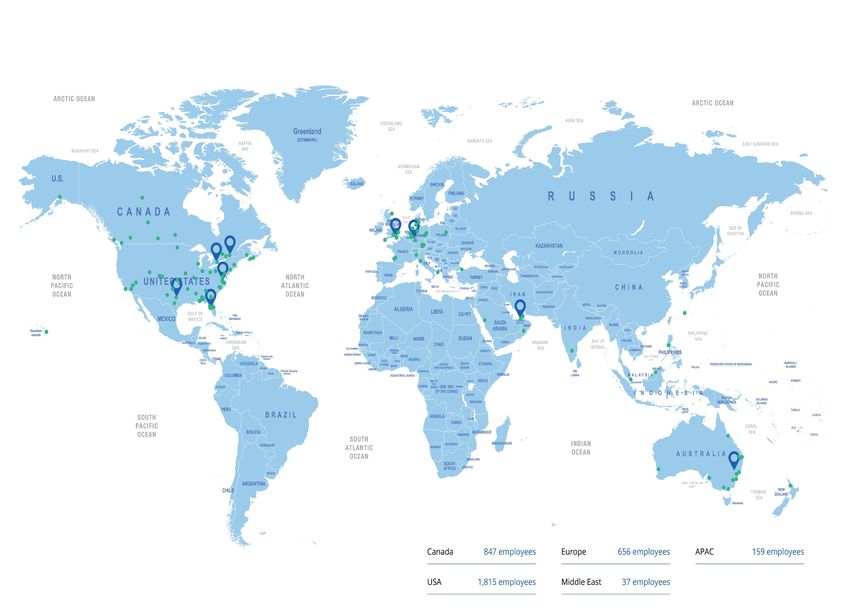
The world’s largest civil aviation training network
Stockholm
Oslo •
170+ London Burgess Hill
• Copenhagen
Rev: 364.5M
Aircraft Dublin •
Amsterdam
Shannon Oxford •
Antwerp
300+*
Brussels • Prague
London Gatwick
Frankfurt
• Milan
Full Flight
Simulators (FFS) Vancouver •
• Barcelona • Rome
Madrid • Istanbul •
Toronto • Montréal • St John’s • Palma de
Minneapolis • Mallorca
•
SOI : 51.9M
60+
• New Jersey Morristown Beijing •
San Francisco • Scottsdale • Seoul
• Tokyo
Phoenix •• • Dallas
Dubai Shanghai •
• Orlando New Delhi •
Training Dammam •
Abu Dhabi Gondia •
Guangzhou
• Hong Kong
Locations Mexico City / Toluca •
• Clark
Bengaluru • Ho Chi Minh•
Addis Ababa •
• Bogotá
Kuala Lumpur •
• Singapore
• Jakarta
1M+ hours
Lima •
• São Paulo
Annual Training Delivery (FY19, FY20) • Johannesburg
Locations Santiago •
Perth •
135,000+ pilots
Cadet training Melbourne •
Commercial aviation training
Business aviation training
Trained Every Year (FY19, FY20)
Helicopter aviation training
Aviation recruitment
* Non-GAAP and other financial measures (see Appendix)
12 CAE Inc. Proprietary Information and/or ConfidentialCIVIL AVIATION TRAINING SOLUTIONS
Market drivers
Demand Drivers Profitability Drivers
• Rigorous industry • Favourable business mix
regulations and secular drivers, including large market CAE’s Civil
growth in air travel headroom in training services
Aviation Training
• Potential to increase ratio of
• Safety and efficiency
imperatives, including wet vs dry training in Solutions segment
maintenance of time-bound commercial training is positioned as a
flight crew, new training
requirements and enhanced
• Expansion of operational
support offering by
gateway in a
safety management systems leveraging advanced highly regulated,
analytics, software solutions
• Pilot churn and new pilot and other digital technologies
secular growth
demand
• Operational excellence market, and it has
• Expected LT growth from new programs expected to realize significant
aircraft deliveries and significant annual recurring
renewal of fleet cost savings across whole headroom for
• Need for innovative solutions
organization, commencing in
fiscal year 2022 and ramping
growth
to drive greater operational up to a run rate of ~$65 to
efficiency $70M company-wide
• Enhanced safety • Training outsourcing and
management systems for partnerships
aircraft operators
13 CAE Inc. Proprietary Information and/or ConfidentialCIVIL AVIATION TRAINING SOLUTIONS
Headroom in a large market
Civil Addressable Market
~$6.2B*
~30%*
CAE
CAE has potential to increase share in a large and growing market
Source: CAE internal analysis
* Market share metrics based on FY20 (pre Covid-19 revenue
14 CAE Inc. Proprietary Information and/or ConfidentialCIVIL AVIATION TRAINING SOLUTIONS
We have been opportunistic with M&A
Canada
Amsterdam-based provider A leading manufacturer of A leading civil aviation crew A leading provider of fully
of total civil training flight simulators and training management and integrated solutions that
solutions as well as devices for civil markets optimization software modernize the way airlines
instructor provisioning company interact with their crew.
Highlights Highlights Highlights Highlights
Continued expansion of CAE’s
Expands CAE’s addressable Acquisition strengthens CAE’s Accelerates expansion into reach beyond pilot training and
market of customers including global civil training capabilities software-enabled civil aviation into the rapidly growing market
commercial cargo operators services for digitally enabled crew
Expands addressable market for optimization services.
Low integration complexity simulator lifecycle support Strengthens CAE’s digital flight
within CAE’s existing European operations portfolio Expands CAE’s technology
footprint Adds order backlog* and access capabilities to offer our airlines
to new customers Expands addressable market in and business aviation’s
airline crew operations and
enhanced modern mobile
optimization software
technology to connect with their
crew.
CAE is capitalizing on market disruption by successfully executing acquisitions that align with its strategic priorities
* Non-GAAP and other financial measures (see Appendix)
15 CAE Inc. Proprietary Information and/or ConfidentialDefence & Security
DEFENCE & SECURITY
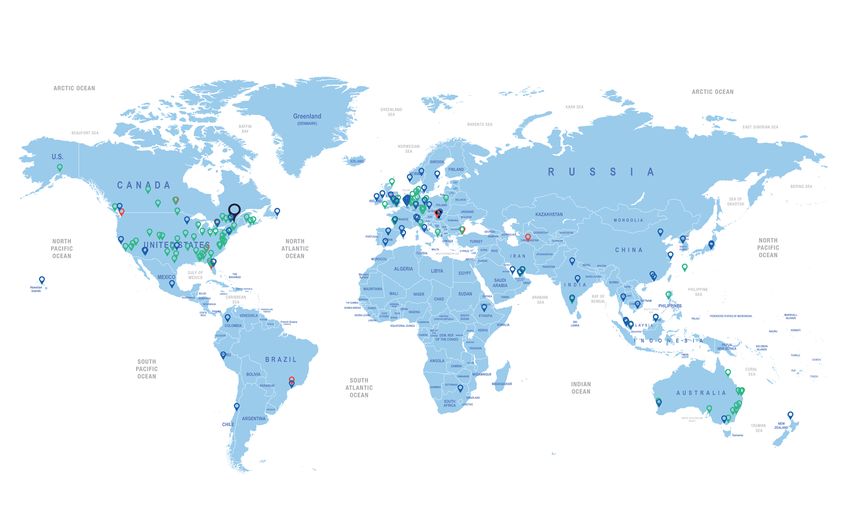
The global defence business
D&S regional offices
in key markets
50+ Washington, DC (HQ)
Countries Tampa, FL
Montreal, QC
Ottawa, ON
50+
Burgess Hill, UK
Stolberg, Germany
Abu Dhabi, UAE
Defence forces
Sydney, Australia
70+
Platforms
120+
Sites
Operations strategically located in key growth markets with training support services at 120+ sites
17 CAE Inc. Proprietary Information and/or ConfidentialDEFENCE & SECURITY
Market drivers
Demand Drivers Profitability Drivers
• Premium on mission
readiness driven by global • Increasing mix of international, CAE’s Defence &
including foreign military sales
geopolitical tension and
instability (FMS) Security segment
• Operational focus on improving
is positioned as
• Higher mix of simulated vs live
training due to budget priorities contracting, sub-contracting the partner of
and quality
choice in live,
• Complex, multi-domain, joint
and coalition forces exercises • Expansion of mission support virtual and
offering by using advanced
require training in synthetic
environments analytics and software constructive
solutions training, and is
• Need for analytics and AI to
process large data sets and
• Operational excellence programs focused on being
expected to realize significant
complex threats annual recurring cost savings the global leader
• Increasing adoption of new and
across whole organization,
commencing in fiscal year 2022
in digital
innovative mediums of training and ramping up to a run rate of immersion
~$65 to $70 million company-wide
18 CAE Inc. Proprietary Information and/or ConfidentialDEFENCE & SECURITY
Defence addressable market
Training Systems Integration (TSI) ~$14B* Military Training &
Simulation Market
Live Training
Virtual Training Land
7%
Naval
Constructive Training Air
7%
75%
11% Space & Cyber
CAE is a world leading Training Systems Integrator with significant headroom in its addressable markets
Source: CAE internal analysis
* Metrics in CAD. Market size represents FY20
19 CAE Inc. Proprietary Information and/or ConfidentialDEFENCE & SECURITY
L3Harris technologies’ military training: a leading, full-service training provider with
comprehensive solutions across multiple domains
Core Business Areas
HEADQUARTERS
Arlington, TX
9 COUNTRIES
23 LOCATIONS Fast Jet Bombers Rotary Ground Submarines
EMPLOYEES
1,600+ ...Provide Complete Solutions for Critical US Defense Priorities
80% secret / high clearance
150+ Programs US Air
US Army US Navy
Vertically integrated total training solutions Force
provider
15 Year F-16 Training Provider US Air
US Dept. US Marine
Legacy of electronic warfare systems on F-16s National
of Defense Corps
Guard
20 CAE Inc. Proprietary Information and/or ConfidentialDEFENCE & SECURITY
Acquisition strongly aligned with D&S strategic imperatives
CAE DEFENCE & SECURITY STRATEGIC IMPERATIVES
Alignment to US Develop Strategic Leveraging High Expand & Extend Target Larger
National Defense Partnerships on PWIN to Increase Addressable Market Opportunities
Strategy (NDS) Next-Gen Platforms Teaming Expansion
Solidifies position in Air Potential tie into NGAD
Incumbency in high Access to DoD Labs/
and B-21
profile Flight Training DARPA Augment our offering for
Augments Land/Sea
Cleared workforce Ops (FTO) and FSXXI major programs
GBSD / SCARS entrée
Enhances solutions for (80%) key enabler for (Rotary)
to Space / Cyber
multi-domain ops next-gen platforms
WHAT L3HARRIS MILITARY TRAINING OFFERS
21 CAE Inc. Proprietary Information and/or ConfidentialDEFENCE & SECURITY
Adds balance to CAE, with complementary offerings in D&S
L3Harris Military Training provides greater balance to CAE overall, and is complementary to CAE D&S
Pro Forma Mix (FY20) Complementary Exposure in Critical Domains
Standalone CAE Pro Forma*
Domains
Military Training
AIR
Non-
Defence
Revenue Defence Defence Fast Jets
Non-Defence
Transport / Tanker
Rotary
Bombers
US
Revenue by US
Geography Non-US
Non-US GROUND
SEA
SPACE &
CYBER
* Non-GAAP and other financial measures (see Appendix)
22 CAE Inc. Proprietary Information and/or ConfidentialDEFENCE & SECURITY
Addressing new realities in the defence environment
The global threat environment and budget priorities are
Commercial flights and
accelerating demand for digital immersion solutions training utilization half their
usual levels
Focus has shifted from asymmetric to near-peer threats
Budget priorities driving shift from live training into cost- Market recovery expected
2024 for CAT (IATA). We
effective, virtual trainers expect earlier for BAT
Defence forces need to train in multi-domain operations using
immersive synthetic environments
The US National Defense Strategy (NDS) lays out priorities that address the
capabilities necessary to operate in this changing, multi-domain environment
These priorities are shared by our customers around the world
The acquisition enhances our ability to address these evolving needs
Source: CAE internal analysis
23 CAE Inc. Proprietary Information and/or ConfidentialHealthcare
HEALTHCARE

The global healthcare business

                  3500+
                  40+
                  Simulated clinical
                  experience                                                                                                             $1.3B
                  courseware
                   Countries  packages1                                                                                                  Revenue*

                  70+
                  50+
                  Platforms
                  Adjunct faculties, incl.
                   Reproduced
                                                                                                                                         $104.8M
                                                                                                                                         SOI*
                  nurses, physicians,
                  paramedics and
                  sonographers2

                  120+
                  80+
                  Sites                                                                                                                  7.9%
                  Countries with CAE-                                                                                                    Operating Margin*
                  provided training
                  solutions2

         Over 26,000
       ~US$1.7B
          operators                                                                                                                      9.3%
                                                                                                                                         ROCE*
      trained      annually
        CAE Est. Total Healthcare
            Simulation Market1
                                                                                                                                                      *FY2O

                                                                  Operations strategically located in key growth markets

1   Source: CAE FY20 annual report.   2   Source: CAE Q3 FY21 quarterly report.
25                                                                                CAE Inc. Proprietary Information and/or Confidential
HEALTHCARE
Market drivers
Demand Drivers
CAE's Healthcare
• Increasing investments in training to prevent medical errors segment is
positioned as a
• Refocus on disaster preparedness
leader in developing
• Chronic shortage of medical professionals / rising healthcare
enrollments in medical and nursing schools professionals
• Rising use of simulation in clinical training through technology,
educational content
• Greater acceptance of remote and virtual training delivery
methods
and training
• New training models and solutions to drive value-based care
26 CAE Inc. Proprietary Information and/or ConfidentialHEALTHCARE
Broad portfolio of high-tech training solutions
Imaging Simulation Interventional Simulation Patient Simulation
Vimedix Ultrasound Augmented Reality NeuroVR | EndoVR | CathLabVR
Blue Phantom Ultrasound Models LapVR | Surgical Cut Suits
Center Management Curriculum
Learning Space Standard and custom
Apollo | Athena | Lucina | Caesar | HPS | PediaSIM | BabySIM | Juno | Ares
Experience / Essentials / Enterprise Learning Modules
CAE Inc. Proprietary Information and/or ConfidentialCapital Allocation Strategy
CAPITAL ALLOCATION STRATEGY

CAE’s three capital allocation priorities

                                                                                                 Acquisitions
                                                                                                 involving existing capacity holders
                                                                                                 and capability holders to enhance
                                                                                                 CAE’s global offering and increase
                                                                                                 market addressability
                          Invest in
                         superior &
                         sustainable                                                             Organic capital investment
                           growth                                                                in capacity and to develop
                                                                                                 innovative capabilities to strengthen
                                                                                                 competitive moat and expand
                                                                                                 aperture to pursue greater
              Maintain              Provide                                                      addressable market
              a strong              current
              financial           shareholder
              position              returns                                                      Customer outsourcings
                                                                                                 mainly training for airlines seeking
                                                                                                 to improve efficiency and enhance
                                                                                                 their safety management programs

29                                        CAE Inc. Proprietary Information and/or Confidential
CAPITAL ALLOCATION PRIORITIES
Attractive compound growth
Incremental Pre-tax Return % on Organic Capital Deployed in Civil Training**
(FY17-FY21)
$578M+ organic
capital investment
from FY17-FY21 to
deploy 67+ FFSs*
within CAE’s Civil
commercial and
business aviation
training network
Organic growth capital deployed in Civil over the last five years has increased the base of
recurring revenues and has been highly accretive
*Non-GAAP and other financial measures
**Defined as the operating profit of the FFSs divided by the investment in FFSs* by year of deployment
30 CAE Inc. Proprietary Information and/or ConfidentialCAPITAL ALLOCATION STRATEGY
Strong free cash flow generation
$600 120%
115%
$500
110%
$400
105%
$300 100%
95%
$200
90%
$100
85%
$0 80%
FY18 FY19 FY20 FY21
Free Cash Flow* Net cash provided by operating activities FCF Conversion Rate*
* Non-GAAP and other financial measures (see Appendix)
31 CAE Inc. Proprietary Information and/or ConfidentialCAPITAL ALLOCATION STRATEGY
Maintain solid balance sheet while investing in accretive growth
$2.0B growth capital deployed, including
acquisition of Bombardier BAT Net Debt to
Millions
Capital %
$3 500 60,0%
$3 000
50,0%
$2 500
40,0%
$2 000
30,0%
$1 500
20,0%
$1 000
10,0%
$500
$0 0,0%
FY18** FY19** FY20 FY21
Net Debt* Debt Net Debt-to-Capital*
Track record of maintaining a solid financial position while deploying accretive growth capital
* Non-GAAP and other financial measures (see Appendix)
** Figures have not been restated to reflect the adoption of IFRS 16.
32 CAE Inc. Proprietary Information and/or ConfidentialSummary
Compelling secular growth story with exposure to the anticipated Aero recovery
Comprehensive solutions provider to industry-critical partners
Accelerated Defence strategy growth
Poised to capitalize on significant benefits from recent M&A
Proven track record of balanced, opportunistic capital deployment
Deep industry expertise and commitment to innovation
33 CAE Inc. Proprietary Information and/or ConfidentialAppendix
SELECT FINANCIAL HIGHLIGHTS

FY21 YTD select financial highlights
 Summary of Financial Highlights                                                                          Q1 FY21          Q2 FY21     Q3 FY21     Q4 FY21     YTD FY21
 (amounts in millions, except per share amounts, ROCE and book-to-sales)
 Revenue                                                                                                       $550.5        $704.7      $832.4       894.3      $2,981.9
 Operating (loss) income                                                                                       (110.3)          28.2        82.9        47.6        48.4
 Adjusted segment operating (loss) income*                                                                        (2.1)         79.3        97.2      106.2        280.6
 Adjusted SOI excluding COVID-19 government support programs*                                                   (46.5)          44.1        86.6        69.0       153.2
 Net (loss) income attributable to equity holders                                                              (110.6)         (5.2)        48.8        19.8       (47.2)
 Basic and diluted (loss) earnings per share (EPS)                                                              (0.42)        (0.02)        0.18        0.07       (0.17)
 Adjusted net income (loss)*                                                                                    (30.3)          34.2        60.0        63.2       127.1
 Adjusted EPS *                                                                                                 (0.11)          0.13        0.22        0.22        0.47
 Adjusted net income (loss) excluding COVID-19 government support programs*                                     (62.9)           8.4        52.2        35.9        33.6
 Adjusted EPS excluding COVID-19 government support programs*                                                   (0.24)          0.03        0.19        0.12        0.12
 Free cash flow*                                                                                               $(92.7)        $44.9      $224.0      $170.6       $346.8
 Net cash (used in) provided by operating activities                                                            (88.4)          45.6      234.8       174.6        366.6
 Capital employed*                                                                                           $4,746.8       $4,707.8    $4,680.8    $4,638.2
 Non-cash working capital*                                                                                       169.6        193.2       129.9         35.5
 Net debt*                                                                                                    2,407.5        2,358.9     1,819.9     1,425.4
 Total debt                                                                                                   2,770.8        2,616.9     2,439.8     2,351.5
 Return on capital employed (ROCE)*                                                                              5.3%          3.7%        2.7%        1.7%
 Adjusted ROCE*                                                                                                  8.0%          7.2%        6.4%        5.0%
 Total backlog*                                                                                              $8,550.9       $8,296.2    $7,820.1    $8,201.1
 Order intake*                                                                                                   417.1        667.8       710.7       927.9
 Book-to-sales ratio*                                                                                            0.76x        0.95x       0.85x       1.04x
 Book-to-sales ratio* for the last 12 months                                                                     0.99x        0.94x       0.84x        0.91x

* Non-GAAP and other financial measures (see Appendix)
35                                                                  CAE Inc. Proprietary Information and/or Confidential
Reconciliation of non-GAAP measures
 Reconciliation of adjusted segment operating income                                                                                                Q1 FY21               Q2 FY21                Q3 FY21               Q4 FY21             YTD FY21
 (amounts in millions)
 Operating (loss) income                                                                                                                                $(110.3)                  $28.2                  $82.9                $47.6                   $48.4
 Restructuring, integration and acquisition costs                                                                                                                    -              51.1                  14.3                  58.6                  124.0
 Impairments and other gains and losses incurred in relation to the COVID-19 pandemic(1)                                                                    108.2                       -                      -                     -                108.2
 Adjusted SOI                                                                                                                                               $(2.1)                $79.3                  $97.2               $106.2                 $280.6
 COVID-19 government support programs                                                                                                                         44.4                  35.2                  10.6                  37.2                  127.4
 Adjusted SOI excluding COVID-19 government support programs                                                                                              $(46.5)                 $44.1                  $86.6                $69.0                 $153.2

 Reconciliation of adjusted net income and adjusted earnings per share                                                                             Q1 FY21                Q2 FY21                Q3 FY21               Q4 FY21             YTD FY21
 (amounts in millions, except per share amounts)
 Net (loss) income attributable to equity holders of the Company                                                                                       $(110.6)                  $(5.2)                  $48.8                 $19.8                $(47.2)
 Restructuring, integration and acquisition costs, after tax                                                                                                     -                 39.4                    11.2                 43.4                   94.0
 Impairments and other gains and losses incurred in relation to the COVID-19 pandemic(1), after tax                                                         80.3                        -                       -                    -                 80.3
 Adjusted net (loss) income                                                                                                                              $(30.3)                 $34.2                   $60.0                 $63.2                $127.1
 COVID-19 government support programs                                                                                                                       32.6                   25.8                     7.8                 27.3                   93.5
 Adjusted net (loss) income SOI excluding COVID-19 government support programs                                                                           $(62.9)                   $8.4                  $52.2                 $35.9                  $33.6

 Average number of shares outstanding (diluted)                                                                                                            265.7                 265.8                   273.0                 287.3                  272.0

 Adjusted EPS                                                                                                                                            $(0.11)                 $0.13                   $0.22                 $0.22                  $0.47
 Adjusted EPS excluding COVID-19 government support programs                                                                                             $(0.24)                 $0.03                   $0.19                 $0.12                  $0.12
 (1) Mainly
          from impairment charges on non-financial assets and amounts owed from customers. This reconciling item does not adjust for any operational elements, including COVID-19 heightened employee costs. During the period, we carried higher employee
 costs than we would have otherwise been carrying as amounts received under COVID-19 government support programs either flowed through directly to employees according to the objective of the subsidy programs and the way they were designed in certain
 countries, or the amounts were offset by the increased costs we incurred in revoking some of our initial cost saving measures including eliminating salary reductions and bringing back employees who were previously placed on furlough or reduced work
 weeks. We also incurred additional operating costs including the purchase of personal protective equipment, increased sanitary measures to protect the health and safety of our employees and costs of safety protocols implemented. These higher costs have
 been included in our results. While these additional costs are in certain cases estimated, they almost entirely neutralize the positive impacts of the COVID-19 government support programs.

36                                                                                               CAE Inc. Proprietary Information and/or Confidential
Non-GAAP measure definitions Adjusted earnings or loss per share (EPS) Adjusted earnings or loss per share is a non-GAAP measure calculated by excluding restructuring, integration and acquisition costs, and impairments and other gains and losses arising from significant strategic transactions or material events, after tax, as well as significant one-time tax items from the diluted earnings per share from continuing operations attributable to equity holders of the Company. The effect per share is obtained by dividing these restructuring, integration and acquisition costs and other gains and losses, after tax, as well as one-time tax items by the average number of diluted shares. We track it because we believe it provides a better indication of our operating performance on a per share basis and facilitates the comparison across reporting periods. Adjusted earnings or loss per share excluding COVID-19 government support programs further excludes the impacts of government contributions related to COVID-19 support programs that were credited to income, after tax, but does not adjust for COVID-19 heightened operating costs that we have been carrying and that have been included in our results. Adjusted net income or loss Adjusted net income or loss is a non-GAAP measure we use as an alternate view of our operating results. We calculate it by taking our net income attributable to equity holders of the Company from continuing operations and excluding restructuring, integration and acquisition costs, and impairments and other gains and losses arising from significant strategic transactions or material events, after tax, as well as significant one-time tax items. We track it because we believe it provides a better indication of our operating performance and facilitates the comparison across reporting periods. Adjusted net income or loss excluding COVID-19 government support programs further excludes the impacts of government contributions related to COVID-19 support programs that were credited to income, after tax, but does not adjust for COVID-19 heightened operating costs that we have been carrying and that have been included in our results. Adjusted segment operating income or loss (SOI) Adjusted segment operating income or loss is a non-GAAP measure and is the sum of our key indicators of each segment’s financial performance. Adjusted segment operating income or loss gives us an indication of the profitability of each segment because it does not include the impact of any items not specifically related to the segment’s performance. We calculate adjusted segment operating income by taking operating income and excluding restructuring, integration and acquisition costs, and impairments and other gains and losses arising from significant strategic transactions or material events. We track it because we believe it provides a better indication of our operating performance and facilitates the comparison across reporting periods. Additionally, adjusted segment operating income or loss is the profitability measure employed by management for making decisions about allocating resources to segments and assessing segment performance. Adjusted segment operating income or loss excluding COVID-19 government support programs further excludes the impacts of government contributions related to COVID-19 support programs that were credited to income but does not adjust for COVID-19 heightened operating costs that we have been carrying and that have been included in our results. While management is aware of such further adjusted measure, it is not specifically employed by management as a profitability measure for making decisions about allocating resources to segments and assessing segment performance. Capital employed Capital employed Capital employed is a non-GAAP measure we use to evaluate and monitor how much we are investing in our business. We measure it from two perspectives: Capital used: For the Company as a whole, we take total assets (not including cash and cash equivalents), and subtract total liabilities (not including long-term debt and the current portion of long-term debt); For each segment, we take the total assets (not including cash and cash equivalents, tax accounts and other non-operating assets), and subtract total liabilities (not including tax accounts, long-term debt and the current portion of long-term debt, royalty obligations, employee benefit obligations and other non-operating liabilities). Source of capital: In order to understand our source of capital, we add net debt to total equity. For a reconciliation of this non-GAAP measure to the most directly comparable measure under GAAP, refer to section 9.1 “Consolidated capital employed” of the interim MD&A for the periods ending June 30, 2020, September 30, 2020 and December 31, 2020 (as filed on SEDAR (www.sedar.com) on August 12, 2020, November 10, 2020 and February 12, 2021, respectively), as well as section 7.1 “Consolidated capital employed” of the financial report for the years ended March 31, 2018, March 31, 2019, March 31, 2020 and March 31, 2021 (as filed on SEDAR (www.sedar.com) on May 25, 2018 , May 17, 2019, May 22, 2020, and May 19, 2021 respectively), which sections are specifically incorporated by reference into this presentation. Return on capital employed (ROCE) ROCE is used to evaluate the profitability of our invested capital. We calculate this ratio over a rolling four-quarter period by taking net income attributable to equity holders of the Company excluding net finance expense, after tax, divided by the average capital employed. 37 CAE Inc. Proprietary Information and/or Confidential
Non-GAAP measure definitions
EBITDA
EBITDA comprises earnings before income taxes, finance expense – net, depreciation and amortization. EBITDA margin in D&S is defined as the EBITDA of the Defense and Security segment expressed as a percentage of the Defense and Security revenues.

EBITDA of L3Harris Military Training business comprises earnings before income taxes, finance expense – net, depreciation and amortization. Adjusted EBITDA of L3Harris Military Training business is calculated as EBITDA from L3Harris Military Training, after giving effect
to the Acquisition and Acquisition related adjustments from sales type leases accounted for under US GAAP and estimated standalone costs.

Free cash flow
Free cash flow is a non-GAAP measure that shows us how much cash we have available to invest in growth opportunities, repay debt and meet ongoing financial obligations. We use it as an indicator of our financial strength and liquidity. We calculate it by taking the net
cash generated by our continuing operating activities, subtracting maintenance capital expenditures, investment in other assets not related to growth and dividends paid and adding proceeds from the disposal of property, plant and equipment, dividends received from equity
accounted investees and proceeds, net of payments, from equity accounted investees. For a reconciliation of this non-GAAP measure to the most directly comparable measure under GAAP, refer to section 8.1 “Consolidated cash movements” of the interim MD&A for the
periods ending June 30, 2020, September 30, 2020 and December 31, 2020 (as filed on SEDAR (www.sedar.com) on August 12, 2020, November 10, 2020 and February 12, 2021, respectively), as well as section 6.1 “Consolidated cash movements” of the financial report
for the years ended March 31, 2018, March 31, 2019, March 31, 2020 and March 31, 2021 (as filed on SEDAR (www.sedar.com) on May 25, 2018 , May 17, 2019, May 22, 2020, and May 19, 2021 respectively), which sections are specifically incorporated by reference into
this presentation.

Cash conversion rate
Cash conversion rate is a non-GAAP measure we use to assess our performance in cash flow generation and as a basis for evaluating our capitalization structure. We calculate it by dividing free cash flow by adjusted net income or loss

Full-flight simulators (FFSs) in CAE's network
A FFS is a full-size replica of a specific make, model and series of an aircraft cockpit, including a motion system. In our count of FFSs in the network, we generally only include FFSs that are of the highest fidelity and do not include any fixed based training devices, or other
lower-level devices, as these are typically used in addition to FFSs in the same approved training programs.

Net debt
Net debt is a non-GAAP measure we use to monitor how much debt we have after taking into account cash and cash equivalents. We use it as an indicator of our overall financial position, and calculate it by taking our total long-term debt, including the current portion of long-
term debt, and subtracting cash and cash equivalents. Net debt-to-capital is calculated as net debt divided by the sum of total equity plus net debt. For a reconciliation of this non-GAAP measure to the most directly comparable measure under GAAP, refer to section 9.1
“Consolidated capital employed” of the interim MD&A for the periods ending June 30, 2020, September 30, 2020 and December 31, 2020 (as filed on SEDAR (www.sedar.com) on August 12, 2020, November 10, 2020 and February 12, 2021, respectively), as well as section
7.1 “Consolidated capital employed” of the financial report for the years ended March 31, 2018, March 31, 2019, March 31, 2020 and March 31, 2021 (as filed on SEDAR (www.sedar.com) on May 25, 2018 , May 17, 2019, May 22, 2020, and May 19, 2021 respectively),
which sections are specifically incorporated by reference into this presentation.

Non-cash working capital
Non-cash working capital is a non-GAAP measure we use to monitor how much money we have committed in the day-to-day operation of our business. We calculate it by taking current assets (not including cash and cash equivalents and assets held for sale) and
subtracting current liabilities (not including the current portion of long-term debt and liabilities held for sale). For a reconciliation of this non-GAAP measure to the most directly comparable measure under GAAP, refer to section 9.1 “Consolidated capital employed” of the
interim MD&A for the periods ending June 30, 2020, September 30, 2020 and December 31, 2020 (as filed on SEDAR (www.sedar.com) on August 12, 2020, November 10, 2020 and February 12, 2021, respectively), as well as section 7.1 “Consolidated capital employed”
of the financial report for the year ended March 31, 2021 (as filed on SEDAR (www.sedar.com) on May 19, 2021), which sections are specifically incorporated by reference into this presentation.

Operating income or loss
Operating income or loss is an additional GAAP measure that shows us how we have performed before the effects of certain financing decisions, tax structures and discontinued operations. We track it because we believe it facilitates the comparison across reporting
periods, and with companies and industries that do not have the same capital structure or tax laws.

38                                                                                                          CAE Inc. Proprietary Information and/or Confidential
Non-GAAP measure definitions
Order intake and Backlog
Order intake
Order intake is a non-GAAP measure that represents the expected value of orders we have received:
For the Civil Aviation Training Solutions segment, we consider an item part of our order intake when we have a legally binding commercial agreement with a client that includes enough detail about each party’s obligations to form the basis for a contract. Additionally,
expected future revenues from customers under short-term and long-term training contracts are included when these customers commit to pay us training fees, or when we reasonably expect the revenue to be generated;
For the Defence and Security segment, we consider an item part of our order intake when we have a legally binding commercial agreement with a client that includes enough detail about each party’s obligations to form the basis for a contract. Defence and Security
contracts are usually executed over a long-term period but some of them must be renewed each year. For this segment, we only include a contract item in order intake when the customer has authorized the contract item and has received funding for it;
For the Healthcare segment, order intake is typically converted into revenue within one year, therefore we assume that order intake is equal to revenue.
The book-to-sales ratio is the total orders divided by total revenue in a given period.
Backlog
Total backlog is a non-GAAP measure that represents expected future revenues and includes obligated backlog, joint venture backlog and unfunded backlog and options:
Obligated backlog represents the value of our order intake not yet executed and is calculated by adding the order intake of the current period to the balance of the obligated backlog at the end of the previous fiscal year, subtracting the revenue recognized in the current
period and adding or subtracting backlog adjustments. If the amount of an order already recognized in a previous fiscal year is modified, the backlog is revised through adjustments;
Joint venture backlog is obligated backlog that represents the expected value of our share of orders that our joint ventures have received but have not yet executed. Joint venture backlog is determined on the same basis as obligated backlog described above;
Unfunded backlog represents firm Defence and Security orders we have received but have not yet executed and for which funding authorization has not yet been obtained. Options are included in backlog when there is a high probability of being exercised, but
indefinite-delivery/indefinite-quantity (ID/IQ) contracts are excluded. When an option is exercised, it is considered order intake in that period and it is removed from unfunded backlog and options.
For a reconciliation of this non-GAAP measure to the most directly comparable measure under GAAP, refer to Section 4.3 “Consolidated orders and total backlog” of the financial report for the years ended March 31, 2019, March 31, 2020 and March 31, 2021 (as filed on
SEDAR (www.sedar.com) on May 17, 2019, May 22, 2020, and May 19, 2021, respectively), which sections are specifically incorporated by reference into this presentation.
Other
The following non-IFRS measures are also used by the Company in this presentation and defined as follows:
Accretion is defined as the expected change in CAE’s EPS after giving effect to the Acquisition.
Pro forma revenue is defined as revenue as if the revenues of L3Harris Military Training were included for the entire period. Pro forma revenue does not have a standardized meaning under IFRS; accordingly, it may not be comparable to similarly named measures used by
other companies. Investors should not view pro forma revenue as an alternative measure to, for example, revenue, which is an IFRS measure.
39 CAE Inc. Proprietary Information and/or ConfidentialThank you!
You can also read