INVESTOR PRESENTATION - Lithia Investor Relations
←
→
Page content transcription
If your browser does not render page correctly, please read the page content below

INVESTOR
          PRESENTATION

          JULY 2021
1   NYSE:LAD
DISCLOSURE
    Forward-Looking Statements
    Certain statements in this presentation, and at times made by our officers and representatives, constitute forward-looking statements within the meaning of the "Safe Harbor" provisions of the Private Securities Litigation Reform
    Act of 1995. Generally, you can identify forward-looking statements by terms such as "project", "outlook", "target", "may", "will", "would", "should", "seek", "expect", "plan", "intend", "forecast", "anticipate", "believe", "estimate",
    "predict", "potential", "likely", "goal", "strategy", "future", "maintain", and "continue" or the negative of these terms orother comparable terms. Examples of forward-looking statements in this presentation include, among
    others, statements regarding:
        ▪ Future market conditions, including anticipated car sales levels;
        ▪ Anticipated impacts of the continued COVID-19 pandemic on the U.S. and local economies in which we operate, our business operations and consumer demand;
        ▪ Continuation of our sales and services, including in-store appointments and home deliveries;
        ▪ Expected growth from our e-commerce home solutions and digital strategies;
        ▪ Expected operating results, such as improved store performance; continued improvement of selling, general and administrative expenses ("SG&A") as a percentage of gross profit and all projections;
        ▪ Anticipated integration, success and growth of acquired stores;
        ▪ Anticipated ability to capture additional market share;
        ▪ Anticipated ability to find accretive acquisitions;
        ▪ Expected revenues from acquired stores;
        ▪ Anticipated synergies, ability to monetize our investment in digital innovation;
        ▪ Anticipated additions of dealership locations to our portfolio in the future;
        ▪ Anticipated financial condition and liquidity, including from our cash, availability on our credit facility and unfinanced real estate;
        ▪ Anticipated use of proceeds from our financings;
        ▪ Anticipated allocations, uses and levels of capital expenditures in the future;
        ▪ Expectations regarding compliance with financial and restrictive covenants in our credit facility and other debt agreements;
        ▪ Statements regarding furloughed employees and cost reductions;
        ▪ Expectations regarding programs and initiatives for employee recruitment, training, and retention; and
        ▪ Our strategies for customer retention, growth, market position, financial results and risk management.
    Because forward-looking statements relate to the future, they are subject to inherent uncertainties, risks and changes in circumstances that are difficult to predict and many of which are outside of our control. Forward-looking
    statements are not guarantees of future performance, and our actual results of operations, financial condition and liquidityand development of the industry in which we operate may differ materially from those made in or
    suggested by the forward-looking statements in this presentation. Therefore, you should not rely on any of these forward-looking statements. The risks and uncertainties that could cause actual results to differ materially from
    estimated or projected results include, without limitation:
        ▪ Future economic and financial conditions (both nationally and locally], including as a result of the COVID-19 pandemic;
        ▪ Changes in customer demand, our relationship with, and the financial and operational stability of, vehicle manufacturers and other suppliers;
        ▪ Risks associated with our indebtedness (including available borrowing capacity, compliance with financial covenants and ability to refinance or repay indebtedness on favorable terms);
        ▪ The adequacy of our cash flow and earnings and other conditions which may affect our ability to pay our quarterly dividend at the planned level;
        ▪ Disruptions to our technology network including computer systems and software, as well as natural events such as severe weather, fires, floods and earthquakes or man-made or other disruptions of our operating systems, structures, facilities or
             equipment; and
        ▪ Government regulations and legislation, and other risks set forth throughout "Part 11, Item 7. Management's Discussion and Analysis of Financial Condition and Results of Operations" and in "Part I, Item 1A.
             Risk Factors" of our most recent Annual Report on Form 10-K and in “Part II, Item 1A. Risk Factors” of our Quarterly Reports on Form 10-Q, and from time to time in our other filings with the SEC.
    Any forward-looking statement made by us in this presentation is based only on information currently available to us and speaks only as of the date on which it is made. Except as required by law, we undertake no obligation to
    publicly update any forward-looking statement, whether written or oral, that may be made from time to time, whether as a result of new information, future developments or otherwise.
    Non-GAAP Financial Measures
    This presentation contains non-GAAP financial measures such as adjusted net income and diluted earnings per share, adjusted SG&A as a percentage of revenue and gross profit, adjusted operating margin, adjusting operating profit as a percentage of
    revenue and gross profit, adjusted pre-tax margin and net profit margin, EBITDA, adjusted EBITDA, leveraged EBITDA and adjusted total debt. Non-GAAP measures do not have definitions under GAAP and may be defined differently by and not
    comparable to similarly titled measures used by other companies. As a result, we review any non-GAAP financial measures in connection with a review of the most directly comparable measures calculated in accordance with GAAP. We caution you not
    to place undue reliance on such non-GAAP measures, but also to consider them with the most directly comparable GAAP measures. We present cash flows from operations in the attached tables, adjusted to include the change in non-trade floor plan
    debt to improve the visibility of cash flows related to vehicle financing. As required by SEC rules, we have reconciled thesemeasures to the most directly comparable GAAP measures in the attachments to this release. We believe the non-GAAP financial
    measures we present improve the transparency of our disclosures; provide a meaningful presentation of our results from core business operations, because they exclude items not related to core business operations and other non-cash
    items; and improve the period-to-period comparability of our results from core business operations. These presentations should not be considered an alternative to GAAP measures.

2     NYSE:LAD
LITHIA &                                          ▪ Diverse synergistic portfolio of businesses
                                                         ▪ Complete ownership lifecycle attachment
                                                         ▪ 100% participation in $2 trillion market
       DRIVEWAY
       The pragmatic disruptor, with a                   ▪   #231 in 2021
       proven multifaceted success strategy,             ▪   #12 10-year revenue growth, 20% CAGR*
                                                         ▪   #3 10-year Total Shareholder Return, 37% CAGR*
       uniquely and competitively leading the
                                                         ▪   #2 10-year EPS Growth, 43% CAGR*
       modernization of personal transportation
       by providing consumers solutions wherever,
       whenever, and however they desire.                ▪ 100% national coverage
                                                         ▪ Proven expansion execution
       NYSE: LAD                                         ▪ Highly profitable with significant cash flows

    * 10-year CAGRs and TSR through December 31, 2020.

3   NYSE:LAD
KEY STRATEGIC HIGHLIGHTS
    $50 billion in revenues, $50 EPS in 5 years

            Largest Retail Industry                 Omni-channel Approach               Data and Innovation
               in Early Innings of                 Combination of E-commerce        Creates Unique Opportunities to
               Consolidation and                  Home Solutions and Expansive      Capitalize on Innovation of New
                 Modernization                       Physical Network with              Products and Services
                                                          Adjacencies

              Customer-Centric                     Proven M&A Track Record          Growth, Scale, and Profitability
         Business Model with Solutions             of Valuation Creation Driving   Operational Excellence, Significant
           Throughout the Consumer                       Continued Scale             Competitive Advantages, and
                   Lifecycle                                                         Considerable Barriers to Entry

4    NYSE:LAD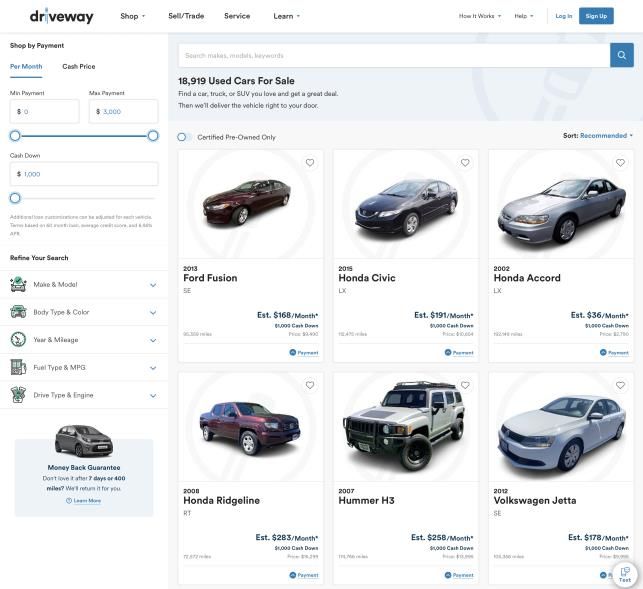
FRAGMENTED $2 TRILLION REVENUE INDUSTRY
     Maximizes Addressable Market

                                                                                                        TRADITIONAL                                           PUBLIC USED
                                                                                                       NEW FRANCHISE                                           ONLY AUTO
                                                                                                         RETAILERS                                             RETAILERS                                                                  Greater gross profit
                                                                                                                                                                                                                                          opportunities allowing
                            $2,000               ~$2.0T                                                                                                                                               $400
                                                                                                                                                                                                                                          for maximum
                            $1,750
                                                                     ~$350B
                                                   $400B
                                                                                                                                                                                                                                          flexibility.

                                                                                                                                                                                                              GROSS PROFT (in billions)
                            $1,500                                                                                                                                                                    $300
    REVENUE (in billions)

                            $1,250                                     $175B                                                                                                                                                              ▪ ~$350B industry
                                                   $700B                                                $200B

                            $1,000                                                                                                                                                                    $200                                  gross profit
                             $750
                                                                                                                            $100B                                                                                                           opportunity
                                                                                                                                                                                                                                          ▪ Largest participant
                                                                       $60B                             $700B

                             $500                                                                                                                                                                     $100
                                                   $800B                                                                    $60B
PROFITABLY MODERNIZING AN INDUSTRY
    $50 billion in revenues, $50 EPS in 5 years

                                                                     LAD
                                                  ▪   Addresses 100% of ~$2 trillion market
                      LITHIA                                                                                DRIVEWAY
                                                  ▪   Products and services throughout the
    ▪     Inventory – top of funnel                   customer lifecycle                       ▪   Innovation – activating the network
          procurement and broadest selection,                                                      through proprietary digital solutions
          over 57,000 vehicles in inventory       ▪   Meets customers at store or in-home
                                                                                               ▪   Transparency – negotiation-free
    ▪     Personnel - leveraging expertise        ▪   Creating value and loyalty with 7            pricing and visibility
                                                      million paying customers
    ▪     Facilities - 100% of consumers                                                       ▪   Affordability – vast selection and
          within a 400-mile radius                ▪   Vertical and horizontal adjacencies          tools to empower customers
    ▪     Growth opportunity – acquiring          ▪   Hard-to-replicate design and             ▪   Convenience – incorporating data
          accretive businesses                        execution                                    science to create a simple,
    ▪     Profit engine – organically             ▪   Synergistic business lines                   personalized customer experience
          generating $1B+ in EBITDA annually      ▪   Competitively positioned with barriers
                                                      to entry
6       NYSE:LAD
LEVERAGING DATA TO CREATE LIFETIME LOYALTY
    A history of utilizing data to innovate products and services

                                                           75 Years
                                                          of Relationships and
                                                            Transaction Data

                                                                                    Subscription    Tailored
                                                        2.5 million+                 Services      Financing
                                                          Vehicles Sold in the
                                                            Past 10 Years
       VEHICLE
      OWNERSHIP
             DATA                                           DATA                        LOYALTY
      LIFECYCLE
                                                          7 million
                                                           Paying Customer
                                                        Transactions Per Year     Personalized      Optimized
                                                       Through 4 Business Lines
                                                                                   Marketing        Inventory
                                                                                                   Procurement
                                                                15x
                                                             Greater Brand
                                                         Impressions than Used
                                                           Only Auto Retailers           Convenience
                                                                                          Optionality
7    NYSE:LAD
CONSUMERS’ NEEDS VARY AND SELECTION MATTERS
    Solutions to meet needs requires expertise and flexibility

           Do-it-Yourselfer                             Building Credit                            Relationship Builder                     Selection Driven
        Desires to transact online                Re-establishing or little credit          Values lifetime personal relationship        Influenced by selection not
            from their home                           48% below 720 FICO                        over the ownership lifecycle                    sales process
      83% desire to start online                                                                   62% want relationship               30% unsuccessful because
                                                                                                       with Dealer                     desired vehicle not in stock

                                   Upside Down                                   Private Seller                     Financially Independent
                         Owes more on vehicle than worth,             Want to sell car themselves but need           Selectively takes advantage
                           lacks cash down, affects LTV                 help with title, loan pay-off, etc.          of offers and can pay cash
                      70% with $5,100 avg. negative equity                      28% private sales                  22% pay cash/own financing

    Sources: Cox 2020 Reimaging the Consumer Experience, NADA, JD Power, Lithia Motors historical sales data
8     NYSE:LAD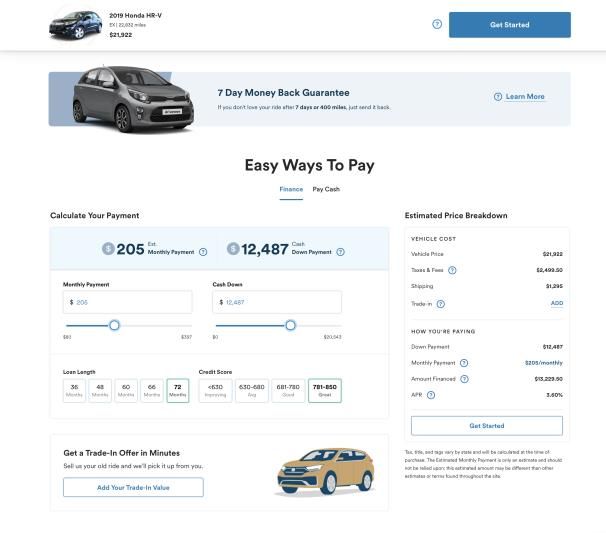
DRIVEWAY
    Flexible, empowered, convenient, and transparent

                                                                         SHOP
                                                                      ✓ Selection of ~30,000 new and used vehicles
                                                                      ✓ Negotiation-free pricing, 7-day money-back guarantee, in-home delivery
                                                                      ✓ Nationwide lender network of 180+
                                 Intuitive
                              technologies

                                                                         SELL/TRADE
                                                                      ✓ Instant cash offer
                                                                      ✓ Home pickup
    Nation-wide valets                             Negotiation-free
     to your driveway                                                 ✓ Immediate payment

                                                                         SERVICE
                                                                      ✓ Home pickup & drop-off
                                                                      ✓ Free loaner vehicles
                                                                      ✓ 3-year/50,000-mile warranty on parts
            Friendly experienced,       Shop. Sell. Service.
                                                                      See early learnings in appendix
                support team

9    NYSE:LAD
PROVEN M&A STRATEGY DRIVING GROWTH
         Decades of successfully integrating acquisitions

         ESTIMATED ANNUALIZED REVENUES ACQUIRED 1 ($B)                                                                                                                             CAPITAL ENGINE
                                                                                                                                                                    ▪   Available funds of $3.0B representing ability
                                                                                                                                                                        to purchase $12.0B in annualized revenues
         $5,000
         $4,500
                                                                                            $4,465                                                                  ▪   Annual free cash flow2 generation of $700M
                                                                                                            $4,000E $4,000E $4,000E                                     for continued investment
         $4,000
                                                                           $3,500                                                                                   ▪   Disciplined capital management targeting 2x
         $3,500
                                                                                                                                                                        to 3x leverage
         $3,000
         $2,500
         $2,000          $1,745
                                          $1,545                                                                                                                             DISCIPLINED INVESTING
         $1,500
                                                            $825
                                                                                                                                                                    ▪   15% to 30% of Revenue
         $1,000
                                                                                                                                                                    ▪   3x to 7x EBITDA
           $500
               $0
                                                                                                                                                                    ▪   15% to 25% After-tax return on investment
                          2017             2018             2019             2020         2021 YTD             2022             2023             2024               ▪   Expansion of physical network
                                                                                                                                                                    ▪   Diversification of product offerings
                                                                                                                                                                    ▪   Acquisition of talent
1Annual revenue numbers represent the anticipated steady-state revenue level of the dealerships acquired.
2Free cash flow is defined as adjusted EBITDA plus stock-based compensation, less the following items paid in cash: interest, income taxes, dividends and capital
expenditures

    10       NYSE:LAD
FIVE YEAR MODEL
Our plan builds upon our strengths
YEAR 1 ACHIEVEMENTS
REVENUE EBITDA EPS
CAGR: 31% CAGR: 37% CAGR: 34% Generated adjusted EBITDA
of $1.3 billion and EPS
of $25.791
$50B $50.20
Acquired 40% of
$9B $2.6B $10.40
targeted $20 billion in
revenues; expected to
$0.4B contribute $315 million in
annualized EBITDA
$17.50
$22B
Driveway offerings nation-
$1.2B
wide including new vehicles,
used vehicles and service
Driveway Finance portfolio
$22.30 grows to $370 million
$19B $1.0B
$13B $11.76
$0.5B
BASE YEAR 52 BASE YEAR 5 BASE YEAR 5
CORE NETWORK EXPANSION DRIVEWAY
Note: Base year represents FY 2019
1 TTM adjusted EBITDA and EPS as of June 30, 2021
2 Year 5 network development revenues represent $20 billion in acquired revenues and organic growth post -acquisition
11 NYSE:LADPROFITABLY MODERNIZING AN INDUSTRY
We are a growth company powered by people and innovation with a 5-Year Plan to profitably consolidate
the largest retail sector in the country. By providing a wide array of products and services for the entire
vehicle ownership lifecycle through various consumer channels, we build magnetic brand loyalty.
Operational excellence is achieved by focusing the business on convenient and transparent consumer
experiences supported by proprietary data science to increase market share, consumer loyalty and
profitability. Our omni-channel strategy will continue to pragmatically disrupt the industry by leveraging
experienced teams, vast owned inventories, technology, and physical network. Continuing to lead the
industry’s consolidation and Driveway’s e-commerce in-home experiences further accelerates the massive
regenerating capital engine. Together, these endeavors create a unique and compelling high-growth strategy
that provides transportation solutions wherever, whenever, and however consumers desire.
Invest in Lithia & Driveway the leader with a proven success strategy.
12 NYSE:LADAPPENDIX 13 NYSE:LAD
FUN FACTS
     Lithia consumers and performance

     INVENTORY DAYS SUPPLY

                                                                       80%+                        ACQUISITION

                                   USED
     23 58 900
                 NEW
                                                     PROCUREMENT
                                                     PERSONNEL                                     SUCCESS RATE
     INVENTORY SCARCITY - LAD                                                                                 IN

                                                                                                   13%
                                                                         4
                                                                                                              HOME

                                                     VALUE
                                                             17%
                            CORE

           21%                      62%
     CPO

                                                                                                              SERVICE
                                                                                                              37 locations

     INVENTORY SCARCITY - MARKET

                                                     VALUE
                                                             62%
                                                                       BUSINESS
                                                                                                   2AVERAGE
                                                                                                    ANNUAL
                            CORE

           9%                        29%
     CPO

                                                                       LINES                        SERVICE VISITS
                                                                       New, Used, Service, Parts

     INVENTORY SOURCES                                                 5%                SUSTAINABLE
                                                                                         UNITS

     57%
     Trade-in
                       14%
                       Auction
                                          21%                8%        80%+ PURCHASES STARTED ONLINE
                                          Fleet, Rental,     Private
                                          Dealers            Party     180 LENDERS
14    NYSE:LAD
CLEAR PATHWAY FOR DRIVEWAY
On target to achieve a run-rate of 15,000 Driveway shop and sell transactions by year-end
EARLY LEARNINGS
QTD increase in Monthly Unique
+190% Visitors ▪ 550 transactions in the month of June
Organic traffic growth between Q4
+140% 2020 and Q1 2021
▪ 97.5% of Driveway customers during Q2 2021 were
incremental and had never done business with a
Lithia dealership before
+587% QTD increase in leads
▪ Only 15% of all credit decisions are auto approved.
Overwhelming majority still require help from Driveway
Care Center
Average Google review score out
4.98 Average
of 5 starsGoogle review score out ▪ Average shipping distance is 943 miles with an
4.98 of 5 stars average shipping fee of $561
▪ Average Driveway Finance FICO score of 669, 48
points lower than the average Lithia customer.
QTD Increase in Driveway Finance
+40% originations
15 NYSE:LADNETWORK COST TO REVENUE COMPARISON
Lower cost network with higher margin businesses
Year ended 12/31/2020 Year ended 12/31/2020 Year ended 2/28/2021
Source: Lithia management and company filings
16 NYSE:LADDRIVEWAY
Enhanced shopping experience with affordability and AI financing guidance features
▪ Shop by payment -
Empowers consumers to
shop by payment and
addresses their concerns
about affordability
▪ Budget and payment
calculator – empowers
customers to transparently
explore cost and payment
options
▪ AI-based feedback -
Guides consumers to deal
structures that will increase
likelihood of credit being
approved
17 NYSE:LADLITHIA’S TRAJECTORY AND ROADMAP
2017 2019 2020
Adds $500mm in revenues with Acquires $1B in revenues and 2021
Launches national brand, Acquires $4.5B in revenues
Baierl acquisition and enters enters Southeast; nationwide Driveway, providing and adds massive platform
Pennsylvania reach to 92% of the population ecommerce digital home to North Central Region
solutions nationwide
Acquires DTLA, $1B in revenues; Reorganizes and elevates key
Expands presence in Southern personnel to support growth Completes first year of 5-Year
Driveway enables ability to Plan with 40% of targeted
California schedule service online with revenue acquired,
Launches proprietary technology in-home pickup and delivery
Solidifies vision of how to profitably under Baierl.com name outperformance on core
and end-to-end buying business and strong early
modernize the industry through experience with financing
omni-channel solutions indicators on Driveway
APIs from 29 lenders
2017 2018 2019 2020 2021
2018 2020 2021
Adds $1.3B in revenues with Acquires $3.5B in revenues Driveway brand marketing
acquisition of Day Automotive with acquisition of John launches in major metro
and Prestige Eagle, Sterling, Keyes markets, reaching over 25%
increasing nationwide reach of population
Makes key hires to lay to 100% of the population
groundwork and begin Enhances Driveway platform
innovating on technology Launches a fintech solution with shop by monthly
underlying 5-Year Plan with Driveway Finance payment functionality, budget
and payment calculator, and
Invests in Shift Technologies, AI-powered engine to predict
an e-commerce auto retailer likelihood of credit approval
Organization Design
Network Dev elopment
Modernization
18 NYSE:LADREGIONAL REACH & DENSITY MAP
90% Reach, 100-mile Density
90% Reach, 300-mile Density
90% Reach, 400-mile Density
19 NYSE:LADQ2’21 INCOME STATEMENT SUMMARY
Q2 2021 HIGHLIGHTS
TOTAL GROSS PROFIT ADJUSTED SG&A ADJUSTED
▪ Increased total revenue and PER UNIT TO GROSS PROFIT EPS
gross profit by 26% and
53%, respectively, over 2019
▪ Increased adjusted earnings $5,723 71.3% $11.12
per share by 277% $2.95
$5,050 55.7%
▪ Improved adjusted SG&A to Q2 2019 Q2 2021 Q2 2019 Q2 2021 Q2 2019 Q2 2021
gross profit by 1,560 bps
SAME STORE QUARTER-OVER-QUARTER COMPARISON VS. Q2 2019
▪ Increased new and used
same store unit sales by 6% REVENUE GROSS PROFIT
and 20% respectively New Vehicles 20% 114%
Used Retail Vehicles 49% 88%
F&I 39% 39%
Service, Parts & Body 3% 11%
TOTAL 26% 53%
20 NYSE:LADSTRONG BALANCE SHEET
Allows Us to Capitalize on Opportunities in an Evolving Environment
HISTORICAL NET LEVERAGE1 TARGET USES OF CAPITAL
Proven Ability to Delever Maximizing shareholder value
Internal Investment &
Target leverage range: 2-3x Modernization 25%
Actual 5-year average: 17%
2.2x
2.0x Share Repurchases 5%
1.9x Actual 5-year average: 11%
1.8x
1.5x
1.3x 1.3x
Dividends 5%
Actual 5-year average: 4%
Acquisitions 65%
2015 2016 2017 2018 2019 2020 2Q2021 Actual 5-year average: 68%
1 Please refer to appendix for calculation of net leverage, defined as Net debt / Adjusted EBITDA
21 NYSE:LADSUPPLEMENTAL INFORMATION
2021 Quarterly Income statement
$M Q4 Q3 Q2 Q1 2021
New Vehicle $3,146.2 $2,193.2 $5,339.5
Used Vehicle 1,804.9 1,352.2 3,157.0
Wholesale Used Vehicles 217.4 135.2 352.6
Finance and Insurance 269.6 198.4 467.9
Service Body and Parts 521.0 404.0 925.0
Fleet and Other 50.3 60.0 110.4
Total Revenues $6,009.4 $4,343.0 $10,352.4
New Vehicle 313.7 156.7 470.5
Used Vehicle 232.6 136.2 368.7
Wholesale Used Vehicles 16.4 4.6 21.0
Finance and Insurance 269.6 198.4 467.9
Service Body and Parts 278.1 218.3 496.5
Fleet and Other 0.2 1.3 1.5
Gross Profit $1,110.6 $715.5 $1,826.1
Asset lmpairments – – –
SG&A 634.0 450.4 1,084.2
Depreciation and Amortization 30.3 26.8 57.2
Operating Income $446.3 $238.3 $684.7
Floor Plan Interest Expense (6.4) (6.8) (13.3)
Other Interest Expense (28.1) (23.5) (51.6)
Other (income) Expense Net 7.6 3.4 11.1
Income (loss) before Taxes $419.4 $211.4 $630.9
Income Tax Expense (114.5) (55.2) (169.8)
Net Income $304.9 $156.2 $461.1
* Sum of QTD may not equal YTD due to rounding
22 NYSE:LADRESILIENT BUSINESS MODEL
Profitable business with diversified brand mix, geographic mix and multiple earnings streams
BUSINESS MIX LITHIA NEW VEHICLE MIX
New and Used Gross Profit includes F&I
Segment Segment % Brand Brand Revenue % Brand Unit Sales
Toy ota 15% 18%
9% Honda 15% 21%
25% Subaru 6% 9%
Import 43%
Hy undai 2% 2%
Nissan 2% 3%
36%
Other Imports 3% 3%
Chry sler 17% 14%
34%
Domestic 32% GM 8% 7%
Ford 7% 6%
BMW/Mini 7% 6%
55%
Mercedes 5% 3%
41%
Lexus 3% 2%
Audi 3% 2%
Luxury 25%
Acura 3% 3%
Revenue Gross Profit
Porsche 2% 1%
New Vehicles Used Vehicles Parts & Serv ice
Jaguar/Land Rov er 1%EARNINGS OPPORTUNITIES
Acquire strong brands and grow profits
PRE-ACQUISITION TARGET
24 NYSE:LADSUPPLEMENTAL INFORMATION
2021 Adjusted non-GAAP reconciliation
YTD Net Disposal Loss on Investment Loss Insurance Acquisition YTD
6/30/21 Sale of Stores (Gain) Reserves Expenses 6/30/21
$M, except for per share amounts As Reported Q1 Q2 Q1 Q2 Q1 Q2 Q1 Q2 Adjusted
$1,084.2 $(0.7) $(4.5) $– $(0.8) $(0.8) $(1.3) $(10.4) $1,065.8
Selling, General and Administrativ e
684.7 0.7 4.5 – 0.8 0.8 1.3 10.4 703.1
Income f rom Operations
11.1 – – 0.3 (1.2) – – – 10.1
Other Income (Expense), Net
Income f rom Continuing Operations bef ore 630.9 0.7 4.5 0.3 (1.2) 0.8 0.8 1.3 10.4 648.3
Income Taxes
(169.8) (0.2) (1.2) (0.1) 0.3 (0.2) (0.2) (0.4) (2.8) (174.4)
Income Taxes
$461.1 0.5 3.3 0.2 (0.9) 0.6 0.6 0.9 7.6 $473.9
Net Income
$16.69 0.02 0.12 0.00 (0.03) 0.02 0.02 0.05 0.26 $17.15
Diluted Net Income per Share
27.6
Diluted Share Count
25 NYSE:LADSUPPLEMENTAL INFORMATION
2020 Quarterly Income statement
$M Q4 Q3 Q2 Q1 2020
New Vehicle $2,149.4 $1,883.3 $1,367.8 $1,373.5 $6,773.9
Used Vehicle 1,108.7 1,093.2 922.2 874.4 3,998.4
Wholesale Used Vehicles 91.8 98.8 51.3 66.7 308.7
Finance and Insurance 172.6 160.5 124.9 121.9 579.8
Service Body and Parts 383.9 359.5 275.5 329.9 1,348.7
Fleet and Other 35.4 24.9 16.9 37.4 114.8
Total Revenues $3,941.8 $3,620.2 $2,758.6 $2,803.8 $13,124.3
New Vehicle 150.6 140.1 92.2 78.2 460.9
Used Vehicle 113.0 144.8 98.3 90.0 446.0
Wholesale Used Vehicles 1.6 7.6 2.1 0.6 12.0
Finance and Insurance 172.6 160.5 124.9 121.9 579.8
Service Body and Parts 208.4 195.9 144.4 168.1 716.8
Fleet and Other 2.5 2.7 2.5 2.1 10.1
Gross Profit $648.7 $651.6 $464.4 $460.9 $2,225.6
Asset lmpairments – – 7.9 – 7.9
SG&A 388.6 389.1 304.5 346.0 1,428.3
Depreciation and Amortization 25.2 22.9 22.3 22.0 92.3
Operating Income $234.9 $239.6 $129.7 $92.9 $697.1
Floor Plan Interest Expense (6.2) (6.1) (8.1) (14.0) (34.4)
Other Interest Expense (22.7) (16.6) (16.8) (17.0) (73.1)
Other (income) Expense Net 50.8 2.2 3.5 2.3 58.9
Income (loss) before Taxes $256.8 $219.1 $108.3 $64.2 $648.5
Income Tax Expense (69.2) (60.4) (30.6) (18.0) (178.2)
Net Income $187.6 $158.7 $77.7 $46.2 $470.3
* Sum of QTD may not equal YTD due to rounding
26 NYSE:LADSUPPLEMENTAL INFORMATION
2020 Adjusted non-GAAP reconciliation
YTD Net Disposal Gain on Asset Investment Insurance Tax Acquisition YTD
12/31/20 Sale of Stores Impairments Gains Reserves Attribute Expenses 12/31/20
$M, except for per As
Q1 Q2 Q4 Q2 Q4 Q1 Q2 Q3 Q2 Q1 Q2 Q3 Q4 Adjusted
share amounts Reported
$7.9 – – – $(7.9) – – – – – – – – – $–
Asset Impairments
Selling, General and 1,428.3 0.1 1.3 15.2 – – (0.8) (5.0) (0.3) – (0.5) (0.5) (0.6) (1.4) 1,435.8
Administrativ e
697.1 (0.1) (1.3) (15.2) 7.9 – 0.8 5.0 0.3 – 0.5 0.5 0.6 1.4 697.5
Income f rom Operations
Other Income 58.9 – – – – 43.8 – – – – – – – – 15.1
(Expense), Net
Income f rom Continuing
Operations bef ore 648.5 (0.1) (1.3) (15.2) 7.9 (43.8) 0.8 5.0 0.3 – 0.5 0.5 0.6 1.4 605.1
Income Taxes
(178.2) – 0.4 4.2 (2.3) 12.1 (0.2) (1.4) – (0.8) (0.1) (0.2) (0.1) (0.4) (167.0)
Income Taxes
$470.3 $(0.1) $(0.9) (11.0) $5.6 (31.7) $0.6 $3.6 0.3 $(0.8) $0.4 $0.3 0.5 1.0 $438.1
Net Income
Diluted Net Income per $19.53 0.00 (0.04) (0.46) 0.24 (1.32) 0.02 0.16 0.01 (0.03) 0.01 0.01 0.02 0.05 $18.19
Share
24.1
Diluted Share Count
27 NYSE:LADSUPPLEMENTAL INFORMATION
EBITDA, Adjusted EBITDA, and Net Debt
$M YTD’2021 TTM 2021 FY’2020 FY’2019 FY’2018
Net Income $461.1 $807.5 $470.3 $271.5 $265.7
Add : Flooring Interest Expense 13.3 25.6 34.4 72.8 62.3
Add : Other Interest Expense 51.6 90.9 73.1 60.6 56.0
Add : Income Taxes 169.8 299.3 178.2 103.9 71 .8
Add : Depreciation and Amortization 57.2 105.3 92.3 82.4 75.4
EBITDA $753.0 $1,328.6 $848.3 $591.2 $531.2
Less: Flooring Interest Expense (13.3) (25.6) (34.4) (72.8) (62.3)
Less: Used Vehicle Line of Credit Interest – (0.3) (0.5) (5.5) (2.9)
Add : Acquisition Expense 11.6 13.6 3.0 2.5 3.3
Add (Less): Loss (Gain) on Div estitures & Inv estments 4.2 (54.7) (60.4) (9.7) (15.4)
Add : Reserv e Adjustments 1.6 1.9 6.1 9.5 1.5
Add : Asset Impairments – – 7.9 2.6 1.3
Adjusted EBITDA $757.1 $1,263.5 $770.0 $517.8 $456.7
Total Debt $4,260.0 $4,260.0 $3,927.9 $3,537.4 $3,441.8
Less: Temporary pay down on f looring – -- (113.4) – –
Less: Floor Plan Related Debt (1,252.0) (1,252.0) (1,797.2) (2,216.6) (2,389.7)
Less: Cash and Cash Equiv alents (780.9) (780.9) (160.2) (84.0) (31.6)
Less: Av ailability on Used Vehicle and Serv ice Loaner
Facility (653.4) (653.4) (491.0) (239.8) –
28 NYSE:LAD Net Debt $1,573.7 $1,573.7 $1,366.1 $997.0 $1,020.5You can also read