Investor Presentation - January 2018 - Newmont

Page created by Derrick Sims
 
CONTINUE READING
Investor Presentation - January 2018 - Newmont
Investor Presentation
January 2018
Investor Presentation - January 2018 - Newmont
Cautionary statement
This presentation contains “forward-looking statements” within the meaning of Section 27A of the Securities Act of 1933, as amended, and Section
21E of the Securities Exchange Act of 1934, as amended, which are intended to be covered by the safe harbor created by such sections and other
applicable laws. Forward-looking statements often address our expected future business and financial performance and financial condition, and
often contain words such as "expect," "anticipate," "intend," "plan," "believe," "seek," "see," "will," "would," “estimate,” “future,” “forecast,” “outlook,”
“guidance,” “potential,” “possible”, "target," “preliminary,” or “range”. Such forward-looking statements may include, without limitation: (i) estimates
of future production and sales; (ii) estimates of future costs applicable to sales and All-in sustaining costs; (iii) estimates of future capital
expenditures, development capital and sustaining capital; (iv) estimates of future cost reductions, value improvements, and efficiencies, including,
without limitation, in connection with full potential and innovation; (v) expectations regarding the development, growth, profitability, and potential of
the Company’s operations, projects and investments, including, without limitation, profitability, returns, IRR, schedule, decision dates, mine life,
commercial production, first production, development capital, average production, average CAS and AISC, upside potential, other outlook and
future approvals; (vi) expectations regarding future free cash flow generation, future cash flow profile, liquidity and balance sheet strength; (vii)
estimates of future closure costs and liabilities; (viii) expectations of future dividends and returns to shareholders; and (ix) expectations regarding
future investments and transactions. Estimates or expectations of future events or results are based upon certain assumptions, which may prove to
be incorrect. Such assumptions, include, but are not limited to: (i) there being no significant change to current geotechnical, metallurgical,
hydrological and other physical conditions; (ii) permitting, development, operations and expansion of the Company’s operations and projects being
consistent with current expectations and mine plans; (iii) political developments in any jurisdiction in which the Company operates being consistent
with its current expectations; (iv) certain exchange rate assumptions for the Australian dollar to the U.S. dollar, as well as other the exchange rates
being approximately consistent with current levels; (v) certain price assumptions for gold, copper and oil; (vi) prices for key supplies being
approximately consistent with current levels; (vii) the accuracy of our current mineral reserve and mineralized material estimates; and (viii) other
assumptions noted herein. Potential additional risks include other political, regulatory or legal challenges and community and labor issues. Where
the Company expresses or implies an expectation or belief as to future events or results, such expectation or belief is expressed in good faith and
believed to have a reasonable basis. However, such statements are subject to risks, uncertainties and other factors, which could cause actual
results to differ materially from future results expressed, projected or implied by the “forward-looking statements”. Other risks relating to forward
looking statements in regard to the Company’s business and future performance may include, but are not limited to, gold and other metals price
volatility, currency fluctuations, increased production costs and variances in ore grade or recovery rates from those assumed in mining plans,
political and operational risks, community relations, conflict resolution and outcome of projects or oppositions and governmental regulation and
judicial outcomes. For a more detailed discussion of such risks and other factors, see the Company’s 2016 Annual Report on Form 10-K, filed on
February 21, 2017, with the Securities and Exchange Commission (SEC) as well as the Company’s other SEC filings. The Company does not
undertake any obligation to release publicly revisions to any “forward-looking statement,” including, without limitation, outlook, to reflect events or
circumstances after the date of this presentation, or to reflect the occurrence of unanticipated events, except as may be required under applicable
securities laws. Investors should not assume that any lack of update to a previously issued “forward-looking statement” constitutes a reaffirmation
of that statement. Continued reliance on “forward-looking statements” is at investors' own risk. Investors are reminded to refer to the Endnotes at
the back of this presentation and that historical safety performance, reserve statistics and financial results (including AISC and production figures)
referenced herein exclude results from the Company’s former Batu Hijau operation, which was divested by the Company in 2016. Investor Day
attendees participating in the Technology Gallery Walk or viewing the related Technical Services videos are reminded that this cautionary and the
endnotes to this slide presentation should be referenced in connection with the gallery walk and videos.

January 2018                                                                                     Newmont Mining Corporation I Investor Presentation I Slide 2
Investor Presentation - January 2018 - Newmont
Proven strategy for long-term value creation

               Improve                  Deliver
underlying business                     superior operational execution

                   Strengthen                 Sustain
                         portfolio            global portfolio of long-life assets

                         Create value                 Lead sector
                           for shareholders
                                                      in profitability and responsibility

January 2018                                            Newmont Mining Corporation I Investor Presentation I Slide 3
Investor Presentation - January 2018 - Newmont
Leading performance relies on operational execution
Total injury rates down 53%                                                        All-in sustaining costs1,2 down 22%

                                                                                                                                             $909
                                                                      0.38

   2012         2013          2014         2015         2016          2017          2012      2013        2014        2015        2016       2017
                                                                      YTD *                                                                  YTD *

               Top sustainability performance in mining sector for three consecutive years

* YTD figures used in this presentation are nine months ended September 30, 2017

January 2018                                                                               Newmont Mining Corporation I Investor Presentation I Slide 4
Investor Presentation - January 2018 - Newmont
Global portfolio of long-life assets
     Operations and sustaining projects                                                       Improvements since 2012
     Current projects
                                                                                         3 new lower cost mines
     Mid-term projects
     Long-term projects                                                                  9 profitable expansions
                                                                                         Average project IRR >20%
                                                                                         $2.8B in non-core asset sales
North America
Carlin                                                                                   Improved value and risk profile
− Northwest Exodus
− Greater Leeville
− Pete Bajo exp.
Twin Creeks
− Twin UG
Phoenix
Long Canyon
− Long Canyon Phase 2                                       Africa
CC&V                                                        Ahafo
                                                            − Mill exp                 Australia
                       South America                        − Subika UG                Boddington
                       Merian                               − Awonsu                   Kalgoorlie
                       − Sabajo                             − Ahafo UG                 − Morrison
                       Yanacocha                            Akyem                      Tanami
                       − Quecher Main                       − Akyem UG                 − Tanami Power
                       − Yanacocha Sulfides                 Ahafo North                − Tanami Expansion 2

  2018E gold                      North America           South America         Africa                         Australia
  production*                            41%                 12%                16%                              31%
* Estimated attributable gold production; see Endnote 1

January 2018                                                              Newmont Mining Corporation I Investor Presentation I Slide 5
Investor Presentation - January 2018 - Newmont
Investing in profitable projects across the cycle
               Project                       Mine life (yrs)             Cost (AISC/oz)               Production (Koz/yr)                Capital ($M)      IRR (%)
   Merian (75%)                                      15                    $650 – $750                       300 – 375                        ~$525          >25%
   Long Canyon Phase 1                                8                    $500 – $600                       100 – 150                        ~$225          >25%
   Tanami expansion                                  +3                    $700 – $750                            ~ 80                        ~$120          >35%
   Northwest Exodus                                  +7                    ~$25 lower                          50 – 75                     $50 – $70         >30%
   Ahafo Mill expansion                                                   reduced by                          75 – 100                   $140 – $180         >20%
   Subika Underground                                11                  $250 – $350**                       150 – 200                   $160 – $200         >20%
   Twin Underground                                 13*                    $650 – $750                         30 – 40                     $45 – $55         ~20%
   Quecher Main***                                    8                  $900 – $1,000                           ~200                    $250 – $300         >10%

Merian attributable; AISC/oz & Koz/year represent first 5-year project averages except for Long Canyon (LOM average), Quecher Main (see *** below)
* Represents processing life for Twin Underground
** Average annual improvement to Ahafo compared to 2016                                                                                                         Ghana
*** Production represents Yanacocha (100%) from 2020-2025; AISC represents incremental unit costs 2020-2025

January 2018                                                                                                 Newmont Mining Corporation I Investor Presentation I Slide 6
Investor Presentation - January 2018 - Newmont
Leading project pipeline and track record
                                                                      Long-term projects (>3 years; not in outlook)
                                                                      Mid-term projects (
Investor Presentation - January 2018 - Newmont
Stability extends beyond five year outlook
Projected production profile (Moz)*
                                                                                          Industry-leading long-term pipeline

6.0
             Divested                                                   Current                   Mid-term                      Prefeasibility
                                                                        projects                  projects                      projects **

5.0

4.0

3.0
                                                         Existing assets and sustaining projects

2.0

1.0                                                                                          5
                                                                                FCF/share up $3.60 since 2012

   -
   2012           2013         2014          2015          2016          2017      2018    2019       2020        2021        2022        2023        2024
* Estimated attributable gold production; see Endnote 1
** Prefeasibility projects include Yanacocha Sulfides and Tanami Expansion 2

January 2018                                                                                      Newmont Mining Corporation I Investor Presentation I Slide 8
Investor Presentation - January 2018 - Newmont
Five-year guidance reflects steady performance

 Guidance metric               2018E           2019E                           2020E – 2022E

 Gold production (Moz)      4.9 – 5.4 Moz   4.9 – 5.4 Moz                       4.6 – 5.1 Moz

 CAS ($/oz)                 $700 – $750     $620 – $720                          $650 – $750

 AISC ($/oz)                $965 – $1,025   $870 – $970                          $870 – $970

 Sustaining Capital ($M)    $600 – $700     $600 – $700                          $550 – $650

 Development Capital ($M)   $310 – $370     $100 – $150                               $~50

 Total Capital ($M)         $900 – $1,000   $730 – $830                          $580 – $680

                                                                                         Quecher Main

January 2018                                     Newmont Mining Corporation I Investor Presentation I Slide 9
Investor Presentation - January 2018 - Newmont
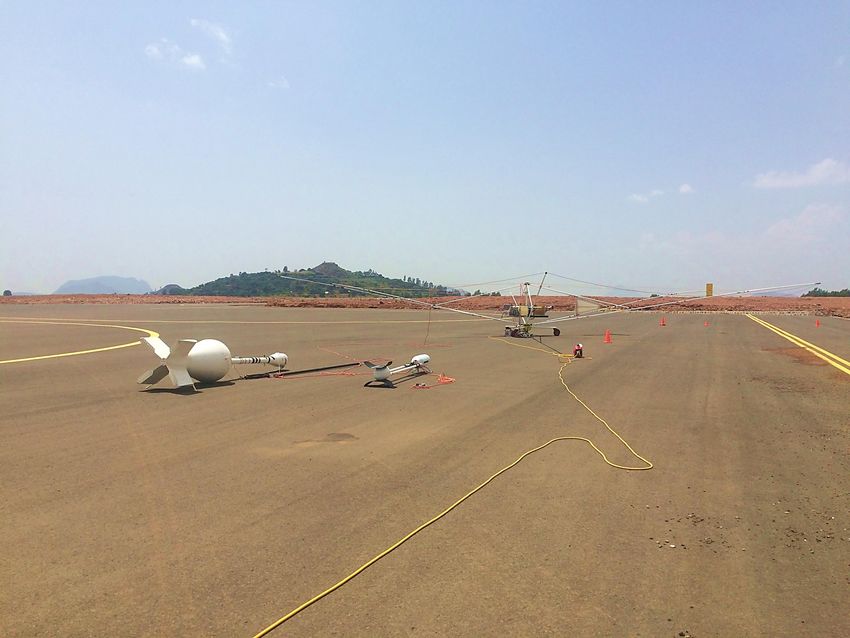
Progressing long-term growth options
• North America – UG expansions (Carlin, Twin, Long Canyon); Greenfields (Canada, US)

• South America – Expansions (Yanacocha, Sabajo); Greenfields (Colombia, Andes, Guiana Shield)

• Africa – UG expansions (Ahafo, Akyem); Greenfields (Ethiopia)

• Australia – UG expansions (Tanami); Greenfields (Australia)

                                                                Airborne geologic mapping in Ethiopia

January 2018                                            Newmont Mining Corporation I Investor Presentation I Slide 10
Superior Reserves and returns

               128oz                                       12yrs                                     72%                                    1.20g/t

      Reserves per Kshare                        Operating Reserves                         Reserves based in                               Reserve grade
            vs gold sector                             vs gold sector                         US, Australia,                              vs 2016 mined grade
       average of 77oz/Kshares*                      average of 9.9 yrs**                   Canada and Western                               of 1.15 g/tonne
       vs gold sector
                                                                                            Europe vs gold sector
       average of 77Koz
                                                                                              average of 29%*

           Top quartile Total Shareholder Returns delivered since 2014
* Competitor average includes Agnico Eagle, AngloGold, Barrick, Gold Fields, Goldcorp, Kinross, Newcrest, Randgold and Yamana and is Reserve weighted as of 12/21/2016
                                                                                                                                                            12/31/2016
** Sourced from RBC Capital research report – competitor average includes Agnico Eagle, Barrick, Goldcorp and Kinross
* Competitor average includes Agnico Eagle, AngloGold, Barrick, Gold Fields, Goldcorp, Kinross, Newcrest, Randgold and Yamana; Reserves weighted as of 12/31/2016; see Endnote 6
*** Need footnote
** Sourced from RBC Capital research report – competitor average includes Agnico Eagle, Barrick, Goldcorp and Kinross

January 2018                                                                                             Newmont Mining Corporation I Investor Presentation I Slide 11
Digital assessments guide fit-for-purpose approach
    Autonomous         Advanced           Centralized        Connected              Advanced                 Smart Mine
        fleet       process control        support            worker                analytics

 Apply control      Provide a           Enable            Leverage              Provide insight           Maximize use of
 logic & AI to      consistent site     improved          wearable              & foresight               production data
 improve safety,    framework to        consistency,      technology for        through                   in real time to
 accuracy,          sustain process     collaboration &   safety and            statistics,               optimally mine
 consistency &      control             decision-making   operational           machine                   and process ore
 efficiency         improvement         through           efficiency            learning &
                                        connected hubs                          reasoning

 • OP automation    • Advanced          • Centralized     • Safety              • Predictive              • Multi-source
 • UG automation      process control     support         • Time &                analytics                 geological
                                                                                                            database
 • Infrastructure   • Alarm             • Centralized       attendance          • Prescriptive
                      management          asset health                            analytics               • Smart Models
                                                          • Mobile/in-field
                    • Loop                                  tools               • Cognitive               • Automated
                      monitoring                                                  computing                 revenue-based
                                                          • Workforce
                    • Change                                planning &                                      dig lines
                      Management                            optimization                                  • Stochastic
                                                                                                            mine planning

                                      IT infrastructure and architecture
January 2018                                                         Newmont Mining Corporation I Investor Presentation I Slide 12
Balance sheet among the best in the gold sector
Growing margins, Reserves and Resources

• ~$6.7B invested into profitable growth*

Net debt to adjusted EBITDA4 of 0.4x

• $2.8B of gross debt repaid*

Maintaining investment grade balance sheet

• Liquidity of $5.9B as of Q3 2017

Returning cash to shareholders

Net debt ($B)
     $4.8
                      $3.8             $3.5

                                               $1.9
                                                       $1.1

     2013             2014             2015    2016   Q3 2017                                         Ahafo gold pour
* January 1, 2013 through September 30, 2017

January 2018                                                    Newmont Mining Corporation I Investor Presentation I Slide 13
Dividend aligned to long-term value creation
Stable and sustainable dividend
                                                                               Annualized dividend ($/share)
• Reflects stable long-term production
                                                                                                                                         >50%
• Reiterates confidence in cash flow stability

• Removes gold price-link

Aligns with capital priorities
                                                                                                                           $0.30
• Incorporates ongoing investment in growth
                                                                                                            $0.25
• Maintains investment grade balance sheet

2018 annual dividend expected to be at least
50% more than current dividend
                                                                                             $0.125
• Expected for Q4 2017                                                             $0.10

• To be announced and payable in Q1 2018

• Subject to Board review with price fluctuations
                                                                                   2014
                                                                                   2015        2015
                                                                                               2016          2016
                                                                                                             2017    Q3(annualized)
                                                                                                                Q3 2017  2017 2018E
                                                                                                                                 2018E
                                                                                                                       (annualized)
Reflects management’s current expectations; 2018 dividends have not yet been
declared by the Board; see Endnote 7

January 2018                                                                           Newmont Mining Corporation I Investor Presentation I Slide 14
Leading in profitability and responsibility

                      Safe, stable and profitable gold production over longer horizon
      Superior
     operational      Continuous cost and productivity improvement through Full Potential
      execution
                      Industry leading talent and robust and diverse leadership pipeline

                      Ongoing margin growth across four anchor regions
  Global portfolio
    of long-life      Leading project pipeline and execution record
      assets
                      Differentiated reserve value and risk profile

                      Capital discipline across all investments and cycles
     Leading in
  profitability and   Superior balance sheet and dividends
   responsibility
                      Leading environmental, social and governance performance

Tanami ore (Auron)

January 2018                                                          Newmont Mining Corporation I Investor Presentation I Slide 15
Appendix
Free Cash Flow of ~$500M generated in the quarter

  Financial metric                         Q3 2016               Q3 2017                      Change

  Revenue ($M)                             $1,791                 $1,879                        +5%

  Adjusted Net Income ($/diluted share)3    $0.38                  $0.35                         -8%

  Adjusted EBITDA ($M)4                     $666                    $653                         -2%

  Cash from continuing operations ($M)      $508                    $688                       +35%

  Free Cash Flow ($M)5                      $239                    $494                       +107%

                                                                                                        Merian
* 2017 Actuals are YTD Q3 2017
January 2018                                         Newmont Mining Corporation I Investor Presentation I Slide 17
Costs improve on productivity and portfolio gains
Gold all-in sustaining cost outlook ($/oz)*

    $1,099

                        $996                                                  $1,025
                                          $933                $912              –
                                                                      $950                $970            $970           $970            $970
                                                                               965          –               –              –              –
                                                                       –
                                                                       900                 870             870            870            870

                                                                                YTD** = $909/oz

    2013A             2014A             2015A                 2016A   2017E   2018E      2019E             2020E – 2022E
                                                                                                         2020E     2021E Average
                                                                                                                             2022E

* Consolidated all-in sustaining cost; see Endnotes 1 and 2
** Actuals YTD Q3 2017
January 2018                                                                           Newmont Mining Corporation I Investor Presentation I Slide 18
Mine and mill improvements boost production
Attributable gold production outlook (Moz)

                                                              5.4     5.4         5.4
       5.0                                                     –
                                                      4.9              –           –             5.1             5.1            5.1
                         4.7               4.6                5.0     4.9         4.9             –               –              –
                                                                                                 4.6             4.6            4.6

                                                                      YTD** = 3.9 Moz

    2013A             2014A             2015A        2016A   2017E   2018E     2019E             2020E – 2022E
                                                                                               2020E     2021E Average
                                                                                                                   2022E

* Estimated attributable production; see Endnote 1
** Actuals YTD Q3 2017
January 2018                                                                 Newmont Mining Corporation I Investor Presentation I Slide 19
North America continues as cornerstone
       Five operating complexes and 50-year track record of profitability and innovation

       • Higher stripping at Twin, Carlin partly offset by new underground production

       • Pursuing profitable longer-term growth at Carlin, Long Canyon, Plateau

       • Increasing value through fit-for-purpose technology, improved regional integration

       Attributable gold production and AISC trends and outlook (Koz and $/oz)
2500                                                                                                                                                  1600

                                                                    2,080 – 2,240   2,010 – 2,170
                                                            2,024                                                              1,900 – 2,100          1400

2000                                                                                                     1,800 – 2,000
                                                                                                                                                      1200
                1,631                    1,643
                                                                                                                                                      1000
1500
               $1,007                     $979                                         $945 –
                                                            $869       $855 –                                $870 –                $825 –
                                                                                                                                                      800
                                                                                       $1,020
1000                                                                    $930                                  $970                  $925              600

                                                                                                                                                      400
500
                                                                                                                                                      200

   0                                                                                                                                                  0

                2014                      2015              2016       2017E           2018E                 2019E                 2020E

                            Gold production (Koz)                   Gold production outlook (Koz)                           AISC ($/oz)
       * Estimated attributable production; see Endnote 1
       January 2018                                                                   Newmont Mining Corporation I Investor Presentation I Slide 20
South America balancing profitability and growth
      Source of profitable production and growth for nearly 25 years with expanding scope

      • Lower cost production from Merian offsetting declining oxide profile at Yanacocha

      • Focus on maximizing profitability and optimizing growth projects

      • Advancing near-mine expansions and early-stage prospects across Andes and Guiana Shield

      Attributable gold production and AISC trends and outlook (Koz and $/oz)
700                                                                   630 – 690         615 – 675           590 – 690                                  $2,000
                                                                                                                                                       $1,800
600                                                                                                                               475 – 575            $1,600
500            498                         471                                                                                                         $1,400
                                                            414                                                                                        $1,200
400
                                                                                                                                                       $1,000
300          $1,001                                        $1,052      $965 –               $945 –                                   $970 –
                                        $949                                                                   $810 –                                  $800
                                                                       $1,025               $1,045                                   $1,070
200                                                                                                             $910                                   $600
                                                                                                                                                       $400
100                                                                            $880 – 980
                                                                                                     $850 – 950               $810 – 910               $200
  0                                                                                                                                                    $0
               2014                      2015               2016       2017E                2018E              2019E                 2020E

                           Gold production (Koz)                    Gold production outlook (Koz)                            AISC ($/oz)
      * Estimated attributable production; see Endnote 1
      January 2018                                                                     Newmont Mining Corporation I Investor Presentation I Slide 21
Australia growing margins and reserves
       Australia’s largest gold producer, responsible for 17% of country’s total production

       • Full Potential eliminates mill constraints, sets new standards for maintenance practices

       • Advancing profitable underground expansions and surface mine laybacks

       • Leveraging expertise, best practices across region

       Attributable gold production and AISC trends and outlook (Koz and $/oz)
2000                                                                                                                                                  1600

1800
                1,640                    1,665              1,641   1,520 – 1,695   1,530 – 1,670                                                     1400
1600
                                                                                                         1,440 – 1,640         1,380 – 1,580
                                                                                                                                                      1200
1400
                                                                                                                                                      1000
1200

1000            $975                                                                                                                                  800
                                                                                       $830 –                $840 –                $840 –
                                          $818              $786       $795 –
 800
                                                                                        $890                  $940                  $940              600
                                                                        $855
 600
                                                                                                                                                      400
 400
                                                                                                                                                      200
 200

   0                                                                                                                                                  0

                2014                      2015              2016       2017E           2018E                 2019E                 2020E

                            Gold production (Koz)                   Gold production outlook (Koz)                           AISC ($/oz)
       * Estimated attributable production; see Endnote 1
       January 2018                                                                   Newmont Mining Corporation I Investor Presentation I Slide 22
Africa delivering improved performance and growth
       Ghana’s largest gold producer, responsible for 32% of country’s total production

       • Mine plan optimization, improved mill throughput and recovery delivering lower unit costs

       • Subika Underground and Ahafo Mill Expansion progressing on course

       • Advancing regional growth studies – prospective opportunities at surface and underground

       Attributable gold production and AISC trends and outlook (Koz and $/oz)
1250                                                                                        1,085 – 1,185                                1400

1050                                                                                                                                     1200
               914                                                                                                  880 – 980
                               805            819      775 – 835         815 – 875
 850                                                                                                                                     1000

 650                                                                      $865 –                                                         800
                                              $833      $830 –                                                        $775 –
                                                         $880              $925
                              $718                                                              $700 –                 $875
 450                                                                                                                                     600
              $647                                                                               $800
 250
                                                                                     $960 – 1,060
                                                                 $870 – 920                                                              400

                                                                                                               $680 – 780
  50                                                                                                                                     200

              2014            2015            2016      2017E             2018E                 2019E                  2020E
-150                                                                                                                                     0

                      Gold production (Koz)          Gold production outlook (Koz)                             AISC ($/oz)

       January 2018                                                      Newmont Mining Corporation I Investor Presentation I Slide 23
2018 Strategy Map
 Purpose     Our purpose is to create value and improve lives through sustainable and responsible mining

             • Deliver superior operational execution
 Strategy    • Sustain a global portfolio of long-life assets
             • Lead the gold sector in profitability and responsibility

                                                                                                                                        Sustainability & External
Elements           Health & Safety          Operational Excellence                  Growth                          People
                                                                                                                                               Relations

             • Culture of zero harm        • Culture of continuous        • Value accretive growth        • Competitive advantage       • Access to land,
 Strategic   • Industry-leading health       improvement                  • Industry-leading return         through people                resources and approvals
objectives     & safety performance        • Cost improvements              on capital employed           • Leading engagement,         • Reputation conveys
                                             more than offset inflation     (ROCE)                          leadership and inclusion      competitive advantage

             • Safety leadership           • Business improvement         • M&A, projects and             Industry-leading:             • Performance
             • Fatality prevention         • Portfolio optimization         exploration that improve      • Employee engagement         • Risk management
 Strategic
                                                                            portfolio value, longevity,
   drivers   • Employee engagement         • Technical foundations          cost and risk profile         • Talent pipeline             • Reputation
             • Health and wellness                                                                        • Inclusion and diversity

             • Eliminate fatalities by     • Meet EBITDA target           • Deliver NW Exodus,            • Increase focus on bench     • Achieve 2018 public
               implementing critical       • Meet cash sustaining           Twin UG and Subika UG           strength, employee and        S&ER targets
               controls and verification     cost per gold equivalent       on time and budget              leadership development      • Develop and implement
               processes                     ounce target                 • Advance Ahafo Mill            • Broaden workforce             global closure strategy
             • Improve quality of pre-     • Meet gold and copper           Expansion, Quecher              understanding of            • Implement Supplier Risk
               start meetings                production targets             Main, Morrison, Tanami          employee value                Management, including
             • Improve quality of SPE                                       Power and CC&V                  proposition and brand         human rights pre-
                                           • Achieve planned Full           concentrate projects
  2018 BP      investigations and            Potential improvements;                                      • Progress inclusive            screening program and
objectives     application of lessons        progress upside              • Progress strategic              environment and diverse       training
               learned                                                      transactions                    representation              • Measurably improve
                                           • Deliver measurable
             • Reduce health                 IT/OT, cyber security        • Achieve Reserve,              • Leverage HR Full              Newmont’s reputation
               exposures by                  and technology benefits        Resource and Inventory          Potential for sustainable     for transparency and
               implementing critical                                        targets                         enterprise performance        performance
               controls for key risks      • Deliver asset
                                             management                                                                                 • Implement Phase 3 of
                                             improvements across                                                                          Integrated Management
                                             portfolio                                                                                    System

   Values              Safety                       Integrity                   Sustainability                    Inclusion                  Responsibility

   December 2017                                                                                                          Newmont Mining Corporation – Confidential
Executive compensation tied to shareholder returns

                                               Base salary
                                                  12%                         Personal
                                                                             objectives
                                                              Personal
                           Restricted Stock                    bonus
                              Units 23%                         6%

 Two-thirds of                                            Company bonus             Operating
 compensation                                                 13%                  performance
 linked to stock
 performance

                              Performance
                             Stock Units 46%

 CEO target compensation

 January 2018                                      Newmont Mining Corporation I Investor Presentation I Slide 25
2017 Incentives plan aligned to strategic objectives
  Health

  Safety
                                           • Effective critical controls (leading)
   and

                                                                                                                                                   20%
                                           • Total injury rates (lagging)
    Operational

                                           • Value creation (adjusted EBITDA per share*)
    excellence

                                                                                                                                                   30%

                                           • Efficiency (production costs)                                                                         30%

                                           • Project execution (timing and spend)                                                                  10%
       Growth

                                           • Exploration success (Reserves and Resources
                                                                                                                                                    5%
                                             per share)

                                           • Access (public targets)
       S&ER

                                                                                                                                                    5%
                                           • Reputation (DJSI rating)
 TOTAL                                                                                                                                            100%
*Adjusted EBITDA per share represents Corporate Performance Bonus EBITDA per share to be defined in Annex A of Proxy Statement

January 2018                                                                                           Newmont Mining Corporation I Investor Presentation I Slide 26
Sustainability program aligned to best practice
Active participation in leading organizations and initiatives

Industry leader in setting and meeting public sustainability targets

                                             Current Targets

 Complaints and Grievances          Close 100% of Tier 1 complaints and grievances within 30 days

 Water                              Achieve 80% of site water strategy targets and 100% completion of actions

 Closure and Reclamation            Achieve 90% of concurrent final reclamation annual plan

 Community Commitments              90% completion of all community commitments by due date at all sites

 Local Employment                   Achieve target % determined by site

 Local Procurement                  Achieve spend target determined by region

 Security and Human Rights          100% completion of Critical Control Management Plan at all sites

 Diversity and Inclusion            Increase enterprise-wide representation of women to 15% by 2018

January 2018                                                      Newmont Mining Corporation I Investor Presentation I Slide 27
Responsible, sustainable value creation

   Forging early,
     mutually                                Reducing energy              Concurrent reclamation plans
                           Mine closure
     beneficial                                 emission                 integrated into annual and long-
                            planning
   relationships                                intensity                        term mine plans

    Exploration      Development   Construction       Production          Closure              Post-Closure

                                Ongoing social and
                               environmental impact
                                   assessments

                    Values based company committed to transparency
January 2018                                                  Newmont Mining Corporation I Investor Presentation I Slide 28
Broad management experience
                                                                  Executive Leadership Team

 Gary                Nancy Buese        Elaine               Randy            Steve            Susan               Scott            Bill            Tom
 Goldberg            EVP and CFO        Dorward-King         Engel            Gottesfeld       Keefe               Lawson           MacGowan        Palmer
 President and                          EVP, S&ER            EVP, Strategic   EVP & General    VP, Strategic       EVP and CTO      EVP Human       EVP and COO
 CEO                                                         Development      Counsel          Relations                            Resources

                                                                         Board of Directors

 Noreen          Greg            Bruce R.        J. Kofi         Vincent A.       Joseph A.   Veronica         Sheri       Jane          Julio        Molly
 Doyle           Boyce           Brook           Bucknor         Calarco          Carrabba    Hagen            Hickok      Nelson        Quintana     Zhang
 Chair

                                                        Top investors (as of September 30, 2017)*

 BlackRock                          Vanguard Group                      Van Eck                          State Street                 Carmignac Gestion
 (11.6%)                            (10.3%)                             (5.0%)                           (4.9%)                       (2.9%)

* Top Investors based upon September 30, 2017 13-F filings

January 2018                                                                                         Newmont Mining Corporation I Investor Presentation I Slide 29
Diverse Board led by independent Chair
 • 11 out of 12 Directors are independent (all except CEO)

 • All 4 main committees comprised of independent directors only

 • Average tenure 6 years; average age of ~61 years (retirement age 75)

 • 58% are female or ethnically diverse; one third live outside the United States

 Diversity of Director experience
                                                                                                     9
                      Health & Safety Experience
                                                                                              8
Environmental & Social Responsibility Experience
                                                    1
                               Leading Academic
                                                                                                     9
        Government/Regulatory Affairs Experience
                                                                                              8
                              Financial Expertise
                                                                                       7
                            Extractives Expertise
                                                                                       7
                         Current or Former CEOs
                                                                                                                  11
                International Business Experience

 January 2018                                                    Newmont Mining Corporation I Investor Presentation I Slide 30
6
Delivered 4.1 Moz of Reserves, 6.1 Moz of Resources
2016 attributable gold Reserves (Moz)                                 Reserve sensitivity to gold price (Moz)

                                                                                                                                ~77
                                                                                                      ~68          ~71
                                                                                          ~64
                                                                             ~59

                                                                          $1,000        $1,100      $1,200       $1,300       $1,400

                            2.6
                                                         0.6                                             4.1

      73.7
                                                71.1
                                                                                                                            68.5
                                                                    6.0               0.1

 Actual 2015 PTNNT sale*                   Revised      Price   Depletion        Revisions          Additions         Actual 2016
                                            2015       Change

Major additions at Tanami and Merian (Reserves); Yanacocha sulfides (Resources)
*PTNNT sale was completed on 02 November 2016

January 2018                                                                Newmont Mining Corporation I Investor Presentation I Slide 31
Twin Underground adds higher grades at lower costs
• Profitable expansion adds higher grade ore and extends processing life at well-known deposit

• First production achieved in August 2017; commercial production forecast for mid-2018

• Adds 30 – 40Koz per year at CAS of $525 – $625/oz and AISC of $650 –$750/oz

• $45 – $55M of total development capital with an estimated internal rate of return of ~20%

Production, CAS and AISC estimates represent first full five year average. See Endnote 1.                                      Twin Underground

January 2018                                                                                Newmont Mining Corporation I Investor Presentation I Slide 32
Twin Creeks develops Vista Underground

Reserves and Resource base (R&R)                                                              Upside Potential

• Reserves: 0.2 Moz (1 Mt @ 6.6 g/t Au)                                                       • 60% of Inventory converted to R&R

• Resource: 0.04 Moz (0.3 Mt @ 5.0g/t Au)                                                     • Mineralization over 2.3km strike length
Highlights

• 0.1 Moz Reserves additions in 2016

• Completion of successful test stoping

• Provides sulfide sulfur feed to Twin Creeks autoclave bringing forward high carbonate stockpile material
For graphics and mineralization representations please refer to Endnote 6. Resource as used on the page includes primarily inferred.
January 2018                                                                                                 Newmont Mining Corporation I Investor Presentation I Slide 33
Northwest Exodus extends Carlin life and access
• Extends mine life by 7 years, produces ~700Koz, lowers Carlin AISC by ~$25/oz1

• IRR of >30% at flat $1,200/oz gold price

• Creates platform for future growth in highly prospective Carlin underground

   Lantern

                                             Exodus
                                                                               NW Exodus

January 2018                                           Newmont Mining Corporation I Investor Presentation I Slide 34
Exodus – growing into major underground deposit

Reserves and Resource (R&R) base                                                             Upside Potential

• Reserves: 0.8 Moz (3Mt @ 8.1 g/t Au)                                                        • 45% of Inventory converted to R&R

• Resource*: 0.3 Moz (2Mt @ 6.1 g/t Au)                                                       • Half of +4.0km target drill tested
Highlights

• 0.8Moz Reserves and 0.5Moz Resource** additions since 2015 Investor Day

• Additional Reserves expected in 2017

• Larger than expected Footwall intercepts; first footwall stopes successfully mined
* Primarily Indicated 0.9 Mt @ 6.0 g/t Au (0.2Moz), Inferred 0.8Mt @ 6.2 g/t Au (0.2Moz). ** Includes NW Exodus; includes Inferred, refer Endnote 6.
January 2018                                                                                                 Newmont Mining Corporation I Investor Presentation I Slide 35
Developing Carlin’s multimillion-ounce underground

Reserves and Resource base (R&R)                                                           Upside Potential

• Reserves: 0.4 Moz (1.5 Mt at 7.9 g/t)                                                    • 20% of Inventory converted to R&R

• Resource: 0.5 Moz (2.1 Mt at 7.4 g/t)                                                    • 3.0km by 1.0km corridor only partially drill tested
Highlights

• 0.2 Moz Reserves and 0.2 Moz Resource additions in 2016

• Extended mineralization around Rita K, Full House, Fence and Pete Bajo

• Drilling confirm mineralization on the Full House Deep Sensing Geochemistry NE trend 1.0 km to the N
For graphics and mineralization representations please refer to Endnote 6. Resource as used on the page includes measured and indicated. R&R base includes Pete Bajo, Full House and
Fence. Resource in the R&R base includes measured and indicated (0.2 Moz) and inferred (0.3 Moz).
January 2018                                                                                              Newmont Mining Corporation I Investor Presentation I Slide 36
Leeville – growing high grade underground deposit

Reserves and Resource (R&R) base                                                             Upside Potential

• Reserves: 3.8 Moz (12Mt @ 10.3 g/t Au)                                                     • 45% of Inventory converted to R&R

• Resource*: 0.6 Moz (2Mt @ 10.4 g/t Au)                                                     • 2.6km of exploration drift over the next 3 years
Highlights

• 0.2Moz Reserves and 0.3Moz Resource** additions since 2015 Investor Day

• Additional Reserves and Resource expected in 2017

• Strong results South and West of Four Corners; NE upside potential subparallel to West Bounding Fault
* Measured 0.5Mt @ 7.2g/t (0.1Moz), Indicated 0.6Mt @ 11.7 g/t Au (0.2Moz), Inferred 0.8Mt @ 11.4 g/t Au (0.3Moz). ** Includes Inferred, refer to Endnote 6.
January 2018                                                                                                 Newmont Mining Corporation I Investor Presentation I Slide 37
CC&V – building long term value

Reserves and Resource base (R&R)                                                            Upside Potential

• Reserves: 3.4 Moz (129 Mt @ 0.8 g/t Au)                                                   • Along vertical contacts and hydrothermal pipes

• Resource: 2.5 Moz (137 Mt @ 0.6 g/t Au)                                                   • Below current pits
Highlights

• 2016 drilling focused on Inventory: Mineralized zones below WHEX pit (up to 29m @ 2.6 g/t Au)

• Mineralization extended in the NE portion of WHEX pit (13.7m @ 5.5 g/t Au)

• Mineralization at favorable horizon between Globe Hill and WHEX pits (85m @ 1.2 g/t Au)
For graphics and mineralization representations please refer to Endnote 6. Resource as used on the page includes measured and indicated (2.2 Moz) and inferred (0.3 Moz).
January 2018                                                                                               Newmont Mining Corporation I Investor Presentation I Slide 38
Tanami Expansion adds profitable ounces, mine life
• Option maximizes IRR, cash flow and value        Production                                       To 425–475 Koz

• Expansion improves costs and mine life           AISC/oz                                          $700 – $750
                                                   Capital                                          $120M
• Platform for growth – significant upside potential Commercial production August 2017
                                                 Production and AISC calculated as first full five year average for Tanami,
                                                 including the expansion; see Endnote 1

Cripple Creek & Victor

January 2018                                              Newmont Mining Corporation I Investor Presentation I Slide 39
Tanami’s Expansion 2 taps new discoveries
Increases profitable production and extends mine life

• Includes production shaft to maximize value from 1,200 – 2,600m below surface; optimizing
  processing capacity

• Staged investment; develop while continuing to optimize resource risk at depth

• Decision expected in H2 2019 with a two year construction period

                                                                                        Production shaft

               -260RL

                               Focus area

January 2018                                              Newmont Mining Corporation I Investor Presentation I Slide 40
Tanami UG – advancing Tanami Expansion 2

Reserves and Resource (R&R) base                                                               Upside Potential

• Reserves: 4.5 Moz (23Mt @ 6.0 g/t Au)                                                        • 70% of Inventory converted to R&R

• Resource*: 1.1 Moz (6Mt @ 4.7 g/t Au)                                                        • Extensions and repeating structures
Highlights

• 2.2 Moz Reserves and 1.2 Moz Resource** additions since 2015 Investor Day

• First Reserves at Federation and Auron West discoveries

• Maiden Resource at Liberator in 2017/2018 (up to 58m @ 23.4 g/t Au; 38m @ 10.5 g/t Au)
* Primarily Indicated 3Mt @ 5.5 g/t Au (0.5Moz), Inferred 3Mt @ 5.9 g/t Au (0.6Moz). ** Includes Inferred, refer Endnote 6.
January 2018                                                                                                   Newmont Mining Corporation I Investor Presentation I Slide 41
Tanami UG – advancing Tanami Expansion 2

Reserves and Resource (R&R) base                                                                Upside Potential

• Reserves: 4.5 Moz (23Mt @ 6.0 g/t Au)                                                         • 70% of Inventory converted to R&R

• Resource*: 1.1 Moz (6Mt @ 4.7 g/t Au)                                                         • Extensions and repeating structures
Highlights

• 2.2 Moz Reserves and 1.2 Moz Resource** additions since 2015 Investor Day

• First Reserves at Federation and Auron West discoveries

• Maiden Resource at Liberator in 2017/2018 (up to 58m @ 23.4 g/t Au; 38m @ 10.5 g/t Au)
* Primarily Indicated 3Mt @ 5.5 g/t Au (0.5Moz), Inferred 3Mt @ 5.9 g/t Au (0.6Moz). ** Includes Inferred, refer to 6.
January 2018                                                                                                    Newmont Mining Corporation I Investor Presentation I Slide 42
Tanami Power improves performance and risk
Progressing Tanami Power project to improve costs, reliability and environmental impact

• Switching to natural gas expected to lower CO2 emissions by up to 20%

• Includes construction and operation of 450km natural gas pipeline and 2 power stations

• Expected to reduce power costs by >20%

                                                                                                            Tanami

January 2018                                             Newmont Mining Corporation I Investor Presentation I Slide 43
Africa expansions maximize value and extend life
From 2020 to 2024, projects will improve*:                                                                         Subika              Ahafo Mill
                                                                        Metrics
                                                                                                                 Underground           Expansion
• Production by ~70% to 550 – 650 Koz/yr                                Production                               150 – 200 Koz       75 – 100 Koz
                                                                        Development capital                      $160 – $200M        $140 – $180M
• CAS by ~20% to $650 – $750/oz                                         First production                           June 2017             H1 2019
                                                                        Commercial production                        H2 2018             H2 2019
• AISC by ~25% to $800 – $900/oz
                                                                        Internal Rate of Return                        >20%               >20%
*Average annual improvement to Ahafo compared to 2016. See Endnote 1   Expected average annual incremental impact (Subika Underground: 2019 – 2023 and
                                                                       Ahafo Mill Expansion: 2020 – 2024). See Endnote 1

                                                                       Expected average for first five years of production.

Ahafo

January 2018                                                                            Newmont Mining Corporation I Investor Presentation I Slide 44
Subika UG - unlocking major underground resource

Reserves and Resource (R&R) base UG only                                                       Upside Potential

• Reserves: 1.5 Moz (11Mt @ 4.5 g/t Au)                                                        • 65% of Inventory converted to R&R

• Resource*: 1.5 Moz (11Mt @ 4.1 g/t Au)                                                       • Four ore shoots, all open at depth
Highlights

• 0.9Moz Reserves and 1.2Moz Resource** additions since 2015 Investor Day

• Mineralization extended 800m below existing Reserves to ~1.4km depth

• Updated geological model leading to better targeting
* Indicated 2Mt @ 4.3 g/t Au (0.3Moz), Inferred 9Mt @ 4.1 g/t Au (1.2Moz). ** Includes Inferred, refer to Endnote 6.
January 2018                                                                                                   Newmont Mining Corporation I Investor Presentation I Slide 45
Quecher Main to extend Yanacocha life to 2027
From 2020 – 2025, Quecher Main delivers:                                                    Metrics                                        Quecher Main

• Yanacocha production ~200 Koz/year*                                                       Production*                                       200 Koz
                                                                                            Development capital                            $250 – $300M
• Average CAS of $750 – $850/oz**
                                                                                            First production                                 early 2019
• Average AISC of $900 – $1,000/oz**                                                        Commercial production                             Q4 2019

• Bridge to development of Yanacocha sulfides                                               Internal Rate of Return                             >10%
* Production represents Yanacocha (100%) from 2020-2025; ** CAS & AISC represent incremental unit costs 2020-2025. See Endnotes 1 and 2.

                                                                                                                              Early Works for Quecher Main

January 2018                                                                                           Newmont Mining Corporation I Investor Presentation I Slide 46
Quecher Main 1.5Moz Reserves and upside potential

                                                  A’

                                         A

Reserve and Resource base (100%)                                                           Upside Potential – Quecher Main

• Reserves: 1.5 Moz (90 Mt @ 0.52 g/t Au)                                                   • Potential extensions to SW and NE

• Resources*: 0.09 Moz (15 Mt @ 0.20 g/t Au)
 Highlights

 • Project falls within existing operational footprint; immediately north of the Chaquicocha oxide pit

 • Gold oxide leach material, close to surface

 • Stage 3 drilling completed, 5,000m
* Resources as used on the page include Indicated (0.03 Moz) and Inferred (0.07 Moz) Resources; numbers may not add due to rounding.

January 2018                                                                                             Newmont Mining Corporation I Investor Presentation I Slide 47
Chaquicocha Central – new high grade discovery

Reserves and Resource (R&R) base 100%                                                      Upside Potential

• Reserves: N/A                                                                             • 70% of Inventory converted to R&R

• Resource*: 2.3 Moz (11Mt @ 6.3 g/t Au)                                                    • Extensions to the E and NNW; Chaqui Sur Oxides
Highlights

• 2.3 Moz Resource additions and 1.5Moz (79Mt @ 0.6 g/t Au) at Yan Verde since 2015 Investor Day

• High grade discovery at Chaqui Central (up to 58m @ 230 g/t Au, 34m @ 278 g/t Au; 14m @ 411 g/t Au)

• More high grade pods possible (i.e., Lola: 11.4m @ 15.9 g/t Au; Lucia: 10.9m @ 27.9 g/t Au; Central Ext)
* Chaqui: Indicated 5Mt @ 7.0 g/t Au (1.1Moz), Inferred 6Mt @ 5.8 g/t Au (1.2Moz), Yan Verde Indicated 71Mt @ 0.65g/t (1.5Moz), Inferred 2Mt @ 0.35g/t (0.03Moz)
January 2018                                                                                              Newmont Mining Corporation I Investor Presentation I Slide 48
Merian – further oxide and UG potential

Reserves and Resource (R&R) base 100%                                                        Upside Potential

• Reserves: 5.7 Moz (141Mt @ 1.3 g/t Au)                                                     • 65% of Inventory converted to R&R

• Resource*: 2.7 Moz (75Mt @ 1.1 g/t Au)                                                     • Extensions, high grade UG, brownfields saprolite
Highlights

• 1.2Moz Reserves and 1.9Moz Resource** additions since 2015 Investor Day

• Additional Reserves and Resource expected in 2017

• Developing additional saprolite at Merian I and UG potential at Merian II
* Measured & Indicated 26Mt @ 1.1 g/t Au (0.9Moz), Inferred 49Mt @ 1.1 g/t Au (1.7Moz). ** Includes Inferred, refer to Endnote 6.
January 2018                                                                                                 Newmont Mining Corporation I Investor Presentation I Slide 49
Long Canyon – advancing Phase 2

Reserves and Resource (R&R) base                                                              Upside Potential

• Reserves: 1.2 Moz (17Mt @ 2.1 g/t Au)                                                       • 75% of Inventory converted to R&R

• Resource*: 2.0 Moz (21Mt @ 3.0 g/t Au)                                                      • Mineralization over 5.0km strike length is open
Highlights

• Resource drilled to Reserves spacing; Reserves and Resource additions pending hydrological study

• Shift focus from support Phase 2 to Resource growth

• Deep Sensing Geochemistry providing guidance on the Eastern Zone
For all graphics and mineralization representations on slides 76 - 88, please refer to Endnote 5. * Primarily Indicated 14Mt @ 3.5 g/t Au (1.6Moz), Inferred 6Mt @ 1.9 g/t Au (0.4Moz)
January 2018                                                                                                  Newmont Mining Corporation I Investor Presentation I Slide 50
$575M Convertible Notes retired on July 17, 2017
                                                                 Net debt as of September 30, 2017
  Newmont Net debt
                                                    1.1x   ~$4.1B        Short and long term debt
to adjusted EBITDA*                0.4x
       improvement                                         ~$3.0B        Cash and cash equivalents
                             Q3 2016      Q3 2017          ~$1.1B        Net debt

Debt Repayment Schedule as of September 30, 2017 ($M)

                      $626                  $992              $600             $874          $1,000

    2017       2018   2019                 2022               2035            2039           2042

January 2018                                               Newmont Mining Corporation I Investor Presentation I Slide 51
Portfolio optimization improves value and risk profile

                                      Divested                               Reinvested

                               PTNNT, Midas,
                                                                          Merian, Long
  Assets                      Jundee, Penmont,
                                                                         Canyon, CC&V
                                   Waihi

  Costs                          $800 – $900/oz                           Below $700/oz                                  AISC down >$100/oz

  Production                       630Koz/year                             ~800Koz/year

  Mine life                           < 5 years                               > 10 years                                     Mine life doubled

                                Higher technical                        Lower technical
  Risk
                                 and social risk                         and social risk

Production and cost data represent expected weighted average calculation based on 5-year outlook estimates; see Endnote 1.

January 2018                                                                                              Newmont Mining Corporation I Investor Presentation I Slide 52
Portfolio optimization nets ~$2.8B cash to date
Cumulative cash generated through asset sales at fair value since 2013 ($M)*
  $3,000

  $2,500

  $2,000

  $1,500

  $1,000

     $500

        $0
                  Oil Sands

                                   Midas

                                                Paladin

                                                                Jundee

                                                                             Penmont

                                                                                            Merian

                                                                                                             Valcambi

                                                                                                                           Waihi

                                                                                                                                          Other

                                                                                                                                                       (19.45%)

                                                                                                                                                                      (48.5%)
                  Canadian

                                                                                                                                                                      PTNNT
                                                                                            (25%)
                                                (5.4%)

                                                                                                                                                         Regis
                                                                              (44%)

*Other divestments include the sale of equipment at Conga and the sale of McCoy Cove in 2014 and the sale of equity interest in Levon Resources, Hemlo mineral rights and Relief
Canyon mining claims in 2015.

January 2018                                                                                                Newmont Mining Corporation I Investor Presentation I Slide 53
Disciplined approach to growth
Priorities:

• Grow margins, Reserves & Resources through coordinated exploration, projects, transactions

• Leverage strong balance sheet and stable cash flow profile through 2024

• Set stage for longer-term growth for 2025 and beyond

Integrated approach
         Higher

                                                                                             Exploration
                                                                                                 JV

                                                                    Brownfields              Greenfields
                                                    Acquire early   Exploration              Exploration
         RISK

                                    Acquire late    stage project
                    Acquire cash    stage project                         Invest in prospective
                    flowing asset                    NEM early            exploration ventures
                                      NEM late      stage project
                       Expand       stage project
          Lower

                     current ops

                  Short-term                         HORIZON                                         Long-term

January 2018                                                        Newmont Mining Corporation I Investor Presentation I Slide 54
Conservative plan with upside leverage
2018 CAS breakdown                            Royalties &                                   Conservative and robust planning process
                                               other 5%
                                                                                            •      Plans built-up from $800/oz case to
                                                                                                   maximize value, optionality
                            Diesel 9%
                                                                                            Potential upside includes:
                      Power 9%                          Labor &
                                                        services                            •     Further cost and efficiency improvements
                                                          45%
                                                                                            •     FX and oil tailwinds
                                 Materials
                                   32%

                                                                                                                                                        Attributable FCF
  Annualized 2018 sensitivities                            2018 Price                           Change                       FCF ($M)
                                                                                                                                                              ($M)

 Gold ($/oz)                                                   $1,200                           +$100                           +$360                           +$335

 Copper ($/lb)                                                 $2.50                            +$0.25                           +$20                            +$20

 Australian Dollar                                             $0.75                            -$0.05                           +$45                            +$45

 Oil ($/bbl)                                                     $55                             -$10                            +$30                            +$25
All other variables held constant (i.e. FCF for flexed gold price does not include changes to Cu price, AUD or WTI); economics assume 35% portfolio tax rate; excludes hedges;
CAS pie chart excludes inventory changes. See Endnote 1

January 2018                                                                                                 Newmont Mining Corporation I Investor Presentation I Slide 55
Prepared for opportunities and challenges
                                                                                Upside
                              $1,200 gold price
               Downside                                          • Maintain cost and capital
                                                                   discipline
                            • Optimize costs & capital
                                                                 • Pursue profitable growth
 • Reduce stripping and     • Finish current projects;
   increase stockpile         progress projects with                 − Highest return
   processing                 best returns                             projects
 • Complete current         • Pursue high grade,                     − Most promising
   projects                   near-mine exploration                    exploration prospects
 • Mothball lowest margin     prospects
                                                                 • Accelerate debt
   operations               • Reduce support costs                 repayment
 • Reduce exploration         across business
                                                                 • Pay higher dividends in
                            • Evaluate early debt                  line with policy
 • Discontinue early debt
   repayments                 repayment

 • Re-evaluate dividend     • Pay dividend at Board’s
                              discretion

January 2018                                        Newmont Mining Corporation I Investor Presentation I Slide 56
Fundamentals support stronger gold pricing
• Mine supply expected to marginally decline by ~1% annually through 2021

• Top 10 gold producers reduce developmental capital spending by >80% since 2012

• Lack of funding, exploration success diminishes organic project pipelines across industry

Average gold discovered (Moz) and                                                           ETF holdings (Moz) and gold price ($/oz)
Exploration spend ($B)                                                                     100                                                                $1,750
125                                                                          $10
                                                                                                                                                              $1,500
                                                                                             75
100                                                                          $8                                                                               $1,250

                                                                                                                                                              $1,000
  75                                                                         $6              50
                                                                                                                                                              $750
  50                                                                         $4
                                                                                                                                                              $500
                                                                                             25
  25                                                                         $2                                                                               $250

                                                                                               0                                                              $0
    0                                                                        $0                      2012     2013      2014     2015     2016      2017
           1997

                              2003

                                                 2009

                                                                   2015

*Sourced   from Bloomberg and SNL Financial – trailing 3-year average gold discovered through exploration

January 2018                                                                                                Newmont Mining Corporation I Investor Presentation I Slide 57
Capacity for demand growth in China and India
    • China and India represent ~55% of global consumer gold demand

    • Per capita consumption relatively low – economic growth, increasing wealth support demand growth

    Per capita gold consumption (average grams per capita)1                                                                                                                                                                         2017 consumption2
7

6                                                                                                                                                                                                                                                                    G7,
                                                                                                                                                                                                                                                                                             Middle
                                                                                                                                                                                                                                                                     13%
                                                                                                                                                                                                                                                                                             East,
5                                                                                                                                                                                                                                   China,
                                                                                                                                                                                                                                                                                              8%
                                                                                                                                                                                                                                     34%
4
                                                                                                                                                                                                                                                                            Other,
3                                                                                                                                                                                                                                                                            25%
                                                                                                                                                                                                                                                India,
                                                                                                                                                                                                                                                 21%
2

1

-
                                          Kuwait

                                                                                                                                                                                                                            Egypt
                Hong Kong
                            Switzerland

                                                               Saudi

                                                                                                                                                                                                                                                                                             Brazil
                                                                       Germany

                                                                                          Austria

                                                                                                                      China

                                                                                                                                                 Sri Lanka
                                                                                                                                                             India

                                                                                                                                                                                            South Korea
                                                                                                                                                                                                          Canada

                                                                                                                                                                                                                                    Indonesia
                                                                                                                                                                                                                                                Italy
                                                                                                                                                                     USA

                                                                                                                                                                                      UK
                                                                                                    Thailand
                                                                                                               Iran

                                                                                                                                        Taiwan

                                                                                                                                                                                                                                                        Pakistan

                                                                                                                                                                                                                                                                            Spain
                                                                                                                                                                                                                                                                                    Mexico

                                                                                                                                                                                                                                                                                                      Japan
                                                                                                                              Vietnam
          UAE

                                                   Singapore

                                                                                 Turkey

                                                                                                                                                                           Malaysia

                                                                                                                                                                                                                   Russia

                                                                                                                                                                                                                                                                   France
    1 Source:  CIA World Factbook (2017); per capita demand based on 2017 demand through Q3
    2   2017 consumer gold demand (jewelry, bars and coins); consumption through Q3 (Source: World Gold Council)

    January 2018                                                                                                                                                                           Newmont Mining Corporation I Investor Presentation I Slide 58
Balanced copper fundamentals
 • Strong refined copper demand in China to continue (>45% of annual global demand)

 • Relatively balanced market conditions expected through 2022

  Chinese refined copper demand (Kt)1                                        Copper market balance (Kt)1

13,000                                                                     600

                                                                           400

12,000
                                                                                                                                            Surplus
                                                                           200

                                                                              0
11,000

                                                                           (200)

                                                                                                                                            Deficit
10,000                                                                     (400)
                                   2018E

                                           2019E

                                                   2020E

                                                           2021E

                                                                   2022E
            2015

                     2016

                            2017

                                                                                                                  2018E

                                                                                                                           2019E

                                                                                                                                    2020E

                                                                                                                                             2021E

                                                                                                                                                      2022E
                                                                                   2015

                                                                                               2016

                                                                                                        2017
 Source: ICMR (Dec 2017)

  January 2018                                                                            Newmont Mining Corporation I Investor Presentation I Slide 59
2017 Outlooka
                                                                                             Consolidated
                                                                                                 All-in          Consolidated
                           Consolidated              Attributable            Consolidated     Sustaining         Total Capital   a2017   Outlook in the table are considered “forward-looking
                            Production               Production                  CAS            Costsb           Expenditures
                                                                                                                                 statements” and are based upon certain assumptions,
                             (Koz, Kt)                (Koz, Kt)               ($/oz, $/lb)    ($/oz, $/lb)           ($M)
   North America
                                                                                                                                 including, but not limited to, metal prices, oil prices, certain
   Carlin                   935      –   1,000       935   –       1,000     775   –   825     980   –   1,040   165   –   185   exchange rates and other assumptions. For example, 2017
   Phoenixc                 200      –   220         200   –       220       875   –   925   1,070   –   1,130    25   –   35    Outlook assumes $1,200/oz Au, $2.50/lb Cu, $0.75 USD/AUD
   Twin Creeks
               d
                            370      –   400         370   –       400       560   –   610     675   –   725      45   –   55    exchange rate and $55/barrel WTI; AISC and CAS estimates
   CC&V                     420      –   470         420   –       470       560   –   610     680   –   730      30   –   40    do not include inflation, for the remainder of the year.
   Long Canyon              130      –   170         130   –       170       380   –   430     405   –   455      10   –   20    Production, CAS, AISC and capital estimates exclude projects
   Other North America                                                                                            15   –   25
                                                                                                                                 that have not yet been approved. The potential impact on
   Total                  2,080 – 2,240          2,080 – 2,240               675 – 725        855 – 930          280   –   360
                                                                                                                                 inventory valuation as a result of lower prices, input costs, and
   South America                                                                                                                 project decisions are not included as part of this Outlook.
   Yanacochae               530 – 560                260 – 300               945 – 995       1,200 – 1,270        35 – 55        Such assumptions may prove to be incorrect and actual
   Merian                   470 – 520                350 – 390               500 – 540         560 – 610          85 – 125       results may differ materially from those anticipated. See
   Other South America                                                                                                           cautionary note on slide 2.
   Total                  1,000 – 1,080              630 – 690               725 – 775        965 – 1,025        120 – 175       bAll-in sustaining costs or AISC as used in the Company’s

   Australia                                                                                                                     Outlook is a non-GAAP metric defined as the sum of costs
   Boddington               735 – 785                735 – 785               700 – 750        820 – 870           75 – 85        applicable to sales (including all direct and indirect costs
   Tanami                   405 – 480                405 – 480               575 – 645        785 – 855          110 – 120       related to current production incurred to execute on the
             f
   Kalgoorlie               375 – 425                375 – 425               585 – 635        665 – 715           15 – 25        current mine plan), reclamation costs (including operating
   Other Australia                                                                                                               accretion and amortization of asset retirement costs), G&A,
   Total                  1,520 – 1,695          1,520 – 1,695               640 – 690        795 – 855          205 – 240
                                                                                                                                 exploration expense, advanced projects and R&D, treatment
   Africa
                                                                                                                                 and refining costs, other expense, net of one-time
   Ahafo                    315 – 345                315 – 345               820 – 875        965 – 1,045        150 – 185       adjustments and sustaining capital. See reconciliation on slide
   Akyem                    455 – 485                455 – 485               535 – 575        655 – 705           30 – 40        70
   Other Africa                                                                                                                  cIncludes Lone Tree operations.
   Total                    775 – 835                775 – 835               655 – 705        830 – 880          180 – 220       dIncludes TRJV operations.
                                                                                                                                 eConsolidated production for Yanacocha and Merian is
   Corporate/Other                                                                                                15 – 20
   Total Gold
              g
                          5,400 – 5,800          5,000 – 5,400               675 – 715        900 – 950          890 – 990
                                                                                                                                 presented on a total production basis for the mine site;
                                                                                                                                 attributable production represents a 51.35% interest for
   Phoenix                   10 – 20                  10 – 20                1.75 – 1.95      2.20 – 2.40                        Yanacocha and a 75% interest for Merian.
                                                                                                                                 fBoth consolidated and attributable production are shown on a
   Boddington                30 – 40                  30 – 40                1.30 – 1.50      1.60 – 1.80
   Total Copper              40 – 60                  40 – 60                1.45 – 1.65      1.85 – 2.05                        pro-rata basis with a 50% ownership for Kalgoorlie.
                                                                                                                                 gProduction outlook does not include equity production from
                                          h
   Consolidated Expense Outlook                                                                                                  stakes in TMAC (28.8%) or La Zanja (46.94%).
   General & Administrative                      $     215     –   $ 240                                                         hConsolidated expense outlook is adjusted to exclude
   Interest Expense                              $     210     –   $ 250
   Depreciation and Amortization                 $   1,225     –   $ 1,325
                                                                                                                                 extraordinary items. For example, the tax rate outlook above
   Advanced Projects & Exploration               $     325     –   $ 375                                                         is a consolidated adjusted rate, which assumes the exclusion
   Sustaining Capital                            $     575     –   $ 675                                                         of certain tax valuation allowance adjustments.
   Tax Rate                                           28%      –     34%

January 2018                                                                                                                     Newmont Mining Corporation I Investor Presentation I Slide 60
2018 Outlooka
                                                                                 Consolidated
                                                                                     All-in        Consolidated
                       Consolidated        Attributable          Consolidated     Sustaining       Total Capital      a2018
                        Production         Production                 CAS           Costs b        Expenditures
                                                                                                                              Outlook in the table are considered “forward-looking
                         (Koz, Kt)           (Koz, Kt)            ($/oz, $/lb)    ($/oz, $/lb)         ($M)           statements” and are based upon certain assumptions,
North America                                                                                                         including, but not limited to, metal prices, oil prices, certain
Carlin                  950   –   1,015    950   –   1,015       775   –   825   980   –   1,040   155   –   190      exchange rates and other assumptions. For example, 2018
Phoenix c               210   –   230      210   –   230         810   –   860   990   –   1,050    20   –   30       Outlook assumes $1,200/oz Au, $2.50/lb Cu, $0.75
Tw in Creeks d          340   –   370      340   –   370         675   –   725   835   –   885      55   –   65
CC&V                    345   –   395      345   –   395         875   –   935   965   –   1,025    20   –   30
                                                                                                                      USD/AUD exchange rate and $55/barrel WTI; AISC and
Long Canyon             130   –   170      130   –   170         510   –   560   605   –   655      10   –   20       CAS estimates do not include inflation. Production, CAS,
Other North America                                                                                 10   –   20       AISC and capital estimates exclude projects that have not
Total                 2,010 – 2,170       2,010 – 2,170          760 – 810       945 – 1,020       270   –   350      yet been approved. The potential impact on inventory
South Am erica                                                                                                        valuation as a result of lower prices, input costs, and
Yanacochae              470 – 545          240 – 280             975 – 1,025 1,205 – 1,275         110 – 140          project decisions are not included as part of this Outlook.
Merian                  485 – 540          365 – 405             455 – 495     580 – 630            55 – 95           Such assumptions may prove to be incorrect and actual
Other South America
Total                   970 – 1,070        615 – 675             705 – 765       945 – 1,045       170 – 230
                                                                                                                      results may differ materially from those anticipated. See
                                                                                                                      cautionary note on slide 2.
Australia                                                                                                             bAll-in sustaining costs or AISC as used in the Company’s
Boddington              665 – 715          665 – 715             820 – 870       950 – 1,000        60   –   75
Tanami                  440 – 515          440 – 515             535 – 605       705 – 775          95   –   120      Outlook is a non-GAAP metric defined as the sum of costs
Kalgoorlief             390 – 440          390 – 440             580 – 630       695 – 745          20   –   30       applicable to sales (including all direct and indirect costs
Other Australia                                                                                      5   –   15       related to current production incurred to execute on the
Total                 1,530 – 1,670       1,530 – 1,670          675 – 725       830 – 890         185   –   230      current mine plan), reclamation costs (including operating
Africa                                                                                                                accretion and amortization of asset retirement costs), G&A,
Ahafo                   435 – 465          435 – 465             710 – 765       875 – 955         195 – 240          exploration expense, advanced projects and R&D,
Akyem                   380 – 410          380 – 410             640 – 680       765 – 815          30 – 40
                                                                                                                      treatment and refining costs, other expense, net of one-
Other Africa
Total                   815 – 875          815 – 875             680 – 730       865 – 925         225 – 275          time adjustments and sustaining capital. See reconciliation
                                                                                                                      on slide 71.
Corporate/Other                                                                                     10 – 15           cIncludes Lone Tree operations.
Total Goldg           5,300 – 5,800       4,900 – 5,400          700 – 750       965 – 1,025       900 – 1,000
                                                                                                                      dIncludes TRJV operations.

Phoenix                  10 – 20            10 – 20              1.50 – 1.70     1.85 – 2.05                          eConsolidated production for Yanacocha and Merian is
Boddington               30 – 40            30 – 40              1.75 – 1.95     2.05 – 2.25                          presented on a total production basis for the mine site;
Total Copper             40 – 60            40 – 60              1.65 – 1.85     2.00 – 2.20
                                                                                                                      attributable production represents a 51.35% interest for
                                                                                                                      Yanacocha and a 75% interest for Merian.
                                                                                                                      fBoth consolidated and attributable production are shown
2018 Consolidated Expense Outlookh
General & Administrative              $   215    –   $   240                                                          on a pro-rata basis with a 50% ownership for Kalgoorlie.
Interest Expense                      $   175    –   $   215                                                          gProduction outlook does not include equity production from
Depreciation and Amortization         $ 1,225    –   $   1,325
Advanced Projects & Exploration       $   350    –   $   400                                                          stakes in TMAC (28.8%) or La Zanja (46.94%).
                                                                                                                      hConsolidated expense outlook is adjusted to exclude
Sustaining Capital                    $   600    –   $   700
Tax Rate                                 28%     –       34%                                                          extraordinary items. For example, the tax rate outlook
                                                                                                                      above is a consolidated adjusted rate, which assumes the
                                                                                                                      exclusion of certain tax valuation allowance adjustments.

January 2018                                                                                                       Newmont Mining Corporation I Investor Presentation I Slide 61
You can also read