Investor Presentation - November, 2017 - EG A/S
←
→
Page content transcription
If your browser does not render page correctly, please read the page content below

Investor Presentation

November, 2017

Agenda

                                              Page

 Transaction summary                             2

 Introduction                                   5

 Key credit highlights and company overview      9

 Financial information                          19

 Summary                                        23

 Risk factors                                   25

                                                     5
Today’s presenters
Mikkel Bardram
CEO, EG
Joined EG as CEO in November 2016
Mikkel comes from a position as CEO for Satair Group SAS. He previously held other executive positions at Satair A/S
Solid background in IT from the likes of McKinsey & Company, Novozymes and MAS/IBM
MSc in International Marketing Management (cand.merc.), Copenhagen Business School, including a term at Texas MBA (Austin)
Christian Bamberger Bro
Partner, Axcel
Joined Axcel in 2014
Previously worked for Permira both in London and Stockholm (2006-2014), McKinsey in Copenhagen and Nordea Corporate
finance in Copenhagen
Deputy Chairman at EG, Conscia and Lessor
Cand. oecon. from the University of Aarhus
Source: EG, Axcel
6
EG is a leading Scandinavian technology company
EG focuses on selected industries in the Scandinavian technology market where EG has in-
depth industry and value chain insight
In brief
EG is among Scandinavia's leading technology companies with a strong market position within
the SME segment
Position based on close relationships with customers, deep industry insight and value adding
technology solutions
27 acquisitions in selected verticals since 2009
Axcel acquired EG in 2013
Strong presence in Scandinavia Product offering¹ Financial development, DKKm
Local presence with 25 offices throughout
Scandinavia Software and subscription based
Strong footprint securing proximity and flexibility revenue 2,500 20.0%
55%
towards customers Solutions are based on EG's own 2,013
software for the public and for the 15.9%
Group management located in Ballerup, Denmark 2,000
private sector 1,611 15.0%
Subscription based services are focused 12.1%
on application and infrastructure 1,500
managed services 9.4%
10.0%
1,000 924
78% Consultancy & programming
Management consultancy, 5.0%
Implementation and Programming of IT 41% 500
solutions
12% 0 0.0%
Hardware 2009 2013 LTM Q3 2017
Sale of infrastructure hardware (e.g.
servers) and industry specific hardware 4%
10% (e.g. POS and hand terminals) from
Revenue excl. KY, reported
external providers
EBITDA margin excl. KY, normalized
Offices
1) Per LTM Q3 2017 excl. KY
7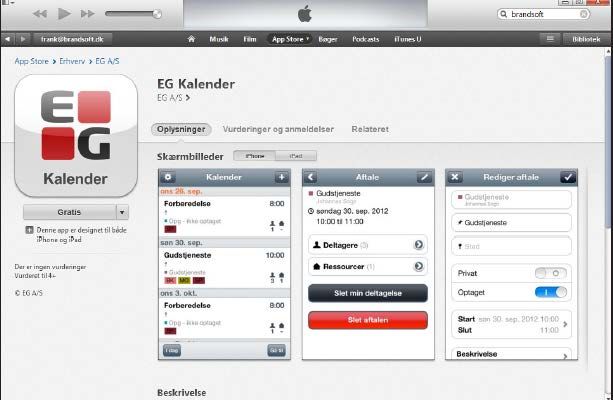
Market drivers and trends in the Scandinavian IT and
Enterprise Applications market
Five primary market drivers expected to impact IT spending
Scandinavian IT market growth1 Market drivers
EURbn
Productivity enhancements
+2.9% Almost 50% of companies and organizations have productivity as a top business priority
38.6
This fuel process optimization both in the business and in the IT department
2.2
34.5 0.9 Especially mobility spending is driven by productivity
1.0
11.3
Digital business transformation
Denmark 10.3
Digital transformation is on the agenda for 25%-30% of companies and organizations in
the Nordic, and is rapidly becoming more important
9.2 Most transformation initiatives have an internal focus to optimize and automate processes
Norway 8.3 and improve the usability for internal users
Transformation drives spending in infrastructure and application modernization (including
ERM and cloud) as more agility and flexibility is needed
Customer experience
18.1 One in four Nordic companies or organizations focuses on customer experience. If
Sweden 15.9
including the companies focusing on improving customer support and service, the number
is even higher
The customer focus drives spending in dedicated customer experience solutions and CRM,
2015 Denmark Norway Sweden 2019 but also business intelligence and social technologies
Data explosion and leverage
Virtually all companies and organizations acknowledge that the growth in data volumes
Scandinavian IT market
and formats have an impact on their business
The Scandinavian IT market is expected to grow with a Dealing with the growing amounts of data propel infrastructure investments and process
CAGR of 2.9% from 2015 to 2019 re-assessment, but leveraging the data to bring value to the business requires analytics
The market growth is expected to vane, as hardware tool including big data
spending will plateau and especially the outsourcing Internet of Things is also emerging as a related driver
market being squeezed by the adoption of cloud and the
need for increased flexibility IT operations efficiency
Although companies/organizations increasingly are expected to drive business
The Swedish market has shown the strongest growth in
development and transformation, efficient IT operations remains essential
recent years. This is expected to continue towards 2019
Ensuring efficiency – and often even reducing cost – calls for process automation and
although the gap to Denmark and Norway will diminish.
user self-service, and drive spending in cloud, and hosting services rather than hardware
All in all, the Danish market will be most stable
An essential part of the IT operations, is security
1) IT market excl. feature phones, smartphones, and consumer IT spending. Source: IDC, Public Cloud Service Tracker, May 2016 & IDC Software Survey 2016 & IDC Nordic CxO Survey 2016
8
Agenda

                                              Page

 Transaction summary                             2

 Introduction                                    5

 Key credit highlights and company overview     9

 Financial information                          19

 Summary                                        23

 Risk factors                                   25

                                                     9
Key credit highlights

                             6                    1
                                                          Leading
                                  Strong and
                                                       Scandinavian
                                  supportive
                                                        technology
                                  ownership
                                                         company

          5                                                           2
                High recurring
              business with low                                           Unique EG owned
              capex needs going                                               software
                   forward

                              4                   3
                                    Diversified         Full life cycle
                                  customer base       service solutions

                                                                                            10
X.
1 Leading Scandinavian technology company

EG’s strong market position is based on deep industry knowledge and a growing scope of
technologies and services for over 40 years
Deep industry/customer knowledge (examples)                                 Strong technology, products and expertise

                                                                                                                          CUSTOMER ENGAGEMENT
                                                                                                 MANAGEMENT
                                                                                                 CONSULTANCY              MANAGEMENT &
                                                                                                                          BUSINESS ANALYTICS
  Manufacturing          Retail             Fashion           Transport

                                                                                                                           BUSINESS
                                                                                                            BUSINESS
                                                                                                                           DECISION
                                                                                                            STRATEGY
                                                                                                                           MAKING
                                                                                     BUSINESS
                                                                                    SOLUTIONS                                                      COLLABORATION
                                                                                                    DAILY
                                                                                                  BUSINESS         INDUSTRY       PRODUCTIVITY
                                                                                                 OPERATIONS         INSIGHT

   Healthcare         Construction    Public Pay-roll & HR    Utilities
                                                                                                   INSTANT
                                                                                                   WORK &                               ROI &
                                                                                                  FLEXIBILITY                         EFFICIENCY

                                                                                                                          RELIABILITY
                                                                                                           SCALABILITY      & RISK
                                                                                     MOBILITY               FLEXIBILITY   REDUCTION                  BUSINESS
                                                                                                                                                     SERVICES

 Finance for public   Social sector    Local authorities        Media

                                                                                                 IT OPERATIONS                    SERVICE &
                                                                                                INFRASTRUCTURE                    SUPPORT

   Cemeteries         Housing &         Legal Solutions      Hairdressers    1977    1985       1990            1995       2000             2005      2010         2017
                       Property
                                                                                                                Built over time

                                                                                                                                                                          11
x.
1 EG supplies its solutions through two business models

EG has built strong capabilities both as a software and as a service company

                                                                               12
x.
2 Unique EG owned software
EG have a strong base of unique EG owned software solutions targeted at specific verticals
100+ unique EG owned software solutions Example: EG Brandsoft
Examples
EG Brandsoft is a full suite software as a service for
Private sector verticals churches, cemeteries and funeral homes
Manufacturing & construction Retail, media & fashion
Process Industry solution for D365 Aspect 4 8 in 10 tombs in Denmark are registered in the platform
Project industry solution for D365 NAV Media
Aspect 4 NAV Fashion More than 15 different modules for various administrative
Dynaway Fackta POST tasks
NAV Construction
EG Byg Transportation & services
Aspect 4 ERP
Brandsoft calendar for activities in the
Utilities
Parish in App Store & Google Play
Xellent
Zynergy
Private sector micro verticals
Rental & housing Churches & cemeteries Hairdressers
EG Bolig EG Brandsoft Hairtools
Car repair shops Doctors & practitioners Lawyers & agencies
Xena EG Healthcare EG Legal
Public sector verticals
Municipalities Hospitals
SD Løn KommuneInformation
SD Tjenestetid EG Healthcare
KommuneInformation
Team Online
EG Brandsoft
133 Full life cycle service solutions
Services business driven by customized solutions for specific industry areas across the
entire customer life cycle. This drives repeatability and reduces project risk
Comments Retail solution map (example)
1.
1 EG has predefined
business process models 3 4
Services
for each of our focus Assortment mgmt. Invoicing CRM Business Intelligence
verticals
Concepts Web shop & internet Channel mgmt. Campaign mgmt. Purchasing Support
2.
2 Different platform Loyalty & clubs Document mgmt. Data mgmt.
options exist to fit with Hosting & maintenance
customer size and Cash handling
Self service &
Customer counting Handheld terminals
business context scanning
POS Hardware & on-site
Electronic shelf fronts Staff planning Fraud detection
delivery
3.
3 Numerous proven and 2
tested modules are
combined to provide the Platform Field service
customers with a
competitive edge 1
EG Retail Category Sourcing &
OMNI
Store operations
process model
Retail logistics channels
management procurement & support
4.
4 Services exist for each
vertical which ensures EG
takes care of the
customer’s full life cycle
Process models and solution maps exists for 8 verticals; Process industry, Project Manufacturing, Utility,
Retail, Fashion, Financial Services and Professional Services
144 Diversified customer base with high customer satisfaction
Low dependency on single customers with more than 12,500 customers across three
countries and a high customer satisfaction
Comments Largest customer share of revenue¹
EG has a diversified
DKKm 1,950 549 397 116 159 460 270
customer base covering 100%
more than 12,500 13% 18%
21%
5% 28%
customers across three 48%
38% 5%
8% 50%
countries
12%
12%
There is low customer 13%
82% 21% 77%
concentration and top 10 72%
59%
customers account for 13% 50%
40%
of revenue per LTM August 29%
2017
Total Manufacturing Retail, media Utility Transportation Public Microverticals
& Construction & fashion & services
Narrow verticals such as
Utility, Transportation & Top 10 largest Top 11-20 largest Others
Services and Public will
naturally have higher
customer concentration as Customer satisfaction²
there are fewer companies
to service in these verticals
Customer satisfaction is
66 70
generally increasing
+4
2016 2017
1) LTM per August 2017, excluding Kombit A/S, 2) Customer satisfaction measured on 0-100 scale, where 0 is the lowest and 100 largest satisfaction
15x.
5 High recurring business with low capex needs going forward
Focus on integration of acquisitions and strict cost control
Comments High share of recurring revenue
The increase in recurring
revenue from 2015 to
2016 is mainly driven by 2015 2016 Q3 2017
the acquisition of
Silkeborg Data Recurring
37%
46% 51% 49% Non-recurring
54%
63%
EG has had several capex
intensive Software and
Development projects
during 2016 and 2017
which will soon be Capex intensive software and development projects from 2016 and 2017 soon finalised
finalised, leading to a
strong cash generation in DKKm
2018 150 144 8%
7%
With a high share of
6%
recurring revenue the 95
100
lower capex spend for 5%
Capex
2018 can provide a higher expected
4% 4% 4%
cash EBITDA 60 63 around 2-3%
of revenue
50
Cash conversion¹ is 2%
estimated to
increase from the range
of 53% - 69% in 2014 – 0 0%
2017 to more than 80% 2014 2015 2016 FC 2017 2018E
in 2018 69% 53% 63% >80%
Cash conversion 66%
Capex (software & development) Capex in % of revenue
1) Cash conversion: (reported EBITDA (excl. KY) less capex) / reported EBITDA (excl. KY). Source: EG financial reports, company data
16x.
6 Strong and supportive ownership
Axcel has a strong track record of value creation from more than 40 investments drawing
on +20 years of experience
Selected investments Axcel in brief
Founded in 1994, Axcel is a Nordic private equity firm investing in mid-market businesses based in the Nordics
Focus on industrials, business services, IT & technology, and consumer & retail
Sector
Axcel has raised five funds with total committed capital of EUR 1.8bn to date from both Danish and international
High-tech slaughter
equipment investors. Axcel is currently investing out of fund V with a committed capital of EUR 550m
Sales: EG sits in Axcel’s Fund IV with a committed capital of EUR 485m
DKK 1,300m (2016)
Investment date Axcel currently owns ten companies with combined annual revenue of around EUR 1.2bn and some 5,800 employees
August 2016
Axcel has completed 47 platform investments, more than 90 major add-on investments and 38 exits
First class board members
Sector
IT infrastructure Martin Lippert Klaus Holse
• EG Board member since 2013 • EG Chairman since 2013
solutions • Position: CEO of Broadnet. Board • Position: CEO of SimCorp, Chairman
Sales: member of Halberg Holding of Lessor, Board member of Better
DKK 800m (2016) Right industry • Background: CEO of TDC Operations, Collective
Investment date Member of TDC group management, • Background: Corporate Vice
experts for EG
May 2015 Head of TDC Bedrift, CEO of Mach President at Microsoft with
• MSc in Economics and PhD in responsibility for Western Europe
Economics from Aarhus University • Master’s degree in Computer Science
from University of Copenhagen
Sector Investments are supported by the
Manufacturer of AXCELerating Value Creation framework
jewellery
Sales:
DKK 9bn (2013)
Investment date
AXCELerating Value Creation Strategy
March 2008
Value levers
Operational backbone
Source: Axcel
17Strategic themes
Three overarching strategic themes
Accelerate organic growth
1
Continue to develop and deepen industry solutions based on EG software, EG services and 3rd party
solutions
Maintain and improve high customer satisfaction
Engage more broadly with existing customers and add more customers within existing verticals
2 Improve efficiency
Strengthen commercial and operational excellence
Strengthen nearshore/offshore capacity
Standardize software and service solutions to increase repeatability
3 Expand presence
Continue acquisitions to strengthen position in software business
Utilize proprietary software solutions (EG IP) to expand EG footprint in Sweden & Norway, and
increase EG IP revenue through channels in rest of world
18Agenda
Page
Transaction summary 2
Introduction 5
Key credit highlights and company overview 9
Financial information 19
Summary 23
Risk factors 25
19Income statement
Q3 Q3 YTD LTM Q3 Development of key income statement items (DKKm)
DKKm
2016 2017 2017 2017 400 20%
354
Revenue 459 446 1,393 1,935 320
300 282 16%
Gross profit 363 352 1,033 1,446 229
12%
EBITDA 102 45 -48 21 200
8%
EBITDA, excl. KY 106 45 145 242 100 4%
Normalizations: 0 0%
Acquisition/sale of 2014 2015 2016 LTM Q3 2017
0 0 0 27
activities/companies¹
Normalized EBITDA, excl. KY Normalized EBITDA margin, excl. KY
Restructuring expenses 6 4 13 38
Transaction & integration Comments
0 9 12 14
costs LTM revenue (excl. KY) is DKK 2,013m
Normalizations, total 7 13 24 78 LTM reported EBITDA (excl. KY) is DKK 242m
and LTM normalised EBITDA is DKK 320m
Normalized EBITDA 109 57 -24 99
Reported revenue for Q3 2017 is DKK 446m, compared to DKK 459m for
Normalized EBITDA, excl. KY 113 57 169 320 Q3 2016, there is a slight increase in reported revenue from Q3 2016 to
Q3 2017 if Q3 2016 is adjusted for KY
Normalized EBITA 92 34 -86 18
Reported EBITDA for Q3 2017 is DKK 45m. Adjusted for one-off income in
Normalized EBITA, excl. KY 96 34 107 239 Q3 2016 and non-recurring costs in Q3 2017 reported EBITDA was at the
same level in Q3 2016 and Q3 2017
1) Acquired companies may not have prepared interim financial statements to the same accounting principles as EG.
Normalizations of acquired companies under “Acquisitions/sale of activities” is therefore estimated on the basis of the Q3 2017 is not affected by KY, as the company made the projected
financial due diligence performed in connection with the acquisition.
provisions on this project in connection with Q2 2017 accounts
The company has in recent months had a good order intake which is
expected to affect the organic growth in the service business in the
future. The software business continues to develop positively, which is
also expected in the future
20Cash flow statement
Selected items from the cash flow statement Comments
The company’s cash flow from operating activities before financial items
amount to DKK 100m. After payment of interest, cash flow from ordinary
DKKm Q3 2016 Q3 2017
activities amount to DKK 16m. Cash flow from operating activities amount
Cash flows from operating activities: to DKK 14m
Cash flow from operating activities before 154 100 Cash flow from investing activities amount to DKK -262m, primarily
financial items covering acquisitions, investment in product and software development
and investment in technical equipment
Cash flow from ordinary activities 76 16
Cash flow from financing activities amount to DKK 204m
Cash flow from operating activities 60 14
Change in liquidity for the year amount to DKK -45m
The company’s net cash amounted to DKK -42m at 30 September 2017
Cash flow from investing activities -138 -262
Cash flow financing activities 4 204
Change in liquidity for the year -74 -45
Cash 1 January 91 3
Cash 30 September, net 17 -42
21Balance sheet
Selected balance sheet items Comments
The company’s non-current assets amounts to DKK 2,036m, primarily in
DKKm Q3 2016 Q3 2017 the form of goodwill and other intangible assets acquired in connection
with company acquisitions
Non-current assets 2,132 2,036
The company reported a negative working capital of DKK -317m. The
Inventory 8 6 increase in reported net working capital is affected by a reversal of work
in progress, penalties to the customer and payment of costs for the
Trade receivables 223 320 remainder of the contract term
Contract work in progress 96 19 The company's net interest-bearing debt at the end of Q3 was
DKK 1,642m
Prepaid rent and deposits 11 13
The company’s equity as at 30 September 2017 amounted to DKK -143m
Other receivables 77 42
compared to DKK 128m as at 31 December 2016
Prepayments 41 37 In contract work in progress for Q3 2016, KY is included with DKK 60m
Trade payables -103 -95 In other payables for Q3 2017, KY is included with DKK 88m
Other payables -318 -513
Accruals -104 -146
Provision
Reported NWC -69 -317 Hedge Retained
Equity dev. Total
accounting earnings
projects
Equity as at 31
Cash 17 -42 -17 112 33 128
December 2016
Bank loan -300 -500 Total income for the
0 0 -271 -271
year
Bond debt -1,100 -1,100 Equity as at 30 Sept
-17 112 -237 -143
2017
Tax payable -20 0
Interest-bearing net debt -1,403 -1,642
22Agenda
Page
Transaction summary 2
Introduction 5
Key credit highlights and company overview 9
Financial information 19
Summary 23
Risk factors 25
23Summary
Leading Scandinavian technology company
Full life cycle service solutions
Unique in vertical focus and deep sector knowledge
Broad diversification across geographical, markets, technologies and customers
Large share of recurring business
High cash conversion
Experienced management team and strong and supportive ownership
24Agenda
Page
Transaction summary 2
Introduction 5
Key credit highlights and company overview 9
Financial information 19
Summary 23
Risk factors 25
25Risk Factors
Risk factors in general
Prospective investors should carefully consider the risks described below before making an investment decision. Since the Issuer is highly dependent on the performance of the Group, the following risk
factors relate to the Group, rather than only to the Issuer. The risks described below are not the only risks facing the Group. Investment in the Bonds involves a high degree of risk and to the extent
any of the risks described below have a material adverse effect on the Group’s business, Bondholders may lose all or part of their original investment.
The Issuer believes that the factors described below represent the principal risks inherent in the Group’s business and in investing in the Bonds. The Issuer does not represent that the statements
below regarding the risks of holding the Bonds are exhaustive. Additional risk factors not presently known, or that are currently deemed immaterial, may also render the Issuer unable to pay interest,
principal or other amounts on or in connection with the Bonds.
RISK FACTORS IN GENERAL
All of these factors are contingencies which may or may not occur and the Issuer is not in a position to express a view on the likelihood of any such contingency occurring. It is not possible to quantify
the significance of each individual risk factor, as each risk described below may materialize to a greater or lesser degree, or may have unforeseen consequences. The risk factors are not listed in any
order of priority with regard to significance or likelihood of occurrence.
Prospective investors should also read the detailed information regarding the Group, its business and industry in general as set out elsewhere in this Company Description, in the Issuer’s annual report,
other financial reports, investor presentations and otherwise available to the investors in order to reach their own views prior to making any investment decision with respect to the Bonds. Prospective
investors are recommended to seek independent advice concerning legal, accounting and tax issues relating to the specific circumstances of individual investors before deciding whether or not to invest
in the Bonds.
Investors should be aware that the Bonds are exposed to market conditions of a general nature. Accordingly, the market price of the Bonds may be influenced by, for example, economic factors that
cannot be foreseen at the time of investment. Investors should be aware that the number of Bonds in circulation may fluctuate over the term of the Bonds and that the marketability of the Bonds in the
secondary market may change over the term of the Bonds, thus limiting investors’ ability to sell the Bonds. In conducting its business activities, the Group assumes risks of a varying nature, any and all
of which may affect the Group's performance and the value of the Bonds.
Each of the risks set out below applies equally to the Issuer and the Group and the occurrence of any of the following risk factors may materially and adversely affect the Group's business, results of
operations or financial condition and consequently have a negative effect on the Issuer and its ability to meet its respective obligations under the Bond Agreement.
Intra-group dependencies
A significant part of the Issuer’s assets are comprised of its shareholdings in its subsidiaries. The Issuer has limited income and a significant part of the Issuer’s income derives from dividends
distributed by its subsidiaries. The Issuer and its ability to pay interest, principal and other amounts under financial indebtedness are therefore dependent on the capacity of the Group to generate
earnings and distribute these within the Group.
Global Economy
The Group operates primarily in Denmark, Norway and Sweden and to a certain extent also worldwide, particularly with Scandinavian based global companies. The Group's operations and performance
depend on economic conditions and the effects thereof on and within the Manufacturing & Construction, Retail, Media & Fashion, Utility, Transportation & Service Public sectors and the selected
Microverticals sectors in Division Business Ready Solutions (e.g. Healthcare, Housing & Property, Hairdressers, Cemeteries, Legal Solutions).
26Risk Factors - continued
Risks related to the business
Uncertainty about global economic conditions poses a risk as consumers and businesses may postpone or reduce spending in response to tighter credit, negative financial news or declines in income or
asset values and other macroeconomic factors, which could have a material negative effect on demand for the Group’s software, services and products. The Group's revenues and gross margins are
dependent upon demand for the Group’s software, services and products and if this demand declines or the margins decline, it could have a material adverse effect on the Group’s business, results of
operations or financial condition.
The economic environment, pricing pressure and decreased employee utilization rates could negatively impact the Group’s revenues and operating results.
The Group is unable to predict the likely duration and severity of an economic downturn and adverse global economic conditions. An economic downturn could have a material adverse effect on the
Group’s business, results of operations or financial condition. Furthermore, if the economic downturn continues or worsens, the Group may not be able to secure short-term and long-term credit or
leasing facilities on favorable terms or at all, which could have a material adverse effect on the Group's liquidity.
Industry and market risks
Technology changes
Rising new technologies such as cloud-based solutions and mobile technologies are gaining traction. Today, a considerable amount of the Group’s revenues are derived from cloud-based solutions, but
other unknown technologies may arise and change the foundation for the software, services and products offered by the Group. Existing ERP-players such as the Group will have to adjust their
software, services and product offerings with the emergence of new technologies, and if the Group does not manage to adjust its software, services and products accordingly, then it may have a
material adverse effect on the Group’s business, results of operations or financial condition.
The Group’s financial condition is partly dependent on solutions based on large software platforms. These standardized solutions are offered in a highly competitive and specialized market. The Group is
dependent on its ability to develop scalable best-in-class industry solutions that supplement these standardized solutions. Changes in the technical foundations of the standardized solutions and/or
changes in customers’ preferred ERP platforms may force the Group to alter its products accordingly. The Group is forced to invest time and resources on educating employees and updating existing
software, services and products to be competitive when updated versions of existing technologies and completely new technologies are launched. If the updated versions of existing technologies or the
completely new technologies do not penetrate the market, these investments may prove futile. Furthermore, the updated versions of existing technologies may contain errors and flaws, which are
outside of the Group’s control. These errors and flaws may entail difficulties for the Group to price and budget project offerings for customers. The Group’s business will suffer if the Group fails to
anticipate and develop new services and enhance existing services in order to keep pace with rapid changes in technology, in the industries and in the standardized solutions on which the Group
focuses. This could have a material adverse effect on the Group’s business, results of operation or financial condition.
Com petition
The Group may face significant competitive pressure from other participants in the market resulting in pricing pressures, lower sales and reduced margins, which could have a material adverse effect
on the Group’s business, results of operations or financial condition.
A significant part of the Group’s revenues are based upon customized add-on solutions to standard software supplied by platform providers, primarily Microsoft, and to a very limited degree SAP. In
Scandinavia the platform providers do not deliver such customized solutions and the Group competes with smaller specialized companies e.g. CGI, Columbus IT, Fujitsu, KMD, Infor, iStone, NNIT,
Netcompany, Tieto and Visma.
A part of the Group’s activities within standardized solutions is subject to competition from competitors based in countries with a lower level of expenses. As the global market place develops with
among other things the development of cloud technology lower market entry barriers are expected. If the Group does not meet these challenges it may have a material adverse effect on the Group’s
27Risk Factors - continued
Risks related to the business
business, results of operations or financial condition.
Industry changes
The balance between insourcing and outsourcing is constantly changing. An increased focus on insourcing will lead to falling sales especially within service agreements, while a decreased focus on
insourcing will lead to rising sales.
If major platform service providers such as Microsoft seek downstream expansion in the value chain and increase their attention towards developing their own industry solutions then it may pose a risk
which unless mitigated by the Group may have material adverse effect on the Group’s business, results of operations or financial condition.
Changes in custom er preferences
Changes in customer preferences or behaviour unless mitigated by the Group may have a material adverse effect on the Goup’s business, results of operations or financial condition.
R isk related to public custom ers
The Group works with public customers and is exposed to additional risks inherent in the public sector contracting environment.
These risks include the following:
such projects may be subject to a higher risk of reduction in scope or termination than other contracts due to political and economic factors such as changes in government, pending elections or the
reduction in, or absence of, adequate funding;
terms and conditions of public sector contracts tend to be more onerous for the Group than commercial contracts in the private sector and may include, for example, more punitive service level
penalties and less advantageous limitations on the Group’s liability. Also, the terms of such contracts are often subject to political and economic factors;
public sector contracts are often subject to more publicity than other contracts. Any negative publicity related to such contracts, regardless of the accuracy of such publicity, may adversely affect our
business or reputation;
new public procurement laws and regulations or changes in the applicability or interpretation of existing public procurement laws and regulations may adversely affect the Group’s business activities
and may result in a risk of reduced revenues and/or increased costs; and
such projects differ from commercial contracts in the private sector in that they are generally subject to Danish public procurement rules. Under these rules, IT-services are generally re-tendered on a
regular basis, and, as a result, the Group is required to participate in a tender to maintain existing public contracts.
Operational risks
Innovation and softw are developm ent
In order for the Group to remain competitive within its markets, it is important that the Group is able to develop and launch new software, services and products, update existing products and services
and expand new or redesigned products and services in a timely manner. Failure by the Group to do so might result in the Group falling behind its competitors. There are risks with launching a new
product on to the market. The Group’s software, services and products are complex and may contain errors, faults, performance problems or defects which were undetected in testing. It is important
that both the Group’s support and research and development teams become familiar with new software, services and products so as to be able to efficiently respond to any problems that may arise.
Once a product is launched, it is necessary to ensure that quality standards are maintained to ensure continuing customer satisfaction and confidence. If problems were to occur which are not
adequately managed it could damage the Group’s reputation and prove more difficult to market the product. If these risks were to arise they may adversely impact the Group’s business, results of
28Risk Factors - continued
Risks related to the business
operations or financial condition.
Com patibility
In order for the Group to remain competitive within its market, compatibility with other significant components and general IT standards is required. Failure by the Group’s products to be compatible
with other components might result in the Group falling behind its competitors and in loss of customers. If the issue of compatibility is not adequately managed it could damage the Group’s reputation
and make it more difficult for the Group to market its products. This may have an adverse effect on the Group’s business, results of operations or financial condition.
P roject M anagem ent
The management consultancy and programming/configuring part of the Group is project driven and requires the Group to ensure that the offer documents have high standards and that the subsequent
management of the projects and resources is closely supervised. It is of vital importance that the projects are carried through with high quality in accordance with the agreed price and deadline. There
are risks connected to marketing, sales, analysis and design, development, implementation and operation in the Group’s project planning. The Group has established well planned phases and has
experience with calculating the risk of budgeting, resourcing and quality. As fixed prices become more common in the industry there is a risk that a project exceeds the anticipated number of hours
based on a flawed estimation of the necessary resources. Furthermore there is a risk when defining and describing the software, service and/or product to be delivered as there may occur
misunderstandings between the Group and customers on the customers’ objectives may result in re-deliverance or disputes.
Connection w ith M icrosoft
The Group’s business and operations are among other things based on sales of standard Microsoft licenses and individually designed solutions based on Microsoft products but the Group has not
entered into any agreements with Microsoft that are unusual or peculiar within the industry. However, if Microsoft’s market share decreases, it may have an adverse effect on the Group’s business,
results of operations and financial condition.
Custom er Concentration
The Group operates mainly in Denmark, Norway and Sweden and has a large customer base. Currently the Group has a diversified customer base with low dependency on single customers. Based on
LTM Q3 2017, the 10 largest customers accounted for approx. 13 per cent of the Group’s revenues, while top 20 per cent accounted for approx. 18 per cent. The Group’s division Citizen Solutions is
characterized by having relatively larger customers than the rest of the divisions. Dependency on one or more customers within Citizen Solutions may have material adverse effect on the division’s
business and results of operations.
Attack by IT viruses or ransom w are
Attacks by IT viruses or ransomware are a threat, both to the Group and its customers. If the Group’s products or internal IT systems are contaminated with a virus/ransomware this could temporarily
prevent the Group’s customers from conducting their business or the Group from providing adequate support and services to its customers. Failure to maintain sound IT infrastructure and virus
protection could therefore result in disruptions and if they were to continue for a considerable length of time they may adversely impact the Group’s business, results of operations or financial
condition.
Fires and other natural catastrophic events
The Group’s servers, systems and physical operations are vulnerable to damage or interruption from earthquakes, volcanoes, fires, floods, power losses, telecommunications failures, terrorist attacks,
acts of war, human errors, break-ins and similar events. The Group may not have sufficient protection or recovery plans in certain circumstances and the Group’s business interruption insurance may
be insufficient to compensate the Group for losses that may occur. As the Group relies heavily on its servers, systems, physical operations and the Internet to conduct its business such disruptions
could negatively impact the Group’s ability to run the business, which could have an adverse affect on the Group’s business, results of operations or financial conditions.
29Risk Factors - continued
Risks related to the business
Acquisitions
The business segments within which the Group is active are subject to continuous consolidation driven by the increase in cross-border trade and the search for economies of scale. As illustrated by the
acquisition of Silkeborg Data, the strategy of the Group is to participate actively in this consolidation process. This strategy for long-term growth, improved productivity and profitability depends in part
on the Group's ability to make acquisitions and to realize the expected benefits from its acquisitions. While the Group expects such acquisitions to enhance its value proposition to customers and
improve its long-term profitability, there can be no assurance that the acquisitions will meet the Group's expectations within the established time frame or at all.
Acquisitions involve a significant number of risks, including, but not limited to, risks arising from change of control provisions in contracts of any acquired company, local law factors, pending and
threatening lawsuits and risks associated with restructuring operations. The integration of acquired companies may result in unforeseen operational difficulties and costs, and the Group may encounter
unforeseen difficulty in retaining customers from and key personnel in acquired businesses. The Group may not be able to realize the expected benefits from a certain acquisition or the profitability of
the acquired company may be lower than expected or even result in a loss.
To successfully manage the integration of acquired companies or assets, the Group will need to maintain high standards of service and manage its employees effectively. The Group's successful growth
will furthermore depend on its ability to manage its expanding operations, as well as the operations of the networks of its local partners, including its ability to establish and maintain an adequate IT
infrastructure, to integrate new qualified personnel and any newly acquired businesses on a timely basis, and to maintain robust financial and management control and reporting systems and
procedures. There is a risk that the Group will not succeed in such integration.
If the Group is unable to expand its operational, financial, and management systems in a manner that supports the expected growth, or is unable to attract, motivate and manage a skilled workforce,
the Group may not be able to continue to satisfy customer demands. If the Group expands the business too rapidly in anticipation of increased customer demand that does not materialize, the increase
in operating expenses could exceed revenues growth and as a result reduce net income. Thus if the Group is unable to manage its growth, it could have a material adverse effect on the Group’s
business, results of operations or financial condition.
The Group has built up considerable goodwill on its accounts due to acquisitions. Notwithstanding that the goodwill is impairment tested annually the rise of new “game changing” or transformational
technology may entail that the goodwill must be immediately written off.
Risks related to employees
Attracting and retaining em ployees
To a large extent the Group relies on human know-how. The employees of the Group have specific sector related know-how, which is valuable for the Group. The Group has not generally entered into
non-competition or non-solicitation clauses. If employees with specific sector related know-how leave the Group, the Group might lose valuable knowledge and the employees might be hired by
competitors or establish their own companies.
The customers of the Group require deep sector knowledge including supply chain knowledge and understanding. To ensure the Group continues to offer high level advice and solutions, including
further development of software, services and products, thereby ensuring profitability the Group depends largely upon highly skilled technology professionals and the Group’s ability to hire, attract,
motivate, retain and train these personnel. Key employees might be attracted to opportunities in rising market. A failure to attract and retain competent key employees could have a material adverse
effect on the Group’s business, results of operations or financial conditions.
Invoicing rate
The Group is highly dependent on its employees’ invoicing rate, which equals their billable hours. The invoicing rate depends on the composition of the staff as well as how the individual employee
30Risk Factors - continued
Risks related to the business
spends his time. In 2016, a change in the invoicing rate of 1.00 percentage point across the Group would have resulted in an increase in the gross profit and thus in EBITDA of DKK 18 million (taking
into account fixed price contracts), and vise versa by a reduction in the invoicing rate. A decline in the employees’ invoicing rate across the Group could have a material adverse effect on the Group’s
business, results of operations or financial condition.
Increased w age pressure
In certain industry sectors and countries there continues to be a significant wage pressure due to the demand for skilled employees. In a positive economic environment wage pressure and employee
turnover will rise. This may cause heavier expenses for training of new employees. If the Group does not comply with the wage demands within these industry sectors and countries, the Group may
lose valuable employees. Wage pressure and employee turnover may have an adverse effect on the Group’s profitability
IPR and Legal Risks
Contractual liability
Typically a service agreement contains provisions requiring a high percentage of uptime as well as other service requirements. In connection with the contract negotiation phase the Group seeks to
draft provisions that mitigate the size of potential liability claims and penalties. The Group has established internal controls to secure reasonable liability provisions when entering into agreements.
Nevertheless, the Group is exposed to contractual liabilities, which could have a material adverse effect if such exposure materializes. Moreover, human errors in judgment may cause the Group to
accept contractual liability provisions inadvertently or outside of internal control systems established to secure management approvals.
Under some contracts or legal regimes the Group may have unlimited liability for losses caused by its own negligence, and such liability may not be covered by the Group’s insurance policies.
Litigation and disputes
The Group’s software, services and products relate to extensive, complex transactions often involving considerable sums. Customers or other parties may file claims for compensation for loss or
damage alleged to have arisen due to reported faults or defects in the Group’s software, services, products and management or the Group may become party to judicial or administrative proceedings
relating to the Group’s business, including, responsibility for software, services and products as well as contractual interpretation and intellectual property rights. Any such claims against the Group or
the Group’s involvement in any judicial or administrative proceedings in respect of such claims could mean that the Group is forced to expend considerable sums and resources in defending such
claims, whether or not they have legal merit, and this could adversely impact the Group’s business, results of operations or financial condition.
Insurance
The Group believes that is has a normal, market standard insurance program. The insurance program is reviewed once a year. However, the insurance program contains provisions on own risk and not
all types of losses and liabilities are covered. If a loss occurs that the insurance does not cover, it may have a material adverse effect on the Group.
Com petition
The Group has entered, enters and will enter into agreements with other companies who in some aspects of the Group’s business may be assessed as competitors of the Group. The Group does not
believe that it has entered into any agreements that contain provisions that infringe current competition law. However, the competition authorities in various jurisdictions may interpret the agreements
otherwise. Furthermore, there cannot be given any assurance that an adoption of new competition legislation will not result in certain of the provisions of the agreements being deemed to be an
infringement of the new competition law. If the Group fails to comply with the existing competition law this could adversely impact the Group’s business, results of operations or financial condition.
31Risk Factors - continued
Risks related to the business
Intellectual property rights
The products marketed by the Group consist mainly of computer programs developed by the Group over a long period of time. The Group relies primarily on copyright and trade secret protection, and
not on registered rights, for the computer programs in question. It cannot be assured that the intellectual property rights relied on by the Group will afford sufficient protection of the Group’s
technology or business and given the international market in which the Group operates, any attempt to take measures against any infringement of its intellectual property rights may be difficult and
result in considerable costs. If the risk of infringement and the fetters on access to judicial remedies were to materialize, it may adversely impact the Group’s business, results of operations or financial
conditions.
In addition the Group has and may in the future enter into cooperation agreements and other contractual arrangements with third parties that allow such third party to use knowledge obtained during
such cooperation or the right to use any source codes, which may include the third party applying such knowledge in its own products and services.
The Group does not consider that its software, services and products infringe the rights of any third party. Nevertheless, customers or others might make claims to the contrary whether or not they
have legal merit. If such claims were to be made the Group may be prevented from licensing the necessary technology or be unable to develop alternative software, services or products to avoid such
claims of infringement and continue to deliver the software, services and products to its customers. The Group gives its customers certain guarantees and indemnities including, amongst others, that
the Group holds all necessary rights to the products that are made available to the customers. If any claims were filed against customers, enforcement of the guarantee or infringement claims under
the indemnity may result in considerable costs for the Group, which may adversely impact the Group’s business, results of operations or financial condition.
Open Source
The Group incorporates open source software into the Group’s platform. The Group believes that the use of open source codes has not surpassed what is deemed ordinary within the industry. It is
within ordinary practice for Danish and Scandinavian companies, who offer and develop proprietary solutions, to use open source codes when developing proprietary solutions, including use of open
source components. Given the nature of open source software, third parties might assert copyright and other intellectual property infringement claims against the Group based on the Group’s use of
certain open source software programs. The Group could be required to seek licenses from third parties in order to continue offering the Group’s software, services and products, to re-develop the
Group’s software, services and products, to discontinue sales of the Group’s software, services and products, or to release the Group’s proprietary software source code under the terms of an open
source license, any of which could adversely affect the Group’s business. This may adversely impact the Group’s business, results of operations or financial condition.
Legislation and regulations
As the Group’s business activities are spread over a number of geographical markets, it is exposed to many different laws, regulations, ordinances, agreements and guidelines. New laws and
regulations or changes in the applicability of existing laws and regulations to the Group’s business activities may result in a risk of reduced revenues and/or increased costs. If changes in laws or
regulations, or their applicability to the Group’s activities, were to occur it may adversely impact the Group’s business, results of operations or financial condition.
N ew accounting standards, am endm ents and interpretations
The Group is affected by the accounting principles applicable from time to time, for example IFRS and other international accounting standards. This implies that there is a risk that the Group’s
accounting, financial reporting and internal control in the future may be affected by and needs to be adapted to new accounting rules or changed application of the accounting rules in force. This may
cause uncertainties in relation to the Group’s accounting, financial reporting and internal control, and may negatively affect the Group’s reported results, assets and equity, which in turn may have a
material negative impact on the Group’s operations, earnings and financial position.
IFRS 15 (Revenue from Contracts with Customers) will apply to the Group from 1 January 2018. The impact of the standard is currently being assessed and it could adversely impact the Group’s
accounting and financial results.
32Risk Factors - continued
Risks related to the business
Financial Risks
Seasonality
The Group’s earnings and turnover may vary from period to period. If the spreading of earnings and turnover over a year surpasses expectations it may have an influence on the Group’s liquidity as a
part of the Group’s expenses do not fluctuate with the revenues on a short term basis.
The Group’s biggest single expense is salary. Almost all staff are hired as salaried employees. It is therefore not possible to reduce the major part of the Group’s expenses on a short term basis. The
Group has launched programs to minimize this risk. If the programs do not have the expected effect it may adversely impact the Group’s business, results of operations or financial condition.
R isk of refinancing and financial covenants
The Group has debt obligations and is required to dedicate a portion of its cash flows to service the debt, which reduces cash available to fund acquisitions and to finance operations, capital
expenditures, working capital and other general corporate purposes. A part of the Group’s financing is short term financing, making the Group dependent on having such credit facilities renewed from
time to time. If any of the lenders under such financing agreements are unwilling to extend such arrangements and the Group is unable to find an alternative source of funding at comparable rates,
this may affect the Group’s liquidity adversely or increase the Group’s interest expenses substantially. Furthermore, the level of indebtedness may render the Group unable to secure new credit facilities
when required, either on commercially attractive terms or at all.
The Group’s ability to make payments on and to refinance its debt, and to fund planned capital expenditures and other strategic investments will depend on its ability to generate cash in the future.
This, to a certain extent, is subject to general economic, financial, competitive, legislative, regulatory and other factors that are outside the Group’s control.
There can be no assurance that the Group’s business will generate sufficient cash flows from operations or that future debt and equity financing will be available in an amount sufficient to enable the
Group to pay its debts as they fall due or to fund other liquidity needs.
Certain of the Group’s financing arrangements are subject to various covenants, including financial covenants included in the Bond Agreement, which could limit the Group’s ability to finance its
operations and capital needs and pursue acquisitions and other business activities. There can be no assurance that the obligations contained in the aforementioned financing arrangements will be met.
You are advised to carefully read the covenants in the Bond Agreement, including the carve-outs and permitted actions.
A breach of the Group’s financing agreements may trigger cross-default or cross-acceleration provisions and provide a substantial number of the Group’s lenders with a right to cancel their
commitments to the Group and require the outstanding indebtedness to be immediately repaid. In addition, an event of default would occur under the Bonds. In such circumstances, all of the Group’s
debt could be accelerated at the same time.
The occurrence of either of the above could have a material adverse effect on the Group’s ability to satisfy its debt obligations as they fall due and, as a result, could have a material adverse effect on
its business, results of operations or financial condition.
33Risk Factors - continued
Risks related to the business
Currency
The Group’s accounts are consolidated in DKK, whereas a proportion of the proceeds of sale of the Group’s products and services outside Denmark are denominated in NOK and SEK. In the twelve
months up to 30 September 2017 revenues in NOK constituted approximately 12 per cent and revenues in SEK approximately 10 per cent of the total consolidated revenues (excluding the KOMBIT
contract). In the twelve months up to 30 September 2017 the EBITDA in NOK constituted approximately 2 per cent and EBITDA in SEK approximately zero per cent of the total EBITDA (excluding the
KOMBIT contract). The Group is consequently exposed to currency risks, including currency exchange control risks and other restrictions by foreign governments. To some extent the Group hedges
currency risks but there is no standard operating procedure requiring hedging in any event. Furthermore there are risks connected to conversion of intragroup outstanding accounts. Fluctuations in
currency exchange rates, including primarily NOK and SEK, relative to DKK could have a material adverse effect on the Group’s business, results of operations or financial condition.
Goodw ill
See the section “Acquisitions” for the description on the risks related to goodwill.
Tax ation and Duties
The Group conducts its operations through companies in a number of different jurisdictions. Applicable taxes could increase significantly in each of these countries as a result of changes in the tax laws
or their application. Furthermore, the Group may become subject to tax audits, which could increase the amount of tax that the Group is required to pay and have a material adverse effect on its
business, results of operations or financial condition.
The Group has transfer pricing arrangements among subsidiaries in relation to various aspects of the Group’s business, including operations, marketing, sales and delivery functions. Transfer pricing
regulations require that any international transaction involving associated enterprises be on arm’s-length terms. The Group considers the transactions to be on arm’s-length terms. The determination of
the Group’s consolidated provision for income taxes and other tax liabilities requires estimation, judgment and calculations where the ultimate tax determination may not be certain. The Group’s
determination of its tax liability is always subject to review or examination by authorities in various jurisdictions.
34Risk Factors - continued
Risks related to the bonds
Risks related to the bonds
Suitability
The Bonds may not be a suitable investment for all investors. Each prospective investor in the Bonds must determine the suitability of that investment in light of its own circumstances. In particular,
each prospective investor should:
(i) have sufficient knowledge and experience to make a meaningful evaluation of the Bonds, the merits and risks of investing in the Bonds and the information contained or incorporated by reference
in this Company Description;
(ii) have access to, and knowledge of, appropriate analytical tools to evaluate, in the context of its particular financial situation, an investment in the Bonds and the effect the Bonds will have on its
overall investment portfolio;
(iii) have sufficient financial resources and liquidity to bear all of the risks of an investment in the Bonds, including Bonds where the currency for principal or interest payments is different from the
potential investor’s currency;
(iv) understand thoroughly the terms of the Bonds and be familiar with the behavior of any relevant indices and financial markets; and
(v) be able to evaluate (either alone or with the help of a financial adviser) possible scenarios for economic, interest rate and other factors that may affect its investment and its ability to bear the
applicable risks.
Credit Risks
The Group may become unable to pay interest, principal or other amounts on or in connection with the Bonds, which may affect the value of the Bonds adversely. An increased credit risk or decrease
in the Group’s creditworthiness may have an effect on the market price of the Bonds.
The Group’s ability to make payments on the Bonds will depend on its ability to generate cash or refinance itself in the future. This, to a certain extent, is subject to general economic, financial,
competitive, legislative, regulatory and other factors that are outside the Group’s control.
Registration
The Bonds will be registered with VP Securities A/S and payment of interest, principal or other amounts on or in connection with the Bonds will be made through VP Securities A/S. The Bondholders will
thus rely on VP Securities A/S’ procedures for transfer, payment and communication with the Group.
Modification, Waivers and Substitution
The terms of the Bonds contain provisions for calling meetings of Bondholders to consider matters affecting their interests generally. These provisions permit defined majorities to bind all Bondholders,
including Bondholders who did not attend and vote at the relevant meeting and Bondholders who voted in a manner contrary to the majority. A Bondholder may be adversely affected by such
decisions.
Bondholders Representation
In accordance with the Bond Agreement, the Bond Trustee represents each Bondholder in all matters relating to the Bonds and the Bond Agreement and holds and shall enforce the Bond Agreement
on behalf of the Bondholders. The Bond Agreement contains provisions to the effect that a Bondholder is prohibited from taking actions of its own against the Issuer. This does not, however, rule out
the possibility that the Bondholders, in certain situations, could bring their own action against the Issuer, which could negatively impact the chances of an effective enforcement of the Bond Agreement.
35You can also read