Investor Presentation Schaltbau Holding AG - April 2019

Page created by Melvin Singh
 
CONTINUE READING
Investor Presentation Schaltbau Holding AG - April 2019
Investor Presentation
Schaltbau Holding AG

April 2019
Investor Presentation Schaltbau Holding AG - April 2019
Executive Board                                                          Investor Presentation          April 2019           2

Experienced management team bringing Schaltbau back to
historical profitability

                                                                                                                                    Our
                                                                                                                                  common
                                                                                                                                 objectives

                                                                                                                                 • Return
                                                                                                                                     to
                                                                                                                                    profit
            Dr Albrecht Köhler                             Volker Kregelin                              Thomas Dippold
                                                                                                                                 • Secure
 Chief Executive Officer                      Chief Officer for Mobile & Stationary        Chief Financial Officer                financing
 (since May 2018)                             Transp. Techn. (new since 1 Dec 2018)        (since Jan 2017)
 • Freelance interim CEO / COO (2016-18)      • Leading sales and general management       • CFO Faber-Castell AG (2014-16)
                                                                                                                                 capabilities
 • Deputy CEO GAZ Group (2014-16)               roles in MTT & STT at Bombardier           • CFO Semikron International
 • Managing Director Knorr Bremse               Trnspt. (2007-18)                            (2008-14)                           • Manage
     rolling stock bus. unit (2000-14)        • Reg. head / COO at Dematic (2004-07)                                             sustainable
                                                                                           • Head of Controlling Schott AG
 • Leading general management and             • Senior roles in projects, operations and
     operations roles at Dt. / Daimler Benz     sales at Siemens and Adtranz /
                                                                                             (2002-08)                             growth
     Aerospace (1989-1999)                      Bombardier Trnspt. (1993-2003)
Investor Presentation Schaltbau Holding AG - April 2019
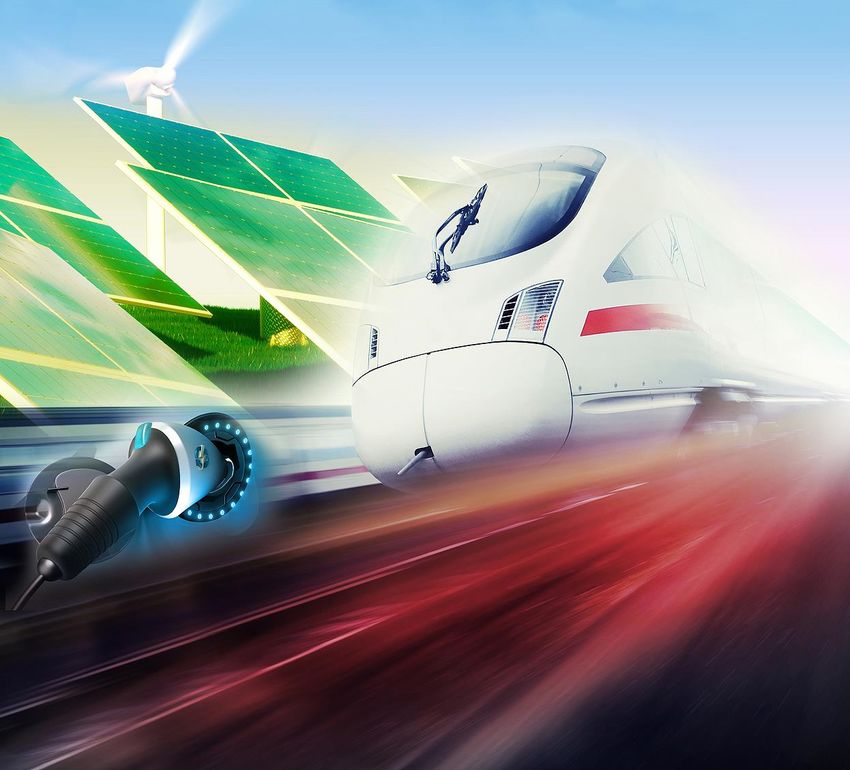
Business and Market Overview
Investor Presentation Schaltbau Holding AG - April 2019
The Schaltbau Group at a glance                            Investor Presentation   April 2019   4

Schaltbau Group – Key facts

     Leading supplier of technology for rolling stock, rail
      infrastructure, automotive and other industrial applications
     World market leader in direct current switching technology
     Global innovation driver and key technology partner for
      future markets such as new energy, electromobility,
      DC industry, smart building and autonomous driving
     Founded in 1929
     Employees: c. 3,000
     Turnover: c. € 500m, of which 70% rail,
      regional split 35% D, 45% rest of Europe, 20% rest of world1
     Listed at Frankfurt Stock Exchange, Prime Standard
      segment, IPO 1994
     30+ subsidiaries in 15+ countries worldwide

1   2018, rounded to full 5%
Investor Presentation Schaltbau Holding AG - April 2019
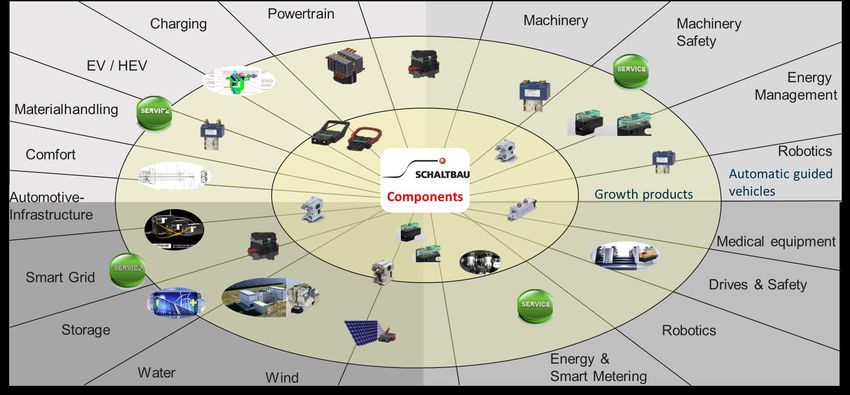
The Schaltbau Group at a glance                           Investor Presentation     April 2019   5

Schaltbau Group – Investment case

 Attractive market environment
   Urbanisation and digitisation megatrends are driving demand
    for new rail vehicles; metro trains with a large number of doors are gaining
    in importance
   Megatrend in energy supply and use towards direct current technology is
    driving demand for DC switching and charging technology established in the
    railway sector with increasing use of decentralised energy concepts, energy
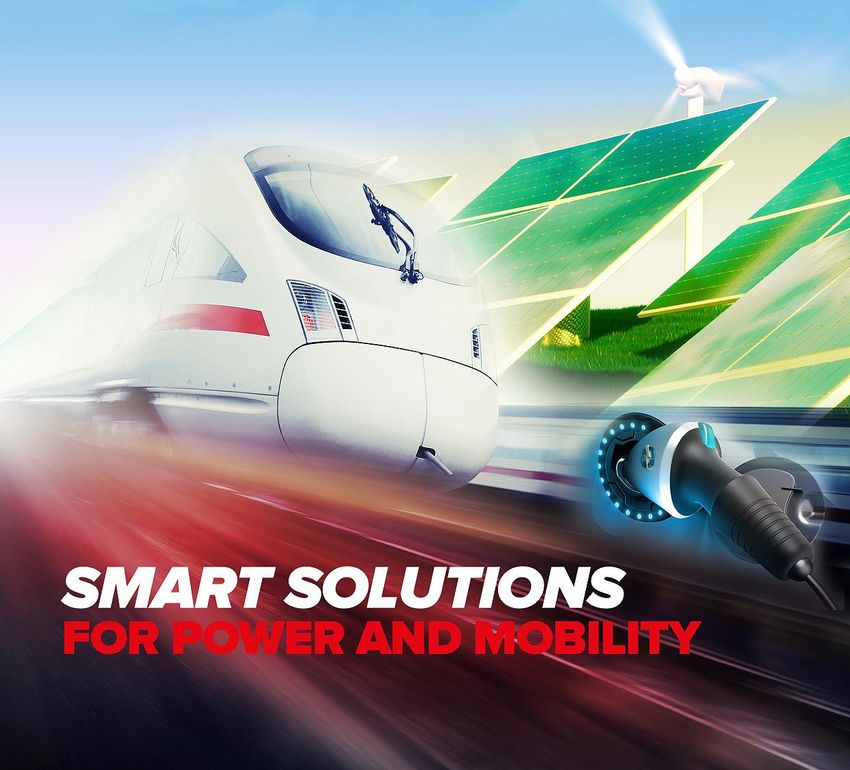
    storage systems and smart network control                                                    SMART SOLUTIONS
   Positioning as innovation driver and essential technology partner in                         FOR POWER AND MOBILITY
    current and future markets such as rolling stock, new energy, electromobility,
    DC industry, smart home and autonomous driving
 Stable customer relationships, especially in the rail sector with often lengthy
  listing procedures and high repurchase rates
 Significant increase in profitability through process improvements,
  reorganisation and modular development
 Inherited risks have been removed from the balance sheet
Investor Presentation Schaltbau Holding AG - April 2019
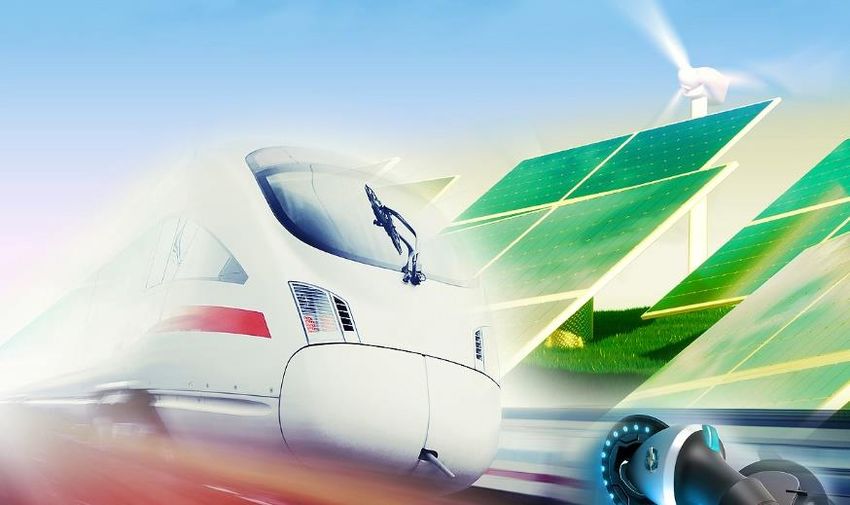
The Schaltbau Group at a glance                                                         Investor Presentation               April 2019             6

Schaltbau Group – Business overview

                                                                                                   HOLDING

                    Components (COM)                                          Mobile Transportation Technology (MTT)                              Stationary Transportation Technology (STT)

                                    ~30%*                                                                 ~55%* **                                                              ~15%*

      DC technology for trains, new energy and                                              Door systems for                                               Level crossing systems,
       electromobility, driver desk equipment                                        trains, buses and automotive                                point heating systems, shunting equipment

* Segmental sales split based on FY 2018 numbers, pre consolidation, rounded to the nearest 5% multiple      ** Bode Group represents ~45% of Schaltbau Group’s FY 2018 sales
Investor Presentation Schaltbau Holding AG - April 2019
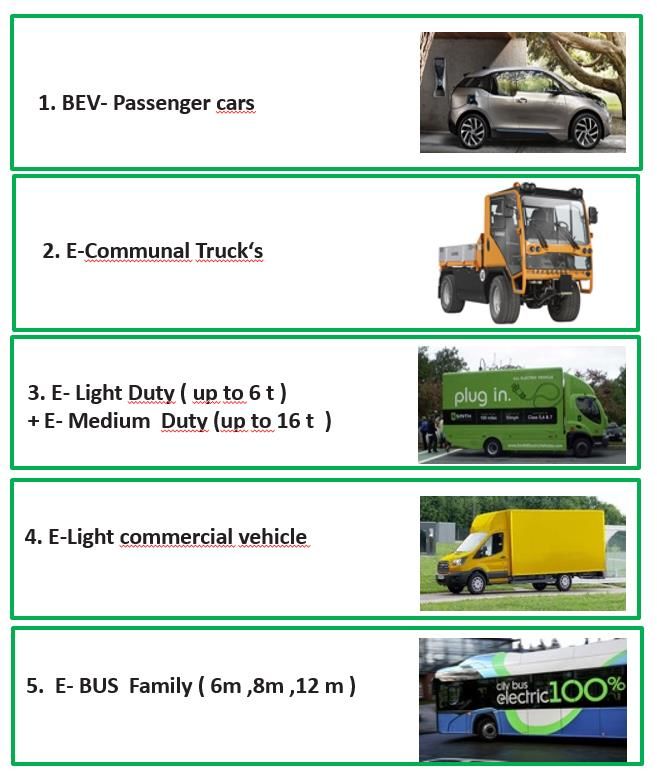
Key operating entities                                             Investor Presentation     April 2019       7

Snapshot of Schaltbau Subgroup
                                                                                                                     COM   MTT   STT

                   ~30% of
                   Group sales*
                                                                      SCHALTBAU
                                                                                     Member of the Schaltbau Group

 • Broad range of best-in-class connectors, snap-action switches and contactors for a broad range of applications
   in the rail sector and other industries
 • State-of-the-art train driver desk equipment
 • Development activities focus on high-performance DC contactor technology in applications beyond rail,
   such as new energy, electromobility, DC industry and smart building
 • High share of international sales, broad customer distribution
 • Has developed from a pure component supplier to an application specialist providing components, assembly and service
 • Highly efficient operations
 • High order intake with strong and sustainable margins

* FY 2018, pre consolidation, rounded to the nearest 5% multiple
Investor Presentation Schaltbau Holding AG - April 2019
Key operating entities                                                           Investor Presentation               April 2019             8

Snapshot of Bode Subgroup
                                                                                                                                                                    COM        MTT   STT

                   ~45% of
                   Group sales* **

                                                                                                           Member of the Schaltbau Group

 • #1 market leader in Europe and #2 player worldwide in oligopolistic market, strong train entry systems quality track record
 • Customer range has been expanded by leveraging train door system experience into bus and automotive applications
   such as Deutsche Post DHL’s electromobility vehicle StreetScooter
 • Use of sensor technology in entry systems adds digital functionality such as ticketing, passenger counting and enhanced squeeze
   protection, for use also in future applications such as autonomously driven group transportation units (“people mover”)
 • Service organisation with high flexibility
 • Polish subsidiary Rawag contributes best-in-class train windows & interiors and provides additional low-cost production capacity
 • Reorganisation of production processes well underway, with significant efficiency gains in sight
 • Good order intake and high sales growth, opportunities to grow in Asia

* FY 2018, pre consolidation, rounded to the nearest 5% multiple   ** Number does not include contribution of Alte, Sepsa and Schaltbau Refurbishment to MTT segmental sales
Investor Presentation Schaltbau Holding AG - April 2019
Key operating entities                                             Investor Presentation     April 2019       9

Snapshot of Pintsch Subgroup
                                                                                                                     COM   MTT   STT

                   ~15% of
                   Group sales*

                                                                                     Member of the Schaltbau Group

 • Established #3 player in various oligopolistic submarkets such as level crossings,
   shunting equipment and point heating systems
 • Rail infrastructure market offers significant growth potential and major innovation opportunities related to
   digitalisation and interconnection of field elements and systems (e. g., point diagnostics)
 • Improvement of terms & conditions with large customers ongoing
 • Stronger focus on key product portfolio
 • Consolidation of 3 sites into one major operations centre with roadmap established
 • Performance improved significantly, order intake shows volatility
 • Benefits from the enormous infrastructure investments recently announced by Deutsche Bahn

* FY 2018, pre consolidation, rounded to the nearest 5% multiple
Investor Presentation Schaltbau Holding AG - April 2019
Market and competitive environment                                                        Investor Presentation                April 2019            10

Megatrends drive sustainable growth in global rail markets

                                                                                             Rolling stock                                                     Infrastructure & Rail control
                Megatrends

        Digitisation / Automation

                Urbanisation
                                                                       Components / Mobile Transportation Technology                                      Stationary Transportation Technology
           Emission reductions

                Connectivity
                                                                                  SCHALTBAU                              BODE                                               PINTSCH
                                                                                                                                                                             PINTSCH
                                                                                  Connect Contact Control                The Door                                           Safety for Rail
        Electrification / E-mobility

                                                                    • Market growth:(1)          ~2.6%                                         • Market growth:(1)          ~2.9%
                    Safety
                                                                    • Market size:(2)            ~€53bn                                        • Market size:(2)            ~€46bn

           Globalisation / China
                                                                     Regional market growth(1)(3)
                                                                      • Western Europe: ~2.2%                 • Asia / Pacific: ~2.5%           • NAFTA: ~3.1%                     • CIS: ~2.7%
      Regulation and liberalisation                                   • Eastern Europe: ~2.7%                 • Africa / ME: ~5.2%              • Latin America: ~4.8%

Source: Unife, Roland Berger
(1) Average annual market growth from 2015-17 until 2021-23 over six years (2) Average annual market 2015-2017 (3) Total rail market: Rolling stock, infrastructure, rail control, services and turnkey management
Market and competitive environment                                                         Investor Presentation                April 2019             11

Railway market with oligopolistic supplier structure in many segments

Overall rolling stock OEMs in the rail market                                                                Selected suppliers in the Schaltbau rolling stock market

                                                                                                                                                                          /               (4)
                                                                                                                     1.                                     +

                                                                                                                     2.
                                                                                         c. 15%
                                                                                                                     3.
                                         32%                                               c. 5%
                                    Rolling stock                                          c. 5%                     4.

                                                                                           c. 5%                     5.

           49%             €163bn(1)                                Other OEMs(2)          < 5%                      6.
          Other(3)
                                                                                                                     7.
                                       19%                          Market size ~€53bn
                                                                                                                     8.
                                  Infrastructure
                                                                                                                     9.

                                                                                                                    10.
Source: UNIFE, Company information
(1) Total average annual rail market 2015-2017 (2) Incl. Hitachi Rail, Stadler, CAF, Pesa; ABB and Thales Transport not considered (mainly in infrastructure or control command and signalling technology)
(3) Services, rail control, turnkey management (4) Combination of GE Transportation and Wabtec businesses still subject to regulatory approvals and other customary closing conditions
Market and competitive environment                                     Investor Presentation   April 2019   12

Market for door systems shows strong growth perspective

            Bode is a core Schaltbau Group brand and a specialist in the development and manufacture of electric and
             pneumatic vehicle door systems for trains, buses and commercial vehicles
            All three areas have high development potential within the growth markets of public transport and e-mobility
             (e.g. entry systems for e-shuttle buses and autonomously-driven people mover)
            The best-in-class mechanical quality – Bode door systems are known to be safe, durable and reliable – in
             combination with intelligent software offers remarkable growth opportunities
         World market door systems:*
         c. $700m in 2018 for rolling stock alone, is likely to grow to at CAGR of c. 10-15% in the next couple of
          years, strongly driven by ramp in digital door system functionality
         Schaltbau at current has a market share of 30-35% in Europe and 18-20% globally
        * Schaltbau analysis based on various third party market research and own estimates
Market and competitive environment                      Investor Presentation   April 2019     13

Renaissance of DC technology

      New Energy                     Electromobility                   DC Industry                  Smart Building
       Future markets such as new energy, electromobility, DC industry and smart building are dependent on direct current
       due to high performance demand, decentralised energy supply, energy storage and smart grid control requirements

       Technology for the generation, transport and use of direct current has been significantly improved in recent years
        Direct current from wind and photovoltaic systems can be transmitted over thousands of kms of power lines
        Lithium-ion batteries are being used more and more, e.g. in high-performance charging stations for buses
        DC grids fuel production plants and robots in factories
        Direct current has many advantages - especially in terms of energy efficiency

       This development towards direct current will continue to increase in the coming years
Market and competitive environment          Investor Presentation   April 2019       14

Schaltbau DC components are suitable for a broad range of applications
and meet the necessary norms and standards
       Electromobility                                                                                  DC Industry

                                                                                          Machinery
                        (Hybrid) electric
                                                                                           safety
                           vehicles
                                                                                                    Energy
                  Material
                  handling                                                                        management

                Automotive                      DC components
               infrastructure

                  Smart
                   grid                                                                       Drives & safety

                                                                      Energy &
                                                                    smart metering

       New Energy                                                                                     Smart Building
Market and competitive environment                                                      Investor Presentation         April 2019               15

The global market for relevant DC contactors* is
predicted to grow at CAGR of >20%                                                                                                                                         Boom expected,
                                                                                                                  1. Electric passenger cars                              depending on
   € bn                                                                                                                                                                   infrastructure

    1.4
                                                                                                                                                                          Niche business
                                                                                                                  2. Electric communal trucks
    1.2

    1.0                                                                                                           3. Electric light duty (≤6t) +                          Stable yearly demand,
                                                                                                                     medium duty (≤16t)                                   based on existing figures
                                                                                                                     commercial vehicles
    0.8                                                                                                                                                                   Extraordinary growing
                                                                                                                                                                          due to increasing short-
                                                                                                                  4. Electric light
                                                                                                                                                                          distance deliveries and
                                                                                                                     commercial vehicles
    0.6                                                                                                                                                                   suitable charging
                                                                                                                                                                          infrastructure in depots

    0.4                                                                                                           5. Electric bus family                                  Stable yearly demand,
                                                                                                                     (6, 8, 12 metres)                                    based on existing figures

    0.2
                                                                                                                                                                          Moderate/stable growth
                                                                                                                  6. Stationary energy                                    due to market saturation
    0.0                                                                                                                                                                   and long usage times
     2019          2020            2021          2022      2023           2024   2025
            Mat. handling / forklift   Stationary energy   Electric bus
                                                                                                                                                                          Stable growth due to
            Light comm. vehicles       MDEV + LDEV         Communal trucks                                        7. Material handling
                                                                                                                                                                          logistics increase
           Passenger cars

    * Estimates include Europe, USA, China and Russia for all listed DC energy storage applications; Schaltbau analysis based on various third party market research, e. g. from International
      Organisation of Motor Vehicle Manufacturers OICA, German Association of the Automotive Industry VDA, McKinsey and German Centre of Automotive Management CAM, as well as own estimates
Strategic Agenda
Investor Presentation      April 2019    17

  Turnaround roadmap Schaltbau:
  Major milestones successfully achieved – further road to go
                   2017 – 2019                              2019 – 2020                                      2020 – 2021
    Create financial headroom                Achieve satisfactory debt level               Ensure sustainable profitability
    Stabilise operational performance        Step up investments in new market              on market level
                                               and product opportunities                     Establish competitive international footprint

             REDUCE COSTS                                                                       EXPLOIT GROWTH OPPORTUNITIES

                                                       OPTIMISATION OF
                                                    OPERATIONAL PROCESSES

                              REDUCE COMPLEXITY
                                                                                                           OPERATIONAL EXCELLENCE

        REDUCE DEBT

2018
2017             2018                     2019                                          2020                                              2021
Investor Presentation             April 2019       18

Strategy
                                                                        Schaltbau Group management
                                                                   • Decentralised income statement responsibility
                                                 • Standardised reporting from local management and review by Group Executive Board
                                                         • Coordination of intra-Group aspects via management committee

• Worldwide market and technology leader of DC safety          • Best in class door systems for trains, buses and            • State-of-the-art level crossing systems, point heating
  switching, DC components & high end driver desk                automotive, train interiors                                   systems, shunting equipment and other rail
  equipment                                                                                                                    infrastructure
                                                               • Potential growth in future markets such as
• Potential growth in future markets such as new                 electromobility and autonomous driving                      • Strong relationship with Deutsche Bahn as the
  energy, electromobility, DC industry and smart building                                                                      key customer in Germany
                                                               • Outstanding smart doors innovator: integration of
• Longstanding technology leadership with a strong               digital functionality such as passenger ticketing,          • Foreign market opportunities, e.g. in the U.S. with
  footprint as a well-established player in the railway          entertainment and preventive maintenance, ramp in             railway signaling, marshalling and hauling equipment as
  segment                                                        after-sales business                                          well as sensor technology for industry and mining
• Efficient production: pick/ configure/ design-to-order,      • Standardisation of door drive modules, redesign of          • Efficiency gains through ongoing restructuring and
  based on volume and complexity                                 production processes and better utilisation of                growing markets; consolidation of three Pintsch sites
                                                                 capacities available in Poland and Turkey                     into one main location
• Regional expansion into North America, Russia, China,
  India, coordinated with other Schaltbau Group entities;      • Regional expansion into North America and Asian             • Focus on core products and selective exploitation of
  centralised competence centres along with local                markets, coordinated with other Schaltbau Group               new business opportunities worldwide
  assembly and service                                           entities

         High-margin cross-industry                             Efficient door system provider in high-                                Sustainable high-quality
          DC technology specialist                                          growth market                                              rail infrastructure player
Investor Presentation   April 2019   19

Major growth opportunity with DC power control

                  “We are DC experts, industrial leader and market driver for
        future markets like new energy, electromobility, DC industry and smart building”

   The worldwide, disruptive energy supply trend and the shift toward direct current technology offer enormous
      potential for the Schaltbau Group to position itself as an essential technology partner in future markets

  With more than 90 years of expertise            •   However, switching off direct current safely continues to be a major
  from the railway industry, where DC                 challenge for most people. Not for Schaltbau!
  technology has remained the standard
  from the very beginning, the Schaltbau          •   Schaltbau ensures that tomorrow's energy concepts can be
  Group is driving the development of                 implemented more efficiently and more quickly, thus driving the
  new markets with DC-based products                  further development of new technologies and transforming them
  and applications                                    into applicable and safe solutions
Investor Presentation       April 2019      20

Outlook - Sales guidance 2019 with strong organic growth

 Sales guidance for 2019 in range of € 480-500 million                   In € million
  (without Sepsa and Alte)                                                        518
                                                                                                                                       € 480-500 million

 Organic growth expected for FY 2019                                                         -32
                                                                                                                                             490
   All business segments contribute
   Bode Group is main growth driver
                                                                                                           -25                 37

                                                                                                                     -8

                                                                              Sales FY 2018   Sepsa        Alte    Pintsch   Organic     Sales Guidance
                                                                                                                  Bubenzer   growth          FY 2019
Investor Presentation         April 2019           21

Guidance FY 2019

 Strong 2018 order intake as one of the drivers to ensure           Outlook (in € million)                     Guidance FY 2019*
  growth in 2019
                                                                     Order intake                                          480-500**
 Positive effects from restructuring measures and reduction
  of risk exposure (PSD) will continue to impact the 2019 EBIT
                                                                     Sales                                                 480-500**
  performance
 Additional measures to increase the 2019 EBIT performance            Mobile Transportation
                                                                                                                              Increase
  include optimisation of production and logistic processes,           Technology
  realisation of material savings and renegotiations of                Stationary Transportation
  customer contracts of low-margin projects                                                                          Slight increase
                                                                       Technology

                                                                       Components                                             Increase

                                                                     EBIT margin                                     Around 5-6%**

                                                                     * Compared to FY 2018
                                                                     ** Excluding Sepsa, Alte, Pintsch Bubenzer and exceptional items
Investor Presentation               April 2019            22

Portfolio development 2019 vs. 2018
                                                        Schaltbau
                                                        Connect Contact Control
                     25
Profitability in %

                                                        Profitable growth
                                                                                                  2019
                                          2018
                     15                                                                                                                           Pintsch – Safety for Rail
                                                                                                                                                  Growth from low base

                      5                   2018                                                                                                                     2019
                                                                               2019

                      -5                  2018
                                                          Bode. The Door.
                                                          Profitability ramp
                     -15
                           -5                                              5                                                           15                                              25
                                                                                                                                                                2019 vs. 2018 growth in %
Bubbles show 2018/2019 E profitability and 2019E/2018 year-on-year revenue growth. Bubble size represents significance for Schaltbau, based on revenue share.
Green arrows represent expected development trend 2019 vs. 2018.
Investor Presentation   April 2019    23

Schaltbau Vision 2021

                                                                                                       Operational excellence
          Disposal of non-core business                                                           throughout the organization

                                                              2021

          Overall increased share of service                                    State-of-the-art product and service offering in
          and international revenues                                                            terms of quality and innovation

 Our clear goal is to focus Schaltbau Group on its strategic core competencies and to consistently increase profitability.

     That is why we intend to dispose non-core business areas as well as those which are not sustainably profitable.

                             These alignments should result in increased profitability until 2021,
                      enabling Schaltbau to return to historical profitability levels and future growth.
FY 2018
Financials - FY 2018                                                                   Investor Presentation                April 2019           25

FY 2018 at a glance

 Key figures (in € million, unless stated otherwise)                           FY 2018                  FY 2017                        Δ

 Order intake                                                                     631.3                    594.0                  +37.3
 Order intake like-for-like*                                                      553.9                    511.0                  +42.9
 Sales                                                                            518.3                    516.5                   +1.8
 Sales like-for-like*                                                             477.7                    426.2                  +51.5
 EBIT                                                                               -7.3                    -23.0                 +15.7
 EBIT margin (in %)                                                                 -1.4                     -4.4                  +3.0
 EBIT before 2018 exceptional items                                                 16.0                      2.4                 +13.6
 Group net profit                                                                  -14.1                    -49.6                 +35.5
 Earnings per share (in €)                                                         -1.93                    -8.04                 +6.11
 Free cash flow                                                                     21.9                    -23.8                 +45.7
 Employees at period-end (count)                                                  3,157                    3,370                   -213
                                                                          31/12/2018               31/12/2017
 Net financial debt                                                               100.4                    158.4                  -58.0
 Equity                                                                             93.8                     70.6                 +23.2

* Excluding Pintsch Bubenzer and Sepsa contributions: Pintsch Bubenzer was deconsolidated on 1 March 2018, Sepsa was classified as held for sale in November 2017
Financials - FY 2018                                               Investor Presentation     April 2019     26

Overall assessment of FY 2018 (1/2)
 Restructuring achievements in FY 2018

   Financial restructuring – stabilisation of financial position and strengthening of equity base
         Sale of Pintsch Bubenzer with cash inflow of € 28.4 million
         Successful capital increase with cash inflow of € 46.5 million
         Timely repayment of bridge financing of € 25 million plus deferred interests of € 7 million
   Balance sheet restructuring – reduction of risks
         Necessary extraordinary impairments of Alte and Bode UK in the amount of € 14.0 million due to negative earnings performance
         Extraordinary effects from the release and recognition of provisions for onerous contracts
         Extraordinary impairment of capitalised expenses at Pintsch in the amount of € 3.0 million
   Operative restructuring – measures to increase efficiency and optimize processes
         Collective restructuring agreement at Pintsch with cost savings of € 2 million each in 2018 and 2019
         Start of two operational excellence programs:
                                  “Fit for future” program at Bode and Rawag
                                  “A tiempo” program at Alte
Financials - FY 2018                                                                   Investor Presentation               April 2019           27

Overall assessment of FY 2018 (2/2)

  Operating performance in line with expectations

  Strong order intake of € 631.3 million; book-to-bill ratio at > 1.2;
   order book end of December 2018 at € 583 million

  Sales volume at € 518.3 million, up 0.3% vs. FY 2017; organic growth of 12.1%* vs. FY 2017

  Reported EBIT at € -7.3 million after € -23.0 million in FY 2017,
   EBIT before exceptional items at € 16.0 million or 3.3% of revenues

  Operating guidance for FY 2018 achieved

* Excluding Pintsch Bubenzer and Sepsa contributions: Pintsch Bubenzer was deconsolidated on 1 March 2018, Sepsa was classified as held for sale in November 2017
Financials - FY 2018                                                                   Investor Presentation                 April 2019                  28

Order intake increases like-for-like by 8% with all segments contributing

  High order intake of € 631.3 million in FY 2018                                                                                 External order intake in € million **
      Strong development in Mobile Transportation mainly driven by a                                                              6.3%
                                                                                                        700
       USD 47 million order of Kawasaki Rail Car to Sepsa for the supply of                             650          631.3                                                                  8.4%
       information and auxiliary power units for New York City Transit                                  600
                                                                                                                                               594.0
       Authority (USA)                                                                                                                                                        553.9
                                                                                                        550                                                                                           511.1
      Stationary Transportation like-for-like with growth of 27.6% vs.                                 500
       FY 2017; Q2 2018 win of train formation unit project at Pintsch                                  450
                                                                                                                     393.5                     333.4
       Tiefenbach was one of the main contributors to this positive                                     400                                                                   326.0
       development                                                                                      350                                                                                           304.3
                                                                                                        300
      Like-for-like, overall increase of 8.4% or € 42.9 million, all segments
                                                                                                        250
       contributed to the growth
                                                                                                        200           87.0                     114.3                           77.1                    60.4
                                                                                                        150
                                                                                                        100
  Order book at end of 2018 at € 583.0 million,                                                         50
                                                                                                                     150.5                     146.3                          150.5                   146.3
   up 14.7% vs. € 508.3 million end of 2017                                                               0            0.3                         0.0                          0.3                     0.1
                                                                                                                     FY 2018                  FY 2017                        FY 2018                  FY 2017
                                                                                                                                Reported                                                 Like-for-like*
                                                                                                                Mobile Transportation Technology         Stationary Transportation Technology      Components   Other**

* Excluding Pintsch Bubenzer and Sepsa contributions: Pintsch Bubenzer was deconsolidated on 1 March 2018, Sepsa was classified as held for sale in November 2017
** Including consolidation effects
Financials - FY 2018                                                                   Investor Presentation                 April 2019                  29

Sales grow by 12% like-for-like, Mobile Transportation and Components
with strong performance

  Sales grow by 0.3% vs. FY 2017, an increase of € 1.7 million                                                                           External sales in € million **
      Significant volume increase in Mobile Transportation Technology                                  600                        0.3%
       (mainly Bode and Rawag) and strong sales volume development in
                                                                                                        550          518.3                     516.6
       Components
                                                                                                        500
                                                                                                                                                                                           12.1%
      Sales in Stationary Transportation significantly below                                           450
       prior year, mainly due to sale of Pintsch Bubenzer in Q1 2018                                                                                                          477.7
                                                                                                        400                                                                                         426.3
                                                                                                                                               265.3
                                                                                                        350
                                                                                                                     303.8

  Adjusted by the deconsolidation of Pintsch Bubenzer and                                              300                                                                    271.5
                                                                                                                                                                                                    228.0
   Sepsa growth of 12% vs. FY 2017                                                                      250
                                                                                                        200                                    120.5
                                                                                                                      69.1
                                                                                                        150                                                                    60.9                  70.8
  Sales split:                                                                                         100
                                                                                                                     145.2                     130.7                           145.2                130.7
            Germany 36%                                                                                  50
            Europe ex Germany 47%                                                                         0            0.2                         0.1                          0.1                  -3.2
            Rest of world 17%                                                                                        FY 2018                  FY 2017                         FY 2018               FY 2017
                                                                                                                                Reported                                                 Like-for-like*
                                                                                                                Mobile Transportation Technology         Stationary Transportation Technology   Components    Other**

* Excluding Pintsch Bubenzer and Sepsa contributions: Pintsch Bubenzer was deconsolidated on 1 March 2018, Sepsa was classified as held for sale in November 2017
** Including consolidation effects
Financials - FY 2018                                  Investor Presentation            April 2019           30

FY 2018 EBIT impacted by a number of one-off effects

  Reported FY 2018 EBIT at € -7.3                                    FY 2018 EBIT adjustments in € million
   million (€ -23.0 million in FY 2017),
   adjusted by one-off effects at
   € 16.0 million (€ 2.4 million in                                                                   5.2           -3.2           3.0          16.0
   FY 2017)

                                                                                       0.6
  Adjustments mainly driven by                                          3.8
    Impairments of Alte and Bode UK                     13.9
    Restructuring expenses (e.g.
     severance payments, consulting
     costs, CRO)

                                             -7.3
                                             EBIT     Impairments     Add. IFRS 5     Decon-      Restructuring    Provisions   Impairment      EBIT before
                                           reported   Alte, Bode UK   effect Sepsa   solidation     expenses      for onerous    own work      extraordinary
                                                                       real estate    Pintsch                      contracts     capitalised       items
                                                                                     Bubenzer
Financials - FY 2018                                                 Investor Presentation       April 2019        31

Significant EBIT improvement vs. FY 2017 both reported and before
extraordinary items
  Reported EBIT up by 68% or € 15.7 million vs. FY 2017                                                 EBIT in € million
                                                                                                 68.3%
                                                                                                                                       > 100%
  EBIT before extraordinary items at € 16.0 million (+€ 13.6                                                                 16.0
   million vs. FY 2017). Improvement mainly caused by:
    Sales growth in Components with high gross margins
    Positive effects from restructuring activities (e.g. Pintsch)                       -7.3

    Productivity improvements, material savings
    Sepsa classified as asset held for sale in 2017 with no impact on
     EBIT

                                                                                                                                                 2.4

                                                                                                         -23.0
                                                                                       FY 2018           FY 2017             FY 2018            FY 2017

                                                                                                  Reported                    Before exceptional items
Financials - FY 2018                                                 Investor Presentation       April 2019         32

Cash flow in FY 2018 is affected by sale of Pintsch Bubenzer,
capital increase and higher working capital

  Positive free cash flow driven by                                             In € million
     € 29.3 million cash inflow from sale of Pintsch Bubenzer                                                                                        +21.9
                                                                                                         Free cash flow
     € 15.6 million release of funds from an escrow account                                                                   -23.8
     Positive effects set off in part by higher working capital and release
      of provisions (e.g. PSD)
                                                                                                                              -26.3
                                                                                     Cash flow from financing activities
                                                                                                                                                     +20.0
  Financing cash flow in FY 2018 mainly reflects:
     € 46.5 million cash inflow from capital increase                                                                                        -0,1
                                                                                                                Other*
     € 74.7 million cash outflow due net repayment of loans                                                                                -1,0

                                                                                                                                       -4.5
                                                                                                              Cash flow
                                                                                                                                       -4.8

                                                                                                                   12M 2018      12 M2017

 * Includes change in cash funds due to exchange rate fluctuations
Financials - FY 2018                                                                    Investor Presentation             April 2019          33

Mobile Transportation Technology
Sales growth driven by positive development at Bode Group

  Increase in external order intake impacted by Sepsa (Kawasaki                                            External order intake and sales in € million *                      EBIT in € million
   Order / New York City Transit Authority) and growth at Bode
   Group                                                                                                  450             18.0%                                                  0

                                                                                                                 393.5                                                           -2
                                                                                                          400
                                                                                                                                                                                 -4
  External sales growth of € 38.5 million driven by Bode Group                                           350    67.5             333.4
                                                                                                                                                              14.5%              -6
                                                                                                                                   31.2          303.8                           -8
                                                                                                          300
                                                                                                                                                  32.3                          -10
  EBIT at € -22.8 million                                                                                                                                            265.3
                                                                                                                                                                                -12
                                                                                                          250                                                          37.3
      FY 2018 impacted by one-off effects amounting to € 21.9 million                                                                                                          -14
                                                                                                          200
         Impairment of Alte and Bode UK (€ 13.9 million)                                                                                                                       -16
                                                                                                                 326.0                                                          -18
         IFRS 5 effects from purchase of Sepsa real estate in Q3 2018 (€ 3.8 million)                    150                     302.2
                                                                                                                                                 271.5                          -20
         Restructuring costs Q4 2018 (€ 1.8 million)                                                     100
                                                                                                                                                                      228.0
                                                                                                                                                                                -22
      Negative operating contribution from Alte mainly due to ramp-up of                                                                                                       -24   -22.8
                                                                                                           50
       low-margin OEM projects and operational inefficiencies                                                                                                                   -26
                                                                                                                                                                                                -26.4
      Further improvements in productivity expected to have EBIT                                           0
                                                                                                                FY 2018           FY 2017       FY 2018               FY 2017
                                                                                                                                                                                -28
                                                                                                                                                                                      FY 2018   FY 2017
       impacts in 2019                                                                                              Order intake                              Sales
                                                                                                                                      Sepsa   Like for like

* Figures may not add up and/or match exactly with figures consolidated on Group level, due to rounding
Financials - FY 2018                                               Investor Presentation         April 2019             34

Stationary Transportation Technology
Stabilisation and positive impacts from restructuring activities

  External order intake down due to the sale of Pintsch                         External order intake and sales in € million                                EBIT in € million
   Bubenzer; like-for-like with a growth of 27.6%. FY 2018
   positively impacted by a significant order for a train formation            150                                                                         3.0    2.6
   unit                                                                        140                                                     -42.7%              2.5
                                                                                                -23.9%                                                     2.0
                                                                               130
                                                                                                                                                120.5      1.5
                                                                               120                       114.3
                                                                                                                                                           1.0
                                                                               110
  Sales decrease of 42.7% primarily driven by the sale of Pintsch             100
                                                                                                                                                           0.5
                                                                                                                                                 49.7      0.0
   Bubenzer; like-for-like sales down by € 9.9 million as a result              90     87.0
                                                                                                          53.9                                            -0.5
   of several customer push-outs                                                80      9.9                                                               -1.0
                                                                                                                             69.1
                                                                                70                                                                        -1.5
                                                                                                                              8.2                         -2.0
                                                                                60
                                                                                                                                                          -2.5
  EBIT at € 2.6 million                                                        50
                                                                                                                                                          -3.0
                                                                                40     77.1
    Improvement largely due to the release of provisions for onerous           30                        60.4               60.9
                                                                                                                                                 70.8     -3.5
                                                                                                                                                          -4.0
     contracts for the PSD project in Brazil and cost reductions, set off in    20                                                                        -4.5
     part by impairments on capitalised development costs                       10                                                                        -5.0
                                                                                 0                                                                        -5.5
    Positive EBIT effects resulting from restructuring activities and the            FY 2018            FY 2017         FY 2018                FY 2017                     -5.5
     renegotiation on PSD Sao Paulo will continue to impact 2019                           Order intake                                Sales                     FY 2018   FY 2017
                                                                                                             Bubenzer        Like for like
Financials - FY 2018                                           Investor Presentation        April 2019       35

Components
Ongoing strong operational performance

  Strong external order intake in FY 2018                                  External order intake and sales in € million                   EBIT in € million
                                                                                            2.9%
                                                                                                                        11.1%
                                                                                                                                                25.1
  External sales improves by € 14.5 million; ongoing high                160
                                                                                  150.5            146.3      145.2
                                                                                                                                          26
                                                                          150                                                             24
   demand of connectors, snap-action switches and contactors              140                                                                             21.4
                                                                                                                                130.7     22
                                                                          130
                                                                          120                                                             20
  EBIT improves to a very high level of € 25.1 million                   110                                                             18

    Positive EBIT development vs. FY 2017 driven by high sales volume,   100                                                             16
                                                                           90
     favorable product mix and additional productivity improvements        80
                                                                                                                                          14
                                                                                                                                          12
    Strong EBIT margins expected to be continued in 2019                  70
                                                                           60                                                             10
                                                                           50                                                              8
                                                                           40                                                              6
                                                                           30
                                                                                                                                           4
                                                                           20
                                                                           10                                                              2
                                                                            0                                                              0
                                                                                  FY 2018          FY 2017    FY 2018           FY 2017        FY 2018   FY 2017
                                                                                       Order intake                     Sales
Financials - FY 2018                                       Investor Presentation      April 2019               36

Equity substantially strengthened, net debt significantly reduced

  Equity increases by € 23.2 million following the successful                     Restructuring of equity and net debt in € million
   capital increase in February 2018;                                                                                             -36.6%
   equity ratio at 23.7% as of 31 December 2018                                              32.9%
                                                                           100                                      160
                                                                                                                                           158.4
   (up from 15.6% at year-end 2017)                                                 93.8
                                                                                                                    150
                                                                            90
                                                                                                                    140
                                                                            80                                      130
  Reduction of net debt by € 58.0 million in FY 2018                                                 70.6          120
                                                                            70                                      110
                                                                                                                          100.4
    Repayment of € 25.0 million in bridge financing                                                                100
                                                                            60
                                                                                                                     90
    Additional repayment of current account liabilities
                                                                            50                                       80
                                                                                                                     70
                                                                            40
                                                                                                                     60
                                                                            30                                       50
                                                                                                                     40
                                                                            20                                       30
                                                                                                                     20
                                                                            10
                                                                                                                     10
                                                                             0                                        0
                                                                                   FY 2018           FY 2017              FY 2018      FY 2017
                                                                                           Equity                               Net debt
Financial calendar and
contact details
2019

• 30 April 2019    3M 2019 Interim Statement
• 18 June 2019     Annual General Meeting
• 31 July 2019     6M 2019 Interim Report
• 31 October 2019 9M 2019 Interim Statement

         IR contact
         Wolfgang Güssgen
         Head of IR & CC
         guessgen@schaltbau.de
         T +49 89 93005-209

Schaltbau Holding AG
Hollerithstrasse 5
81829 Munich
Germany

www.schaltbaugroup.com                         iStockphoto LP
Appendix                                                              Investor Presentation        April 2019        38

Disclaimer

 This presentation contains forward-looking statements. These statements are based on the current views, expectations and assumptions of the management of
 Schaltbau Holding AG and involve known and unknown risks and uncertainties that could cause actual results, performance or events to differ materially from
 those expressed or implied in such statements. Actual results, performance or events may differ materially from those described herein due to factors affecting
 Schaltbau Holding AG such as, among other things, changes in the general economic and competitive environment, capital market risks, currency exchange
 rate fluctuations and competition from other companies, and changes in international and national laws and regulations, in particular with respect to tax laws and
 regulations. Schaltbau Holding AG does not assume any obligation to update any forward-looking statements.

 The information contained in this presentation is for background purposes only and does not purport to be full or complete. No reliance may be placed, for any
 purpose, on the information contained in this announcement or its accuracy or completeness. The information in this presentation is subject to change.
You can also read