INVESTOR PRESENTATION - Smart Today Smart Tomorrow - SmartCentres
←
→
Page content transcription
If your browser does not render page correctly, please read the page content below
INVESTOR PRESENTATION
Smart Today Smart Tomorrow
Based on 4th Quarter 2018
March 2019
BASED ON 4 TH QUARTER 2018

INVESTOR PRESENTATION
TABLE OF CONTENTS
▪ Track record of performance
▪ Portfolio overview
▪ Acquisitions
▪ Development / Intensification
▪ Financial highlights
▪ Development team
▪ Market factors
▪ Summary
▪ Appendix

SMARTCENTRES REAL ESTATE INVESTMENT TRUST
MARCH 2019 - INVESTOR PRESENTATION          2
BASED ON 4 TH QUARTER 2018

INVESTOR PRESENTATION
NOTICE TO READER
Readers are cautioned that certain terms used in this Investor Presentation (“Presentation”) such as Funds from Operations ("FFO"),
Adjusted Cashflow from Operations ("ACFO"), "Gross Book Value", "Payout Ratio", "Interest Coverage", "Total Debt to Adjusted
EBITDA" and any related per Unit amounts used by management to measure, compare and explain the operating results and
financial performance of the Trust do not have any standardized meaning prescribed under IFRS and, therefore, should not be
construed as alternatives to net income or cash flow from operating activities calculated in accordance with IFRS. These terms are
defined in this Presentation and reconciled to the consolidated financial information of the Trust in the Management’s Discussion and
Analysis (“MD&A”) for the year ended December 31, 2018. Such terms do not have a standardized meaning prescribed by IFRS and
may not be comparable to similarly titled measures presented by other publicly traded entities.

Certain statements in this Presentation are "forward-looking statements" that reflect management's expectations regarding the
Trust's future growth, results of operations, performance and business prospects and opportunities. More specifically, certain
statements contained in this Presentation, including statements related to the Trust's maintenance of productive capacity, estimated
future development plans and costs, view of term mortgage renewals including rates and upfinancing amounts, timing of future
payments of obligations, intentions to secure additional financing and potential financing sources, and vacancy and leasing
assumptions, and statements that contain words such as "could", "should", "can", "anticipate", "expect", "believe", "will", "may" and
similar expressions and statements relating to matters that are not historical facts, constitute "forward-looking statements". These
forward-looking statements are presented for the purpose of assisting the Trust's Unitholders and financial analysts in understanding
the Trust's operating environment, and may not be appropriate for other purposes. Such forward-looking statements reflect
management's current beliefs and are based on information currently available to management. However, such forward-looking
statements involve significant risks and uncertainties. A number of factors could cause actual results to differ materially from the
results discussed in the forward-looking statements. Although the forward-looking statements contained in this Presentation are
based on what management believes to be reasonable assumptions, the Trust cannot assure investors that actual results will be
consistent with these forward-looking statements. The forward-looking statements contained herein are expressly qualified in their
entirety by this cautionary statement. These forward-looking statements are made as at the date of this Presentation and the Trust
assumes no obligation to update or revise them to reflect new events or circumstances unless otherwise required by applicable
securities legislation.

SMARTCENTRES REAL ESTATE INVESTMENT TRUST
MARCH 2019 - INVESTOR PRESENTATION                                                                                                  3
TRACK RECORD OF PERFORMANCE

HIGHLIGHTS

▪ One of Canada’s premier REITs

▪ $5.5 billion equity capitalization

▪ $9.5 billion total asset value

▪ Approximately 20 million sf. of mixed-use development on 76 properties
  identified so far:
  • residential – apartments, condominiums, and townhomes
  • office buildings
  • retirement living residences
  • self-storage facilities
  • medical facilities

▪ 157 properties – 152 shopping centres, 4 mixed-use properties and 1 office
  property

▪ TSX:SRU.UN

SMARTCENTRES REAL ESTATE INVESTMENT TRUST
MARCH 2019 - INVESTOR PRESENTATION                                             4
TRACK RECORD OF PERFORMANCE

THE CONTINUING EVOLUTION

Barrie South SmartCentre                Mascouche SmartCentre

   MITCHELL
                                       JOINT VENTURE
   GOLDHAR

 1989-1994                                    1999              2015   2018

SMARTCENTRES REAL ESTATE INVESTMENT TRUST
MARCH 2019 - INVESTOR PRESENTATION                                            5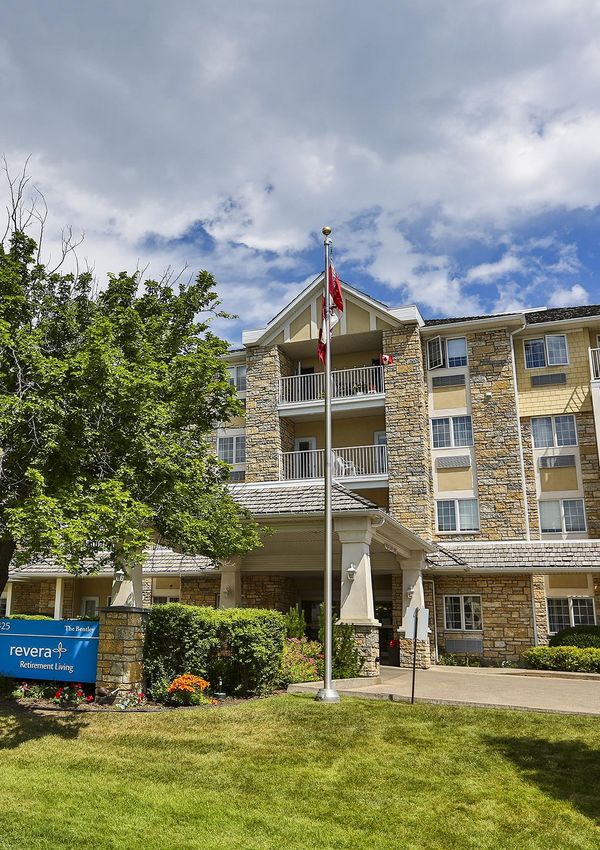
TRACK RECORD OF PERFORMANCE

TOTAL RETURN TO UNITHOLDERS

15.8% AVERAGE ANNUAL RETURN SINCE IPO
(as of February 27, 2019)

 $1,200

                                                                                      $1,086.46
 $1,000

   $800

   $600
                                                                                      $524.78

   $400                                                                               $379.54

   $200

      $0

                                     SmartCentres   TSX Capped REIT   TSX Composite

SMARTCENTRES REAL ESTATE INVESTMENT TRUST
MARCH 2019 - INVESTOR PRESENTATION                                                           6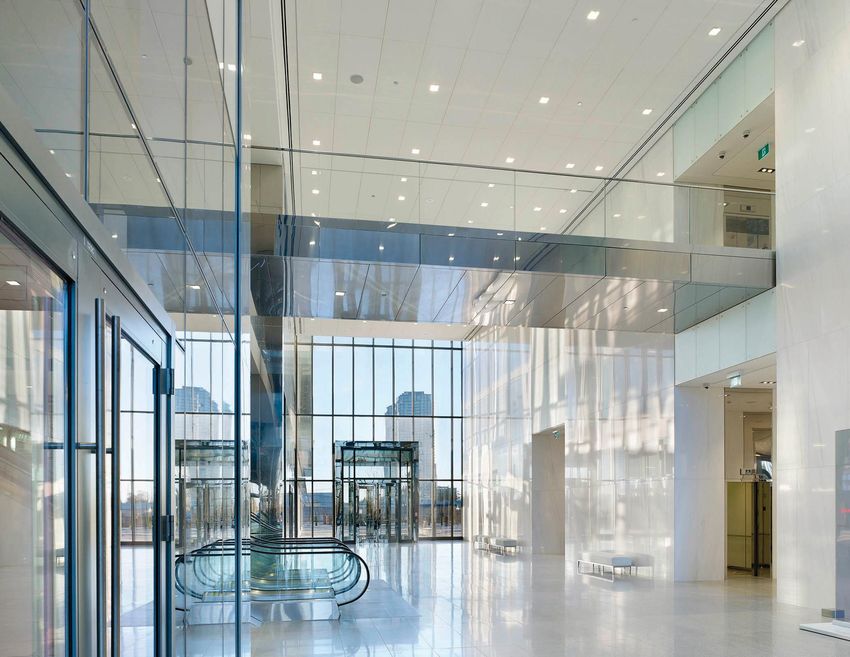
TRACK RECORD OF PERFORMANCE

GROWTH IN RENTAL REVENUE AND FFO/UNIT

RENTAL REVENUE                                            FFO
(in millions of $)                                        ($ per unit)

6.8% CAGR                                                 4.0% CAGR
since 2014                                                since 2014

                                                                                                              2.28
                                                   791                               2.17         2.20
                                            741                          2.10
                                 728
                                                             1.95
                   670
    608

    2014          2015          2016        2017   2018     2014         2015       2016*        2017         2018

                                                          * Excludes $0.06 per unit of non-recurring income
SMARTCENTRES REAL ESTATE INVESTMENT TRUST
MARCH 2019 - INVESTOR PRESENTATION                                                                                   7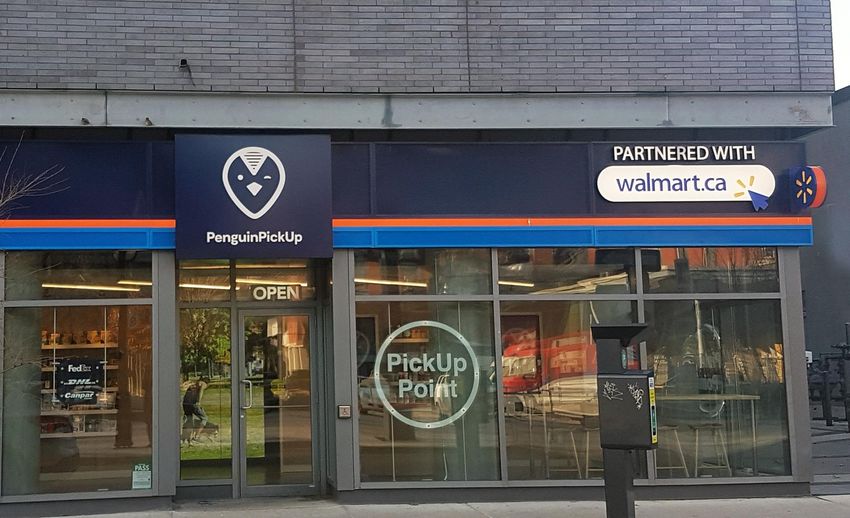
TRACK RECORD OF PERFORMANCE

GROWTH IN TOTAL ASSETS

TOTAL ASSETS
(in millions of $)

32.2% CAGR
                                                                                                                         9,380 9,460
                                                                                                                 8,739
since 2002                                                                                               8,505

                                                                                           7,070 7,107
                                                                                   6,480
                                                                           5,956

                                                      4,194 4,237 4,374
                                              3,894
                                      3,584

                             2,564

                     1,015

  109      229

 2002     2003       2004    2005     2006    2007    2008   2009   2010   2011    2012    2013   2014   2015    2016    2017   2018

SMARTCENTRES REAL ESTATE INVESTMENT TRUST
MARCH 2019 - INVESTOR PRESENTATION                                                                                                 8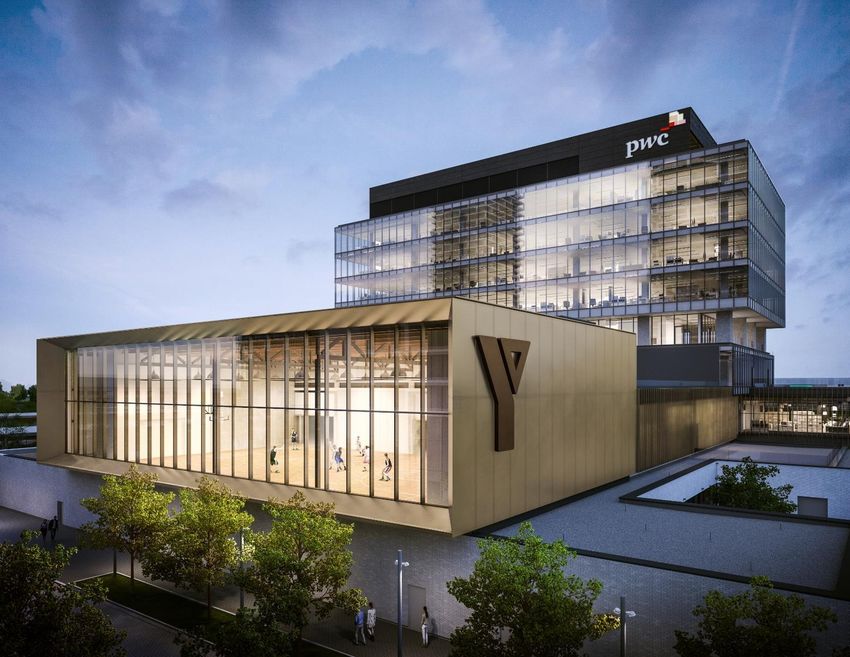
WHAT MAKES SMARTCENTRES STRONG

  AN EXCEPTIONAL                             OUTSTANDING
                                                              OUR HEALTHY
    PIPELINE OF                             QUALITY OF OUR
                                                             BALANCE SHEET
     MIXED-USE                                SHOPPING
                                                             AND FINANCIAL
      GROWTH                                  CENTRES &
                                                               FLEXIBILITY
    INITIATIVES                                TENANTS

                              CONSERVATIVE           THE QUALITY
                                PROPERTY              AND DEPTH
                             VALUATIONS AND            OF OUR
                               SIGNIFICANT          DEVELOPMENT
                               NAV GROWTH            TEAM AND JV
                                POTENTIAL           RELATIONSHIPS

SMARTCENTRES REAL ESTATE INVESTMENT TRUST
MARCH 2019 - INVESTOR PRESENTATION                                       9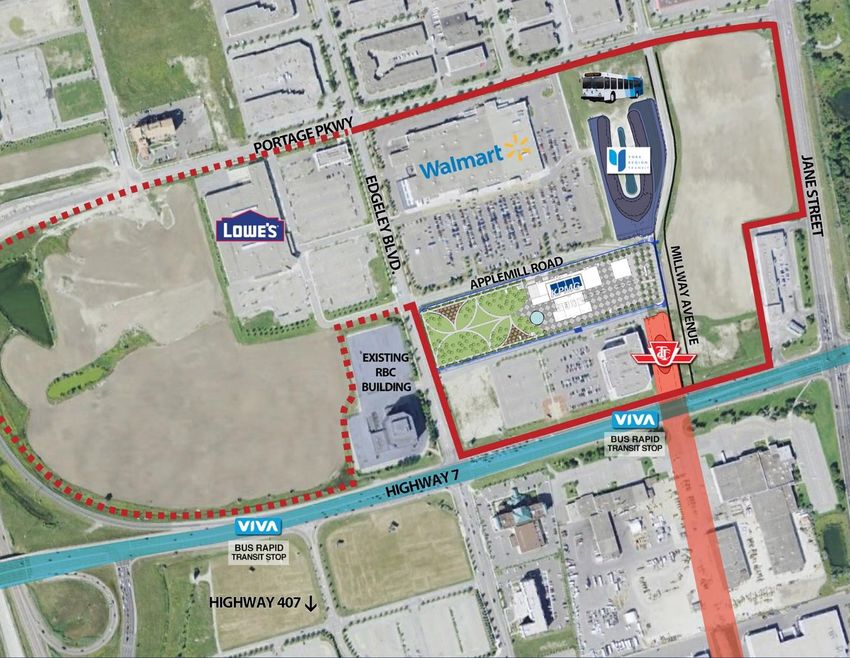
PORTFOLIO OVERVIEW

VALUE AND CONVENIENCE IN ONE STOP

▪ 34.4 million sf. of principally open format shopping centre space

▪ Average age: 14.8 years (youngest in the industry)
  • Lower capital expenditures

▪ Coast to coast locations
  • 84% are urban or near urban markets
  • 83% by square feet in Ontario, Quebec and BC

▪ Virtually 100% of centres contain both a food store and a pharmacy, in a
  Walmart store or independently or both

▪ Strong value orientation of our tenants

▪ Results in high degree of stability:
  • Average occupancy of 98.9% since 2005

SMARTCENTRES REAL ESTATE INVESTMENT TRUST
MARCH 2019 - INVESTOR PRESENTATION                                           10
PORTFOLIO OVERVIEW

 STRATEGICALLY LOCATED

                PROVINCE
                                                                                        157    Properties*
       # Properties /
# Intensification Properties                                                       76 Intensification Properties
                                                                                        34.4M SF.*

                              ALBERTA              MANITOBA

                               7/2                  3/1
              BRITISH
             COLUMBIA                                                         QUEBEC

             14 / 6                     SASKATCHEWAN               ONTARIO   23 / 18             ATLANTIC

                                             5/2                 95 / 47                         10 / 0

  * Excludes 7 development sites totalling 0.6 million sf. upon
    completion and an additional 2.6 million sf. of retail development
    density associated with existing retail centres.

 SMARTCENTRES REAL ESTATE INVESTMENT TRUST
 MARCH 2019 - INVESTOR PRESENTATION                                                                          11
PORTFOLIO OVERVIEW MARKET CONDITIONS – CANADA VS. UNITED STATES ▪ Much lower square feet of retail per person (15 vs. 23) in Canada (traditionally drives higher rents per square foot) ▪ In both countries, luxury and discount retail brands are performing best, consistent with trend in population discretionary income patterns ▪ When combined with Canadians’ value orientation, all population segments shop at Walmart, dollar stores, TJX banners, and other value chains (the focus of SmartCentres’ tenant mix) ▪ Open Format retail and Big Box retail are newer in Canada, so centres remain very relevant to consumers’ daily shopping habits ▪ Rate and stage of E-commerce penetration is much slower in Canada due to small market size, lower population, density, cost of shipping, etc. ▪ Canada has already rationalized its department store base (Zellers, Target, Sears gone) SMARTCENTRES REAL ESTATE INVESTMENT TRUST MARCH 2019 - INVESTOR PRESENTATION 12
PORTFOLIO OVERVIEW

STABLE INCOME BASE

LEASE MATURITY BY AREA
(in millions of square feet)

                                            1.6
                                                    2.3      1.5
                 1.9          1.7
                                            0.9              0.6
                              0.8                    0.7                               0.6
                  0.8
                                            1.9              2.0
                                                                       0.7    0.7
                                                                                       0.4
                                                                                             0.6
                                                                       0.2
     1.1          1.1         1.4                    1.4                      0.5      1.2   0.2
                                                                                                       0.6
     0.1
                                                                       0.7
                                                                              0.3            0.6
                                                                                                      0.1
                                                                                                                 0.7
    2019        2020         2021           2022    2023     2024     2025    2026    2027   2028   Month-to-   Vacant
                                                                                                     month

                                                   Walmart     Other Anchor   Non-Anchor
Average roll of 2.3 million sf. annually (6.6% of total GLA per year)

▪ Average lease term of 5.4 years
▪ Average remaining lease term of 6.6 years for Walmart, with multiple renewal options of up to
  80 years
▪ Average remaining lease term excluding Walmart is 4.6 years
▪ 2,475,403 sf. or 69.5% of 2019 lease maturities have been renewed or near completion
▪ Average “same property” NOI growth is 1.0% to 1.5% p.a.
SMARTCENTRES REAL ESTATE INVESTMENT TRUST
MARCH 2019 - INVESTOR PRESENTATION                                                                                       13
PORTFOLIO OVERVIEW
WELL TENANTED, HIGH QUALITY
Top ten tenants by gross rental revenues of SmartCentres' Portfolio as of
December 31, 2018:
% of
Average DBRS S&P Moody’s
Number of Gross
Tenant Remaining Credit Credit Credit
Stores Rental
Lease Term Rating Rating Rating
Revenues
Walmart 101 25.7 6.6 AA AA Aa2
Canadian Tire, Mark's and FGL Sports 71 4.5 5.0 BBB (high) BBB+ n/a
Winners, HomeSense, Marshalls 55 4.0 4.8 n/a A+ A2
Loblaws and Shoppers Drug Mart 24 2.7 7.0 BBB BBB n/a
Lowe's, RONA 9 2.4 5.4 A (low) BBB+ Baa1
Sobeys 18 2.3 4.3 BB (high) BB+ n/a
Reitmans 91 2.0 2.7 n/a n/a n/a
Best Buy 22 1.8 2.4 n/a BBB Baa1
Dollarama 52 1.7 4.0 BBB n/a n/a
Michaels 25 1.5 3.5 n/a n/a Ba2
Total 468 48.6 5.9
SMARTCENTRES REAL ESTATE INVESTMENT TRUST
MARCH 2019 - INVESTOR PRESENTATION 14PORTFOLIO OVERVIEW CURRENT LEASING ENVIRONMENT ▪ All major national and regional retailers continue to grow and SmartCentres continues to deliver at 98% occupancy ▪ Value segment still growing – Dollar stores, Winners, Marshalls, HomeSense, sporting goods, services, and food ▪ Delivering additional services and amenities to every location continues to be a priority (fitness, entertainment, restaurants, pet stores, pop-ups, etc.) SMARTCENTRES REAL ESTATE INVESTMENT TRUST MARCH 2019 - INVESTOR PRESENTATION 15
DEVELOPMENT / INTENSIFICATION

GROWTH STRATEGY

▪ Continue review of every property for mixed-use intensification initiatives,
  with 76 properties specifically identified to date and encompassing over 168
  intensification projects

▪ Joint venture relationships are being added to optimize investment returns,
  project quality and operational effectiveness

▪ In addition to existing land banks, we own over 2,600 acres of additional
  density at grade on our sites, of which over half are in the six major urban
  markets – much of what can be intensified over time

▪ Including retail development, total expenditures on projects to commence
  construction over the next five years estimated to exceed $9.5 billion ($3.3
  billion at our share)

SMARTCENTRES REAL ESTATE INVESTMENT TRUST
MARCH 2019 - INVESTOR PRESENTATION                                               16
DEVELOPMENT TEAM

ABILITY TO EXECUTE

            STRONG,
                                                           PARTNER
      EXPERIENCED IN-HOUSE
                                                        RELATIONSHIPS
       DEVELOPMENT TEAM

                                             GOVERNMENT/
                                             CONSULTANT
                                            RELATIONSHIPS

SMARTCENTRES REAL ESTATE INVESTMENT TRUST
MARCH 2019 - INVESTOR PRESENTATION                                      17
DEVELOPMENT TEAM IN-HOUSE DEVELOPMENT TEAM Employees in Development & Leasing Related Functions: ▪ Number of People: 151 ▪ Number of Years Experience with SmartCentres • Average: 7 years • Total: 1,092 years ▪ Number of Years Experience in Real Estate • Average: 16 years ▪ Total: 2,400 years SMARTCENTRES REAL ESTATE INVESTMENT TRUST MARCH 2019 - INVESTOR PRESENTATION 18
DEVELOPMENT TEAM

IN-HOUSE DEVELOPMENT RESOURCES

                                                                              ENVIRONMENTAL
      PLANNERS /                                               GOVERNMENT
                                            ENGINEERS                            / GEOTECH
      DEVELOPERS                                                RELATIONS
                                                                                SPECIALISTS

                                LEASING            CONSTRUCTION        ARCHITECTS

                                                        FINANCE /
                               LAWYERS                  FINANCIAL      MARKETING
                                                        ANALYSTS

SMARTCENTRES REAL ESTATE INVESTMENT TRUST
MARCH 2019 - INVESTOR PRESENTATION                                                        19
STRATEGIC RELATIONSHIPS SMARTCENTRES REAL ESTATE INVESTMENT TRUST MARCH 2019 - INVESTOR PRESENTATION 20
STRATEGIC RELATIONSHIP

WALMART CANADA

NUMBER OF
WALMART
STORES                                                        230                                        296

                                                               13                                        14
                                                               96                                        101

                                                      Supercentres (339)*                     Total Walmart Stores (411)*

                                                           Other     SmartCentres Shadow   SmartCentres Tenants

                                       * Company source as at February 27, 2019

▪ Walmart Canada attributes
  • Value pricing and fresh food generates huge traffic
  • Customer traffic increasing and food market share increasing
  • Benefiting from the closure of Target and Sears – little competition in the discount general
    merchandise space
▪ 76% of Canadians live within 10 km of a Walmart
SMARTCENTRES REAL ESTATE INVESTMENT TRUST
MARCH 2019 - INVESTOR PRESENTATION                                                                                          21
STRATEGIC RELATIONSHIP
MITCHELL GOLDHAR
M I TC HE LL
GO LD HAR
▪ JV Partner
• Vaughan Metropolitan Centre
• StudioCentre / Eastern Avenue
• Salmon Arm SmartCentre
▪ Consultant on development and mixed-use projects
▪ Executive Chairman, Trustee and Investment
Committee member
SMARTCENTRES REAL ESTATE INVESTMENT TRUST
MARCH 2019 - INVESTOR PRESENTATION 22STRATEGIC RELATIONSHIP
SIMON PROPERTY GROUP
▪ Largest public real estate company in the U.S.
▪ Engaged primarily in retail real estate properties
including regional malls, Premium Outlets and The
Mills®
▪ Exceptional relationships with the world’s largest
retailers provides strong tenant base for Premium sites
▪ Canada is part of a continuing global expansion
SMARTCENTRES REAL ESTATE INVESTMENT TRUST
MARCH 2019 - INVESTOR PRESENTATION 23STRATEGIC RELATIONSHIP TRANSIT CITY CONDOS
CONDOMINIUMS
WITH CENTRECOURT
▪ Partner for first three 55-storey
sold-out towers at VMC
▪ Partner for VMC towers 4 & 5 –
Spring 2019 marketing launch
▪ GTA focused:
• 2,000 units completed
• 4,000 units under active
construction
▪ Initial discussions for other
projects
SMARTCENTRES REAL ESTATE INVESTMENT TRUST
MARCH 2019 - INVESTOR PRESENTATION 24STRATEGIC RELATIONSHIP RETIREMENT HOMES WITH REVERA ▪ Leading owner, operator and investor in the senior living sector through various partnerships own over 500 properties in Canada, the United States, and the United Kingdom serving over 55,000 seniors ▪ Joint venture with Revera, first 3 sites announced – 2 in Vaughan and 1 in Oakville. ▪ Expect to complete 5 projects per year ▪ Typical building size is 140,000 sf., with investment including land of up to $100 million per site ▪ Yields in the 6.0% - 8.0% range on cost SMARTCENTRES REAL ESTATE INVESTMENT TRUST MARCH 2019 - INVESTOR PRESENTATION 25
STRATEGIC RELATIONSHIP

SELF-STORAGE
WITH SMARTSTOP

▪ Diversified real estate company
  focused on self-storage,
  student and senior housing.
  Portfolio currently includes
  80,000 self storage units,
  9.4 million rentable square feet,
  and $1.8 billion of real estate
  assets under management.
  Buildings on average 100,000
  to 130,000 sf.

▪ Development yield expected to
  be 7.0% to 8.5%

▪ Additional returns from sale of
  land into the JV

▪ 6 sites approved in the GTA,
  with expansion across country
  planned

SMARTCENTRES REAL ESTATE INVESTMENT TRUST
MARCH 2019 - INVESTOR PRESENTATION          26
STRATEGIC RELATIONSHIP

                                            JADCO CORPORATION

                                            ▪ Well reputed family-owned business

                                            ▪ Has gained a strong foothold in the residential sector in
                                              the Greater Montreal Area

                                            ▪ Strengths lie in its commitment to excellence in building
                                              exceptional living and mixed-used environments

                                            ▪ Diversified portfolio comprised of luxury residential,
                                              upscale rental and mixed-used projects such as
                                              Paton1, Quintessence and Équinoxe

SMARTCENTRES REAL ESTATE INVESTMENT TRUST
MARCH 2019 - INVESTOR PRESENTATION                                                                     27
STRATEGIC RELATIONSHIP
FIELDGATE HOMES
▪ Private company in residential development business
for more than 60 years
▪ Primarily focused on GTA
▪ Over 12,000 homes built
SMARTCENTRES REAL ESTATE INVESTMENT TRUST
MARCH 2019 - INVESTOR PRESENTATION 28STRATEGIC RELATIONSHIP ONLY “OMNI CHANNEL” LANDLORD Penguin Pick-Up & Penguin Fresh SMARTCENTRES REAL ESTATE INVESTMENT TRUST MARCH 2019 - INVESTOR PRESENTATION 29
DEVELOPMENT / INTENSIFICATION

GROWTH INITIATIVES

                                              VAUGHAN
            RESIDENTIAL                     METROPOLITAN    RETAIL
                                               CENTRE

                 APARTMENT                     SENIOR      BUILD-OUT OF
                  RENTALS                    RESIDENCES      EXISTING

                                                            PREMIUM
                                                SELF-
             CONDOMINIUMS                                   OUTLETS
                                              STORAGE
                                                            CENTRES

               TOWNHOUSES                      OFFICE

SMARTCENTRES REAL ESTATE INVESTMENT TRUST
MARCH 2019 - INVESTOR PRESENTATION                                        30
DEVELOPMENT / INTENSIFICATION
TECHNOLOGY INITIATIVES
MOBILE CHARGING DIGITAL
ADVERTISING STATIONS SIGNS
WIFI ADVERTISING BUILDING
NETWORKS KIOSKS SYSTEMS
ALL INITIATIVES DESIGNED TO CREATE VALUE ADD FOR VISITORS
TO OUR SITES AND ALSO DRIVE ADDITIONAL REVENUE
SMARTCENTRES REAL ESTATE INVESTMENT TRUST
MARCH 2019 - INVESTOR PRESENTATION 31DEVELOPMENT / INTENSIFICATION
MAJOR MIXED-USE REAL ESTATE INITIATIVES
Estimated Costs ($M) Estimated Gain on Final Sale
GLA SRU 100%
Site Project Type ('000sf) / Completion % Share Share SRU Share Yield Profit % SRU Share Timing
Units Year
1. VMC (Office Towers) a. KPMG (T#1) Office 360sf 2016 50% $180 $90.0 5.7% — — —
b. PWC (T#2) Office 105sf 2019 50% $65 $32.5 4.5%-5.5% — — —
c. Office (T#3) Office 600sf 2024 50% $375 $187.5 4.8%-5.5% — — —
d. Office (T#4) Office 300sf 2026 50% $210 $105.0 4.8%-5.5% — — —
(1)
2. Toronto Premium Outlets Phase II (JV) Retail 144sf Nov 2018 50% $133 $66.5 8.0%-8.5% — — —
(Simon Property Group)
(1)
3. Montreal Premium Outlets Phase II (JV) Retail 140sf 2022-2023 50% $56 $28.0 9%-10% — — —
(Simon Property Group)
4. New Premium Outlets Premium (JV) Retail 360sf 2022 50% $136 $68.0 8.0%-8.5% — — —
(Simon Property Group)
(2)
5. Laval Centre Jadco (2 Bldgs) Apartments 338 Units 2020-2022 50% $82 $41.0 5.3%-5.8% — — —
6. VMC (Condos) CentreCourt Transit City 1 551 Units 2020 25% $181 $45.3 N/A 25%-30% 25% 2020
CentreCourt Transit City 2 559 Units 2020 25% $189 $47.3 N/A 25%-30% 25% 2020
CentreCourt Transit City 3 606 Units 2021 25% $190 $47.5 N/A 20%-25% 25% 2021
CentreCourt Transit City 4 497 Units 2023 25% $200 $50.0 N/A 20%-25% 25% 2023
CentreCourt Transit City 5 518 Units 2023-2024 25% $200 $50.0 N/A 20%-25% 25% 2023-2024
(2)
7. VMC (Apartments) VMC Rental Apartments Apartments 480 Units 2023-2024 50% $220 $110.0 4.2%-4.8% — — —
8. Vaughan NW Fieldgate Low/Mid Rise 230-300 2021-2022 50% $150-$200 $75-$100 N/A 15%-20% 50% 2021-2022
Residential Units
(2)
9. Ottawa Laurentian JV Partner Apartments/ 400 Units 2022 50% $150 $75.0 6.0%-7.0% — — —
Retirement
Homes
(2)
10. Multiple Locations Self-Storage (JV) Self-Storage 500sf built 2019-2025 50% $60M per $30M per 7.0%-8.5% — — —
(6 Approved Projects – (SmartStop) (4 to 5 new per year in year in each year in each
Toronto (Leaside), Oshawa, facilities each each of of years 1-5 of years 1-5
Brampton (2 projects), year) years 1-5
Vaughan, Toronto
(Scarborough))
SMARTCENTRES REAL ESTATE INVESTMENT TRUST
MARCH 2019 - INVESTOR PRESENTATION 32DEVELOPMENT / INTENSIFICATION
MAJOR MIXED-USE REAL ESTATE INITIATIVES
Estimated Costs ($M) Estimated Gain on Final Sale
GLA SRU 100%
Site Project Type ('000sf) / Completion % Share Share SRU Share Yield Profit % SRU Share Timing
Units Year
11. StudioCentre (Toronto) SRU-Penguin JV Mixed-Use 150sf 2022-2023 50% $53 $26.5 6.0%-7.0% — — —
(Office, Studio,
Hotel)
12. Pointe-Claire Rental Apartments Apartments 480 Units 2022-2023 50% $155 $77.4 4.4%-5.0% — — —
(2)
(Apartments) (2 Bldgs)
13. Pointe-Claire (Condo) Condo Condo 200 Units 2024 50% $55 $27.4 N/A 10%-15% 50% 2024
(2)
14. Multiple Locations Retirement Living Retirement 600sf built 2022-2025 50% $100M per $50M per 6.0%-8.0% — — —
(3 Approved Projects – Residences (JV) Residences & per year in year per site year per site
Vaughan (2 projects), (Revera) Seniors each of in each of in each of
Oakville) Apartments years 1-5 years 1-5 years 1-5
(3 to 5 new
facilities each
year)
Notes:
(1) The Phase II expansions for both the Toronto Premium Outlets and the Montreal Premium Outlets are included in the future development pipeline as Developments.
(2) Stabilization is estimated to be 1 to 3 years after completion.
(3) Estimated Transactional FFO Gains on Sale related to parcel sales of land into Joint Ventures estimated at 1%-2% of annual FFO at SmartCentres' ownership share.
In addition to the projects set out in the table above (with the exception of the projects listed in Note 1), SmartCentres' pipeline also includes approximately 3.2 million square feet of future developments
as set out in the table shown on the “Future Earnouts and Developments” section. Also in addition to the above, SmartCentres has a further mixed-use development pipeline estimated at 4.5 million
square feet in projects that are underway or active. Further, SmartCentres will initiate activities in the short-term to work towards development of a further estimated 12.5 million to 15 million square feet
in mixed-use initiatives that will be completed in the longer-term.
SMARTCENTRES REAL ESTATE INVESTMENT TRUST
MARCH 2019 - INVESTOR PRESENTATION 33DEVELOPMENT / INTENSIFICATION
INITIATIVES
MIXED-USE RETAIL
INTENSIFICATION DEVELOPMENTS
UNDERWAY ACTIVE FUTURE UNDERWAY ACTIVE FUTURE
33 49 86+ 26 35 2+
168+ Projects
(on 76 Properties)
SMARTCENTRES REAL ESTATE INVESTMENT TRUST
MARCH 2019 - INVESTOR PRESENTATION 34DEVELOPMENT / INTENSIFICATION
BY ASSET CLASS
SELF-STORAGE
UNDERWAY ACTIVE FUTURE
13 14 11+
OFFICE
UNDERWAY ACTIVE
1 2
SENIORS RESIDENCES
UNDERWAY ACTIVE FUTURE
2 16 30+
SMARTCENTRES REAL ESTATE INVESTMENT TRUST
MARCH 2019 - INVESTOR PRESENTATION 35DEVELOPMENT / INTENSIFICATION
BY ASSET CLASS
APARTMENT RENTALS
UNDERWAY ACTIVE FUTURE
9 7 22+
CONDOMINIUMS
UNDERWAY ACTIVE FUTURE
7 9 13+
TOWNHOUSES
UNDERWAY ACTIVE FUTURE
1 4 10+
SMARTCENTRES REAL ESTATE INVESTMENT TRUST
MARCH 2019 - INVESTOR PRESENTATION 36DEVELOPMENT / INTENSIFICATION
BY ASSET CLASS
RETAIL BUILD-OUT EXISTING
UNDERWAY ACTIVE
23 34
PREMIUM OUTLET CENTRES
EXISTING EXPANSIONS FUTURE
2 2 2
SMARTCENTRES REAL ESTATE INVESTMENT TRUST
MARCH 2019 - INVESTOR PRESENTATION 37DEVELOPMENT / INTENSIFICATION VAUGHAN METROPOLITAN CENTRE (VMC) TORONTO ▪ A long term build (10 – 15 years) ▪ A 50:50 JV between SmartCentres and Penguin Properties. Mitchell Goldhar intimately involved in all aspects of the project ▪ Potential density of 18 – 19 million sf. of residential, office and retail development for the whole 100-acre site ▪ At its 50% ownership, SmartCentres lands (approximately 25 acres) represent 4.5 – 5.5 million sf. of potential development ▪ Transit infrastructure, including TTC subway and VIVA bus opened in December 2017, and York regional bus station to open early in 2019 SMARTCENTRES REAL ESTATE INVESTMENT TRUST MARCH 2019 - INVESTOR PRESENTATION 38
DEVELOPMENT / INTENSIFICATION

VMC
TORONTO
Aerial Overview – Existing Conditions

SMARTCENTRES REAL ESTATE INVESTMENT TRUST
MARCH 2019 - INVESTOR PRESENTATION          39
DEVELOPMENT / INTENSIFICATION

VMC
TORONTO
Transit Overview

                                    BUS TERMINAL
                                    OPEN 2019

                                                        VMC
                                                   OPEN 2017

SMARTCENTRES REAL ESTATE INVESTMENT TRUST
MARCH 2019 - INVESTOR PRESENTATION                             40
DEVELOPMENT / INTENSIFICATION VMC TORONTO Master Plan SMARTCENTRES REAL ESTATE INVESTMENT TRUST MARCH 2019 - INVESTOR PRESENTATION 41
DEVELOPMENT / INTENSIFICATION

VMC
TORONTO
Central Park

SMARTCENTRES REAL ESTATE INVESTMENT TRUST
MARCH 2019 - INVESTOR PRESENTATION          42
DEVELOPMENT / INTENSIFICATION

VMC
TORONTO
VMC Subway Station, SC Home Office,
KPMG Tower, and PwC-YMCA Tower

SMARTCENTRES REAL ESTATE INVESTMENT TRUST
MARCH 2019 - INVESTOR PRESENTATION          43
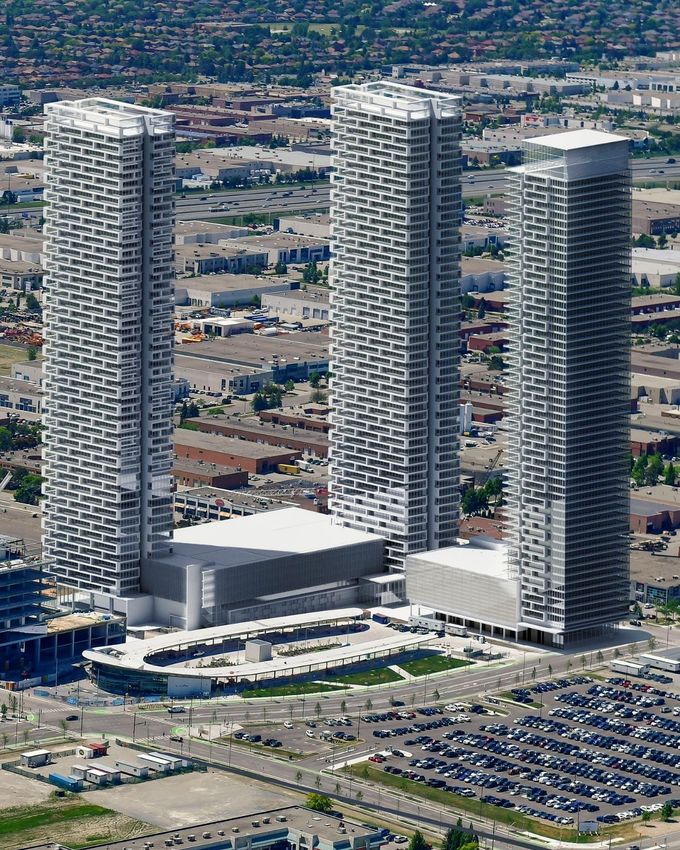
DEVELOPMENT / INTENSIFICATION

VMC
TORONTO
Aerial – 3 Towers Superimposed

SMARTCENTRES REAL ESTATE INVESTMENT TRUST
MARCH 2019 - INVESTOR PRESENTATION          44
DEVELOPMENT / INTENSIFICATION

VMC
TORONTO
KPMG Tower Lobby

SMARTCENTRES REAL ESTATE INVESTMENT TRUST
MARCH 2019 - INVESTOR PRESENTATION          45
DEVELOPMENT / INTENSIFICATION

VMC
TORONTO
PwC-YMCA Tower Rendering

SMARTCENTRES REAL ESTATE INVESTMENT TRUST
MARCH 2019 - INVESTOR PRESENTATION          46
DEVELOPMENT / INTENSIFICATION

VMC
TORONTO
PwC-YMCA – Construction

SMARTCENTRES REAL ESTATE INVESTMENT TRUST
MARCH 2019 - INVESTOR PRESENTATION          47
DEVELOPMENT / INTENSIFICATION

VMC
TORONTO
PwC-YMCA Tower Under Construction

SMARTCENTRES REAL ESTATE INVESTMENT TRUST
MARCH 2019 - INVESTOR PRESENTATION          48
DEVELOPMENT / INTENSIFICATION

VMC TORONTO
PHASES 1 & 2 OFFICE
▪ KPMG Tower complex with 365,000 sf. of LEED Gold space, opened in
  2016 (300,000 sf. of office space 100% leased)

▪ 16th Annual Real Estate Excellence (REX) Award for Office Development of
  the Year for the GTA

▪ Tenants include:

▪ Second mixed-use tower under construction, with YMCA, Library and
  community space for 100,000 sf. and PwC has taken 80,000 sf. of office
  space

▪ Nine-acre urban park is a key component of the master plan

▪ SmartCentres home office to move into two-storey former retail building
  adjacent to subway station
SMARTCENTRES REAL ESTATE INVESTMENT TRUST
MARCH 2019 - INVESTOR PRESENTATION                                          49
DEVELOPMENT / INTENSIFICATION

VMC TORONTO
RESIDENTIAL
▪ First residential development is a JV with CentreCourt Developments, an
  experienced GTA-based condominium developer

▪ Initial plan was for a 55 story condominium tower with over 500 suites,
  anchored by a BUCA-branded restaurant and BAR BUCA, together with an
  associated parking facility

▪ First tower fully sold in 7 days at higher than initially projected pricing, so
  second and third towers launched early, which also sold out at strong pricing

▪ Additional condominium towers and residential rental apartments expected
  to be developed. Next phase, to the east of the bus terminal, to include two
  condominium towers and one rental apartment

▪ Sales centre has been built on-site to allow potential tenants to see suite
  layouts, finishes, etc.

SMARTCENTRES REAL ESTATE INVESTMENT TRUST
MARCH 2019 - INVESTOR PRESENTATION                                              50
DEVELOPMENT / INTENSIFICATION

VMC
TORONTO
Transit City 1, 2 & 3 Towers Under Construction

SMARTCENTRES REAL ESTATE INVESTMENT TRUST
MARCH 2019 - INVESTOR PRESENTATION                51
DEVELOPMENT / INTENSIFICATION

VMC
TORONTO
Rendering of Transit City in the East Block

SMARTCENTRES REAL ESTATE INVESTMENT TRUST
MARCH 2019 - INVESTOR PRESENTATION            52
DEVELOPMENT / INTENSIFICATION

VAUGHAN NW TORONTO
RESIDENTIAL
▪ Existing Walmart anchored shopping centre at Major Mackenzie Drive and
  Weston Road in Vaughan

▪ JV with Fieldgate on 16-acre site for 230-300 freehold townhomes to be
  built, municipal approval for Phase 1 and construction to commence in 2020
  and possession to occur in 2021 and into 2022

▪ JV with SmartStop for a co-owned self-storage facility

▪ In the process of obtaining approvals on the remaining 6 acres to add
  mixed-use density including 800,000 sf. of seniors housing, condominium
  and rental accommodation

SMARTCENTRES REAL ESTATE INVESTMENT TRUST
MARCH 2019 - INVESTOR PRESENTATION                                          53
DEVELOPMENT / INTENSIFICATION

VAUGHAN NW
TORONTO
Mixed-Use

SMARTCENTRES REAL ESTATE INVESTMENT TRUST
MARCH 2019 - INVESTOR PRESENTATION          54
DEVELOPMENT / INTENSIFICATION

VAUGHAN NW
TORONTO
Upon Completion

SMARTCENTRES REAL ESTATE INVESTMENT TRUST
MARCH 2019 - INVESTOR PRESENTATION          55
TORONTO
DEVELOPMENT / INTENSIFICATION

PREMIUM OUTLETS
WITH SIMON PROPERTY GROUP

▪ Toronto Premium Outlets
    • 500,000 sf. when fully completed
    • Phase I opened Aug. 1, 2013
    • Phase II – new parking facility opened
      in Nov. 2017 as part of expansion and
      and Phase II opened in Nov. 2018
    • Stabilized yield in the double digits

▪ Premium Outlets Montreal                       MONTREAL
    • Phase I – 350,000 sf.
    • Opened Oct. 30, 2014
    • Additional 75 acres of potential
      development adjacent to the site to
      include retail, residential, hotel, etc.

▪ Actively sourcing two other locations in
  Canada

SMARTCENTRES REAL ESTATE INVESTMENT TRUST
MARCH 2019 - INVESTOR PRESENTATION                          56
DEVELOPMENT / INTENSIFICATION TORONTO PREMIUM OUTLETS 144,000 Square Foot Expansion SMARTCENTRES REAL ESTATE INVESTMENT TRUST MARCH 2019 - INVESTOR PRESENTATION 57
EXPANSION GRAND OPENING
                                                   NOV 15, 2018

SMARTCENTRES REAL ESTATE INVESTMENT TRUST
MARCH 2019 - INVESTOR PRESENTATION                                58
DEVELOPMENT / INTENSIFICATION LAVAL CENTRE MONTREAL ▪ Lands designated by City as “Centre-Ville”, due to highway and transit access ▪ 43 acre site anchored by a 160,000 square foot Walmart Supercentre ▪ Parcels of land sold to others for seniors housing, hotel and office development of 400,000 sf. ▪ JV for 290,000 sf. of rental residential in 338 units with Jadco ▪ Remaining 15 acres to be developed with up to 2 million sf. of mixed-use SMARTCENTRES REAL ESTATE INVESTMENT TRUST MARCH 2019 - INVESTOR PRESENTATION 59
DEVELOPMENT / INTENSIFICATION

LAVAL CENTRE
MONTREAL
Original Plan

SMARTCENTRES REAL ESTATE INVESTMENT TRUST
MARCH 2019 - INVESTOR PRESENTATION          60
DEVELOPMENT / INTENSIFICATION

LAVAL CENTRE
MONTREAL
With Jadco – 338 Apartment Units

SMARTCENTRES REAL ESTATE INVESTMENT TRUST
MARCH 2019 - INVESTOR PRESENTATION          61
DEVELOPMENT / INTENSIFICATION

LAVAL CENTRE
MONTREAL
Current Plan

SMARTCENTRES REAL ESTATE INVESTMENT TRUST
MARCH 2019 - INVESTOR PRESENTATION          62
DEVELOPMENT / INTENSIFICATION

POINTE-CLAIRE
MONTREAL
▪ Walmart and Home Depot anchored site in West Montreal purchased in
  2016
▪ Very well-located site – transit (new light rail transit line to downtown) and
  road access
▪ Master planning activities moving forward with strong support from council
▪ Secured zoning for a multitude of uses including residential, seniors housing
  and office – 1 to 1½ million sf. on the perimeter of the property
▪ First rental apartment building expected to be completed in 2022
▪ Significant NAV accretion potential from entitlements achieved to date

SMARTCENTRES REAL ESTATE INVESTMENT TRUST
MARCH 2019 - INVESTOR PRESENTATION                                                 63
DEVELOPMENT / INTENSIFICATION

POINTE-CLAIRE
MONTREAL
                                            FUTURE REM STATION

Existing conditions

             ST-JEAN BOUL

                          HYMUS BOUL

SMARTCENTRES REAL ESTATE INVESTMENT TRUST
MARCH 2019 - INVESTOR PRESENTATION                               64
DEVELOPMENT / INTENSIFICATION
POINTE-CLAIRE
MONTREAL
Perspective from St. Jean Blvd. and
Hymus Blvd.
ST-JEAN BOUL
HYMUS BOUL
SMARTCENTRES REAL ESTATE INVESTMENT TRUST
MARCH 2019 - INVESTOR PRESENTATION 65DEVELOPMENT / INTENSIFICATION
CHILLIWACK MALL
Aerial – Existing Conditions
Sto:Lo
First Nation ALR Lands
Residential
Rental
Residential KNIGHT ROAD Residential
Condo Rental
Kekinow Native Housing Society
Chilliwack Mall
VEDDER ROAD
LUCKAKUCK WAY
Cottonwood Mall
(Morguard)
SMARTCENTRES REAL ESTATE INVESTMENT TRUST
MARCH 2019 - INVESTOR PRESENTATION 66DEVELOPMENT / INTENSIFICATION WESTSIDE MALL TORONTO ▪ Urban redevelopment site. Currently a 140,000 square foot shopping centre ▪ New Light Rapid Transit (LRT) station as part of Eglinton Cross Town system to open on site ▪ New links to existing GO network will link new East:West to existing North:South transit framework ▪ Received council support for rezoning up to 2.5 million sf. ▪ Long-term project to add principally new residential development, with select retail SMARTCENTRES REAL ESTATE INVESTMENT TRUST MARCH 2019 - INVESTOR PRESENTATION 67
DEVELOPMENT / INTENSIFICATION

    WESTSIDE MALL
    TORONTO
    Architect’s Rendering

EGLINTON AVE

                 LRT STATION

    SMARTCENTRES REAL ESTATE INVESTMENT TRUST
    MARCH 2019 - INVESTOR PRESENTATION          68
DEVELOPMENT / INTENSIFICATION STUDIOCENTRE TORONTO ▪ StudioCentre is a brownfield location next to Toronto’s eastern waterfront. A former industrial site, today it is a well- utilized film production centre ▪ SmartCentres and Penguin Properties intend to revitalize the centre, adding new film production, office, and retail opportunities ▪ Rezoning has created the opportunity to build up to 1.2 million sf. of office, retail and film studios at the centre ▪ New music studio opened in 2018 SMARTCENTRES REAL ESTATE INVESTMENT TRUST MARCH 2019 - INVESTOR PRESENTATION 69
KEY FINANCIAL HIGHLIGHTS

BALANCE SHEET SUPPORTS EXTENSIVE
ASSET GROWTH
▪ Unencumbered pool at $4.3 billion = flexibility

▪ Ready access to mortgage and unsecured debt capital when needed =
  strong liquidity

▪ Payout ratio to ACFO at 83.0% as of December 31, 2018

▪ Current interest rates still lower than maturing rates despite recent Bank of
  Canada rate hikes, which help to improve FFO

SMARTCENTRES REAL ESTATE INVESTMENT TRUST
MARCH 2019 - INVESTOR PRESENTATION                                                70
KEY FINANCIAL HIGHLIGHTS

DEBT MATURITY / LEVERAGE

DEBT MATURITY
(in millions of $)
                     400
                                                                            371
    314                                       300
                                       275
                                                                                             250       250
                           202                            200
                                                    180
                                 150                                              160
               140
                                                                119
                                                                      100               87
                                                                                                                           45
                                                                                                                3

     2019       2020        2021            2022     2023        2024        2025       2026        2027        2028 THEREAFTER

                                                            Secured Debt          Debentures

▪    Interest costs on refinancing available with 10 year unsecured rates around 5% and secured rates below that
▪    Interest Coverage: 3.3X                                                   (Target: 2.5X – 3.0X)
▪    Debt to EBITDA: 8.2X                                                      (Target: 8.0X – 8.5X)
▪    Unencumbered pool: $4.3 billion (2.1X unsecured coverage)                 (Target: 1.5X unsecured coverage)
▪    Debt to GBV: 51.1%                                                        (Target: 50% - 60% long-term trend to continue to de-lever)
▪    Debt to Aggregate Assets: 43.9%
▪    Weighted Avg Interest Rate (Secured Debt): 3.93%
▪    Weighted Avg Term to Maturity (Secured Debt): 4.4 yrs
▪    DBRS rating of BBB with a Stable trend

SMARTCENTRES REAL ESTATE INVESTMENT TRUST
MARCH 2019 - INVESTOR PRESENTATION                                                                                                           71
KEY FINANCIAL HIGHLIGHTS
LEVERAGE PROFILE
Dec. 31 Dec. 31 Dec. 31 Dec. 31
2018 2017 2016 2015
Debt to Aggregate Assets 43.9%(1) 45.4%(2) 44.3% 44.7%
Secured Debt to Aggregate Assets 23.1% 26.1% 29.5% 31.2%
Unencumbered Assets $4.3B $3.4B $2.7B $2.5B
Debt to Adjusted EBITDA 8.2X(1) 8.4X 8.4X 8.4X
Interest Coverage 3.3X(1) 3.1X 3.1X 3.0X
Liquidity: Cash Resources $399M $646M $355M $345M
Weighted Average Interest Rate(3) 3.93% 3.87% 3.79% 3.87%
Weighted Average Term to Maturity(3) 4.4 yrs 4.6 yrs 4.8 yrs 5.4 yrs
(1) Including the recent $230 million equity issuance that occurred subsequent to year-end in January 2019, Debt to Aggregate Assets at
41.5%, Debt to Adjusted EBITDA at 8.0X, and Interest Coverage at 3.5X
(2) Leverage increased during 2017 in support of the OneREIT acquisition
(3) Secured Debt
SMARTCENTRES REAL ESTATE INVESTMENT TRUST
MARCH 2019 - INVESTOR PRESENTATION 72KEY FINANCIAL HIGHLIGHTS
CONSERVATIVE CAPITAL
STRUCTURE
Secured Mortgage Financing
Amount - $2.1 billion
$9.8 Billion
21.4% Weighted Avg Interest Rate – 3.93% Total Enterprise Value
Weighted Avg Term to Maturity – 4.4 years
Unsecured Debentures Focused on:
Amount - $1.8 billion
18.5% Weighted Avg Interest Rate – 3.53%
Weighted Avg Term to Maturity – 4.8 years ▪ Lowering interest
rates on renewals
Debt on Equity Accounted
Investments
1.3% Amount - $126 million
▪ Maintaining maximum
Weighted Avg Interest Rate – 3.76% flexibility
Weighted Avg Term to Maturity – 14.9 years
Operating Lines / Bank Loans / ▪ Reducing leverage
Outstanding LC’s over time
2.7% Operating Line – $121 million
Bank Loan – $80 million
Letters of Credit – $62 million ▪ Rebalancing unsecured
and secured debt ratios
Equity
Units Outstanding – 162 million
56.1% Share Price – $33.70 as at February 27, 2019
Market Capitalization – $5.5 billion
SMARTCENTRES REAL ESTATE INVESTMENT TRUST
MARCH 2019 - INVESTOR PRESENTATION 73KEY FINANCIAL HIGHLIGHTS
STABLE CASH FLOW
PAYOUT 83.1% 81.8% 81.2%
RATIO TO
ACFO
2013 2014 2015 2016 2017 Q3 2018
($ per unit)
FFO 1.85 1.95 2.10 2.17* 2.20 2.28
ACFO NP NP NP 2.00* 2.10 2.16
Distributions 1.55 1.56 1.61 1.66 1.71 1.76
* Excludes $0.06 per unit of non-recurring income
▪ Distributions fully funded from operating cashflow
▪ Annual distribution increases announced in each of 2014, 2015, 2016, 2017, and 2018 of
$0.05 per unit. Current annual distribution per unit is $1.80
SMARTCENTRES REAL ESTATE INVESTMENT TRUST
MARCH 2019 - INVESTOR PRESENTATION 74SUMMARY
THE BEST OFFENSE STARTS
WITH A STRONG DEFENSE
BEST-IN-CLASS STRONG PIPELINE
PORTFOLIO FINANCIAL OF NEW
Youngest retail portfolio POSITION DEVELOPMENT
amongst all Canadian Strong balance sheet OPPORTUNITIES
peers. 84% located in and strong credit metrics. GROWING EVERY
urban or near urban Growing unencumbered QUARTER
locations, with strong pool provides increased
national tenants as Extensive portfolio of
financial flexibility. growth opportunities
anchors Access to multiple from smaller local
sources of capital intensification to
Vaughan Metropolitan
Centre, Canada’s largest
mixed-use development
SMARTCENTRES REAL ESTATE INVESTMENT TRUST
MARCH 2019 - INVESTOR PRESENTATION 75You can also read