Investor Update HY2020 Presentation - Toyota ...
←
→
Page content transcription
If your browser does not render page correctly, please read the page content below
Investor Update
HY2020 Presentation

                      Toyota Camry
Investor Relations   Agenda

                              Page |   Topic

                              3    |   Disclaimer

                              6    |   The Global Toyota Group

                              15   |   Toyota in Australia

                              22   |   Toyota Finance Australia

                              35   |   Investment Highlights

                                                             Toyota RAV4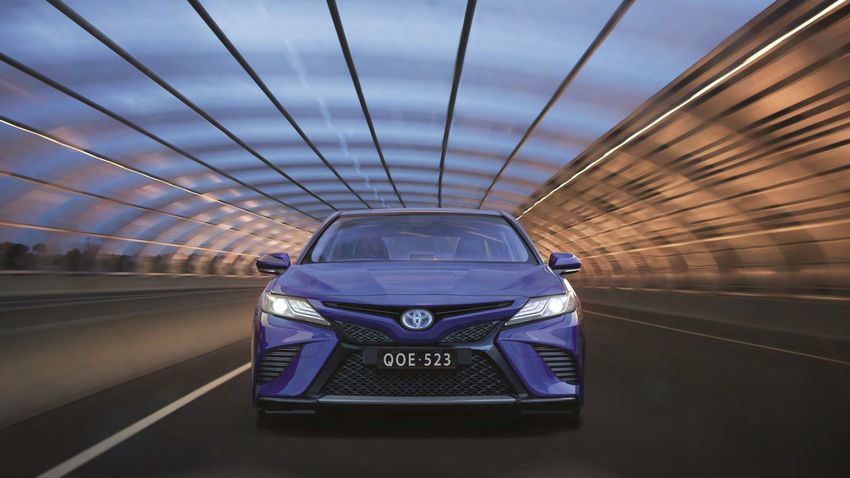
Disclaimer

The information in this presentation is an overview of certain information relating to Toyota Motor Corporation and its subsidiaries (including Toyota Finance Australia Limited
(ABN 48 002 435 181) (“TFA”) and Toyota Motor Corporation Australia Limited (“TMCA”)) (together, the “Toyota Companies”). It has been prepared, and is authorised, by TFA and
TMCA. TFA is expressly not responsible for information in this presentation relating to TMCA.

This presentation is being provided solely for your information, and may not be distributed to any other person, and may not be reproduced in any form, in whole or in part. Failure
to comply with this restriction may constitute a violation of applicable securities laws. No reliance may be placed for any purposes whatsoever on the information contained in this
presentation or any other material discussed verbally or on its completeness, accuracy or fairness. No representation or warranty, expressed or implied, is given by, or on behalf of,
the Toyota Companies or any of the Toyota Companies’ directors, officers or employees or any other person as to the accuracy or completeness of the information or opinions
contained in this document and no liability whatsoever by the Toyota Companies or any of the Toyota Companies’ directors, officers or employees or any other person for any loss
howsoever arising, directly or indirectly, from any use of such information or opinions or otherwise arising in connection therewith. The information in this presentation is subject
to verification, completion and change.

This presentation is not a prospectus or offering document and does not constitute or form part of and should not be construed as, an offer to sell or issue or the invitation or
solicitation of an offer to buy or acquire securities or other financial products of any of the Toyota Companies (including TFA) in any jurisdiction or an inducement to enter into
investment activity in any jurisdiction. Neither this presentation nor any part thereof, nor the fact of its distribution, shall form the basis of, or be relied on in connection with, any
contract or commitment or investment decision whatsoever. Investors and prospective investors in the securities or other financial products of any of the Toyota Companies
(including TFA) are required to make their own independent investigation and appraisal of the business and financial condition of the Toyota Companies and the nature of the
securities and other financial products. This presentation does not constitute a recommendation regarding securities or other financial products of any of the Toyota Companies
(including TFA). Any prospective purchaser of securities or other financial products of any of the Toyota Companies (including TFA) is recommended to seek its own independent
financial advice.

The distribution and use of this presentation may be restricted by law in certain jurisdictions and is not provided to any person in any jurisdiction where it is unlawful to do so.
Recipients of this presentation should inform themselves about them and observe any such restrictions. TFA does not represent that this presentation may be lawfully distributed
in compliance with any applicable registration or other requirements in any such jurisdiction where action for that purpose is required, or under an exemption available in that
jurisdiction, nor does it assume any responsibility for facilitating any such distribution. In particular, no action has been taken by TFA or any other person which would permit
distribution of this presentation in any jurisdiction where action for that purpose is required.

                                                                                                                                                                                              3
Disclaimer

This presentation is intended for distribution only to financial institutions and professional investors only in circumstances where disclosure is not required under Part 6D.2 or 7.9
of the Corporations Act 2001 of Australia (the “Corporations Act”), and otherwise only as may be permitted by applicable law. The information must not, and is not intended to be,
given to any “retail client” within the meaning of section 761G of the Corporations Act. The information in this presentation is a summary only and is not complete. It does not
amount to an express or implied recommendation or a statement of opinion (or a report or either of those things) with respect to any investment in any of the Toyota Companies
nor does it constitute financial product advice.

No action has been made or will be taken that would permit a public offering of any securities described herein. This presentation and its contents are directed only at and may only
be communicated to (a) persons in member states of the European Economic Area who are “qualified investors” within the meaning of Article 2(e) of the Prospectus Regulation
(EU) 2017/1129; and (b) in the United Kingdom to such “qualified investors” who are (i) persons who have professional experience in matters relating to investments falling within
Article 19(5) of the Financial Services and Markets Act 2000 (Financial Promotion) Order 2005 (the “Order”), or (ii) high net worth entities and other persons to whom it may
lawfully be communicated, falling within Article 49(2)(a) to (d) of the Order, or (iii) other persons to whom it may otherwise lawfully be communicated (all such persons in (a)
through (b) are collectively referred to as “Relevant Persons”). Any person who acquires securities in any offer or to whom any offer of any securities is made will be deemed to have
represented and agreed that it is a Relevant Person. By receiving or accessing this presentation you acknowledge that you will be solely responsible for your own assessment of the
market and the market position of the Toyota Companies and that you will conduct your own analysis and be solely responsible for forming your own opinion of the potential future
performance of the Toyota Companies’ business and in all cases are capable of being categorised as a professional client or eligible counterparty, each as defined in Directive
2014/65/EU (as amended, “MiFID II) (such persons also being referred to as “Relevant Persons”). This presentation must not be acted or relied on by persons who are not Relevant
Persons.

This presentation is an advertisement and not a prospectus and investors should not subscribe for or purchase any securities of TFA issued under its Euro Medium Term Note
Programme referred to in this presentation or otherwise, except on the basis of information in the Euro Medium Term Note Programme base prospectus of Toyota Motor Finance
(Netherlands) B.V., Toyota Credit Canada Inc., Toyota Finance Australia Limited and Toyota Motor Credit Corporation dated 13 September 2019, as supplemented from time to time
(together, the “Prospectus”), together with the applicable final terms which are or will be, as applicable, available on the website of the London Stock Exchange plc at
www.londonstockexchange.com/exchange/news/market-news/marketnews-home.html. Investors should read the Prospectus before making an investment decision in order to
fully understand the potential risks and rewards associated with the decision to invest in Notes issued under the Euro Medium Term Note Programme. Approval of the Prospectus
by the Central Bank of Ireland should not be understood as an endorsement of Notes issued under the Euro Medium Term Note Programme.

Neither this presentation nor any copy of it, nor the information contained herein, in whole or in part, may be taken or transmitted into, or distributed, directly or indirectly to the
United States or to any U.S person (as defined under Regulation S under the U.S. Securities Act of 1933, as amended (“the Securities Act”). Any failure to comply with this
restriction may constitute a violation of U.S. securities laws. This presentation does not constitute, and should not be construed as, an offer to sell or the solicitation of an offer to
buy securities in the United States as defined in Regulation S under the Securities Act or to any U.S. person. No securities of TFA have been, or will be, registered under the
Securities Act or the securities laws of any state of the United States.

                                                                                                                                                                                             4
Disclaimer

Matters discussed in this presentation may constitute forward-looking statements. Forward-looking statements are statements other than in respect of historical facts. The words
“believe”, “expect”, “anticipate”, “intends”, “estimate”, “will”, “may”, "continue”, “should” and similar expressions identify forward-looking statements. Forward-looking
statements include statements regarding: objectives, goals, strategies, outlook and growth prospects; future plans, events or performance and potential for future growth; liquidity,
capital resources and capital expenditures; economic outlook and industry trends; developments of the Toyota Companies’ markets; the impact of regulatory initiatives; and the
strength of the Toyota Companies’ competitors. The forward-looking statements in this presentation are based upon various assumptions, many of which are based, in turn, upon
further assumptions, including without limitation, management’s examination of historical operating trends, data contained in the Toyota Companies’ records and other data
available from third parties. Although TFA believes that these assumptions were reasonable when made, these assumptions are inherently subject to significant known and
unknown risks, uncertainties, contingencies and other important factors which are difficult or impossible to predict and are beyond its control. Such risks, uncertainties,
contingencies and other important factors could cause the actual results, performance or achievements of the Toyota Companies or industry results to differ materially from those
results expressed or implied in this presentation by such forward-looking statements.

The information, opinions and forward-looking statements contained in this presentation speak only as at the date of this presentation, and are subject to change without notice.
The Toyota Companies and their agents, employees or advisers do not intend to, and expressly disclaim any duty, undertaking or obligation to, make or disseminate any supplement,
amendment, update or revision to any of the information, opinions or forward-looking statements contained in this presentation to reflect any change in events, conditions or
circumstances. By attending any presentation to which this document relates or by accessing this presentation you will be taken to have represented, warranted and undertaken
that (a) you are a Relevant Person (as defined above), and (b) you have read and agree to comply with the contents of this notice.

This presentation includes references to credit ratings and, accordingly, this presentation should not be distributed to or accessed by any persons who are not able to receive such
information in accordance with applicable law. Credit ratings provided by third-party credit rating agencies may not reflect all risks of an investment in securities or other financial
products and may be subject to revision or withdrawal at any time.

                                                                                                                                                                                           5
The Global Toyota Group

                          Toyota CH-R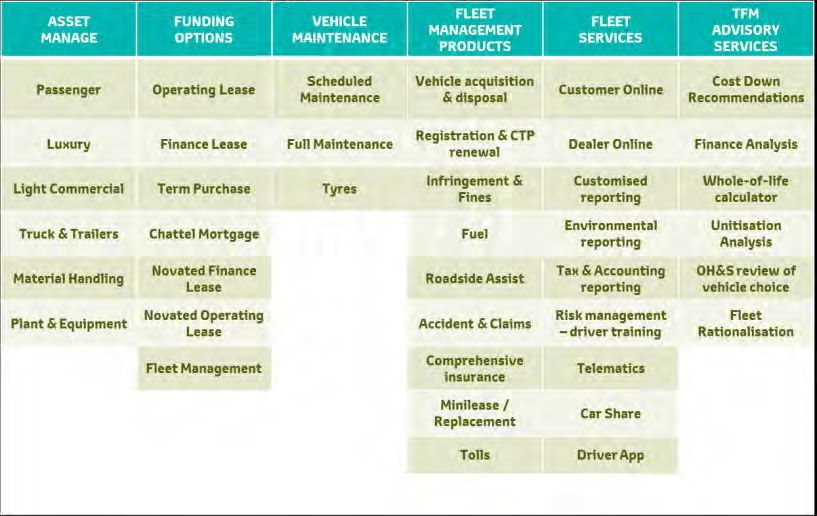
Toyota Motor Corporation                                                                Vision and group structure

                                                                                                 Toyota Global Vision
| Toyota will lead the way to the future of mobility, enriching lives around the world with the safest and most responsible ways of moving people.

| Through our commitment to quality, constant innovation and respect for the planet, we aim to exceed expectation and be rewarded with a smile.

| We will meet challenging goals by engaging the talent and passion of people, who believe there is always a better way.

                                                                                                  Toyota sells its vehicles in approximately
                                                                                                        190 countries and regions.

Source: https://global.toyota/pages/global_toyota/ir/library/sec/20-F_201903_final.pdf
http://www.toyota-global.com/pages/contents/investors/ir_library/sec/pdf/20-F_201803_final.pdf
https://global.toyota/en/company/profile/other-toyota-businesses/
TFAL investor update FY2019, pg 7
                                                                                                                                                     7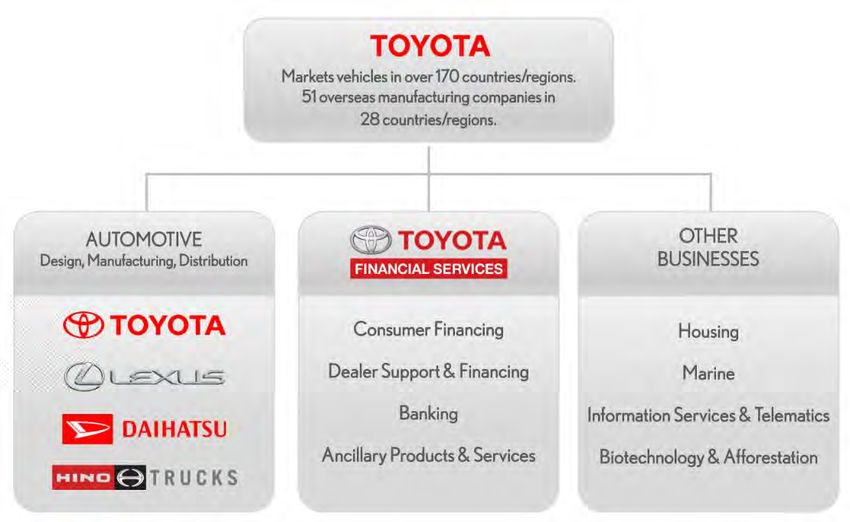
Toyota Motor Corporation                                                                                              Toyota at a glance

Ι   Operating for over 80 years and a global leader in mobility.

Ι   Consolidated vehicle sales exceeded 8.9 million units in FY2019.

Ι   Continued expansion in vehicle manufacturing capabilities.                                                                                                                                                         370,870                     8,985,186                      8,976,795
                                                                                                                                                                                                                 (Consolidated, as of
                                                                                                                                                                                                                   March 31, 2019)             (Consolidated, FY2019)          (Consolidated, FY2019)

Ι   Global manufacturing presence and extensive sales network.

                       Toyota Group Companies

                                                                                                          Consolidated Vehicle Sales                                                          Net revenues

                                                                                                                10,000              9,116   8,972           8,971   8,964   8,977                             35,000
                                                                                                                                                    8,681
                                                                                                                                                                                                                                                                             29,379.5 30,225.60
                                                                                                                                                                                                                                                   28,403.1
                                                                                                                           8,000                                                                              30,000                    27,234.5                  27,597.1
                                                                                                                                                                                                                            25,691.9
                                                                                                      Thousands of units
                                                                                                                                                                                                              25,000
                                                                                                                           6,000

                                                                                                                                                                                            Billions of yen
                                                                                                                                                                                    4,639                     20,000
                                                                                                                                                                                                                                                                                                        15,285.50
                                                                                                                           4,000                                                                              15,000

                                                                                                                                                                                                              10,000
                                                                                                                           2,000
                                                                                                                                                                                                               5,000

Sources: https://global.toyota/pages/global_toyota/ir/financial-results/2020_2q_presentation_en.pdf                           -                                                                                    0
https://global.toyota/en/sustainability/report/er/                                                                                 FY2014 FY2015 FY2016 FY2017 FY2018 FY2019 HY2020                                        FY2014 FY2015 FY2016 FY2017 FY2018 FY2019 HY2020
TFAL investor relations presentation 2019, pg. 8
Note: Numbers displayed may not add due to rounding.

                                                                                                                                                                                                                                                                                                               8
Toyota Motor Corporation                                     Sustainability

                                        Global Sustainability

            Ι         Toyota set six environmental challenges with the aim of going
                      beyond zero environmental impact and hoping to achieve a net
                      positive impact by 2050.

            Ι         One of Toyota’s goals is to reduce new vehicle CO2 emissions by 90%
                      by 2050, in comparison with 2010 levels.

            Ι         Globally Toyota has delivered more than 13 million electrified
                      vehicles.

            Ι         Toyota has reduced water usage by 23% within TMC vehicle plants in
                      FY19 compared to FY02 by reusing wastewater used in the painting
                      processes.

            Ι         Since launching the first- generation Prius in 1997, Toyota has built
                      its own recovery network to collect End of life HEV batteries for
                      recycling and reuse. As at March 2019 a total of 132,000 End of life
                      batteries had been collected.

Sources: https://global.toyota/en/sustainability/report/er/
Note: Numbers displayed may not add due to rounding.
                                                                                              9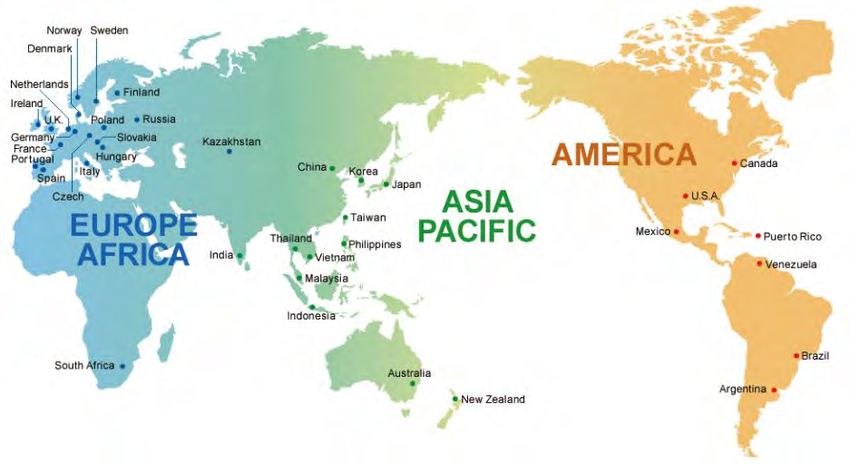
Toyota Motor Corporation                                                                              Financial Highlights

                           Net Revenues                                                                              Operating Income                                                                 Net Income
                        ¥ 29,379.5          ¥ 30,225.6
   ¥ 27,597.1                                                                                                           ¥ 2,399.8           ¥ 2,467.5                                              ¥ 2,493.9

                                                                                                   ¥ 1,994.3
                                                                                                                                                                                      ¥ 1,831.1                ¥ 1,882.8

                                                                  ¥ 15,285.5                                                                                     ¥ 1,404.3
                                                                                                                                                                                                                             ¥ 1,274.9

    FY2017               FY2018               FY2019              HY2020                           FY2017               FY2018               FY2019              HY2020               FY2017       FY2018      FY2019         HY2020

                    Total Liquid Assets                     (1)                                                   Capital Expenditures                                                            R&D Expenditures
   ¥ 9,199.5            ¥ 9,372.1            ¥ 9,454.4            ¥ 9,452.0                                                                 ¥ 1,465.8                                              ¥ 1,064.2
                                                                                                                                                                                      ¥ 1,037.5                ¥ 1,048.8
                                                                                                                        ¥ 1,302.7
                                                                                                   ¥ 1,211.8

                                                                                                                                                                  ¥ 626.5

                                                                                                                                                                                                                              ¥ 584.4

    FY2017               FY2018              FY2019               HY2020                           FY2017               FY2018               FY2019              HY2020               FY2017       FY2018      FY2019         HY2020
(1)    Cash and cash equivalents, time deposits, marketable debt securities and its investment in monetary trust funds, excluding in each case those relating to financial services
Sources: TMC FY2017 Financial Results; TMC FY2018 Financial Results; TMC FY2019 Financial Results, TMC FY2020 2Q Financial Results
                                                                                                                                                                                                                           ¥ in billions
https://www.toyota-global.com/pages/contents/investors/financial_result/2017/pdf/q4/summary.pdf
https://www.toyota-global.com/pages/contents/investors/financial_result/2018/pdf/q4/summary.pdf
https://global.toyota/pages/global_toyota/ir/financial-results/2019_4q_presentation_en.pdf
https://global.toyota/pages/global_toyota/ir/financial-results/2020_2q_presentation_en.pdf
Note: Numbers displayed may not add due to rounding.                                                                                                                                                                                    10
Toyota Financial Services Global presence
Europe/Africa Asia/Pacific Americas
Germany Czech Republic Australia Vietnam United States of America (U.S.A)
United Kingdom (U.K.) Denmark New Zealand India Puerto Rico
Finland Hungary Thailand Japan Canada
Italy Spain Malaysia Brazil
Norway Slovakia Philippines Venezuela
France Russia Taiwan Mexico
Sweden Kazakhstan China Argentina
Poland Portugal Korea
South Africa Netherlands Indonesia
Ireland
Source: http://www.tfsc.jp/overseas/index.html
11Toyota Financial Services Select entities
TMC
Toyota Motor Corporation
TFSC
Toyota Financial Services
Corporation
TFSIC TCCI TMFNL TFA
Toyota Financial Services Toyota Motor Finance Toyota Finance Australia
International Corporation Toyota Credit Canada Inc.
Netherlands B.V. Limited
TMCC
Toyota Motor Credit
Corporation
Ι TMCC, TCCI, TMFNL and TFA are named issuers under the €50,000,000,000 Euro Medium Term Note Programme.
Ι TMCC, TMFNL and TFA are named issuers under the A$10,000,000,000 Debt Issuance Programme.
12Toyota Financial Services Credit Support Agreements
Ι Securities* issued by TFA (and various other TFSC subsidiaries) have the benefit of a
TMC credit support agreement with TFSC.
Ι TFSC will continue to own 100% of TFA.
Ι TFSC will cause TFA to maintain a tangible net worth of at least A$150,000 as long as
Credit Support covered securities are outstanding.
Agreement
Ι If TFA determines it will be unable to meet its payment obligations on any covered securities,
TFSC will make sufficient funds available to TFA to ensure that all payment obligations are
paid as due.
TFSC Ι Agreement cannot be terminated until (1) repayment of all outstanding covered securities or
(2) each rating agency requested by Toyota to provide a rating has confirmed no change in
rating of all such securities.
Ι TFSC in turn has the benefit of a credit support agreement with TMC.
Credit Support
Agreement Ι Same key features as TFSC/TFA credit support agreement.
Ι TMC will cause TFSC to maintain a tangible net worth of at least JPY 10 million as long as
covered securities are outstanding.
TFA
Source: TFAL investor relations presentation 2019, pg.12
* “Securities” defined as outstanding bonds, debentures, notes and other investment securities and commercial paper, but does not include asset-backed securities issued by TFA’s securitisation trusts. 13Toyota Financial Services Credit ratings
Standard & Poor’s Moody’s
Long Term Short Term Long Term Short Term
Toyota Motor Corporation
AA- A-1+ Aa3 P-1
Toyota Finance Australia Limited
AA- A-1+ Aa3 P-1
Outlook Stable Stable
Source: Bloomberg Credit Rating Profile as at 18 November 2019
TFAL Investor update 2019, pg 13
14Toyota in Australia
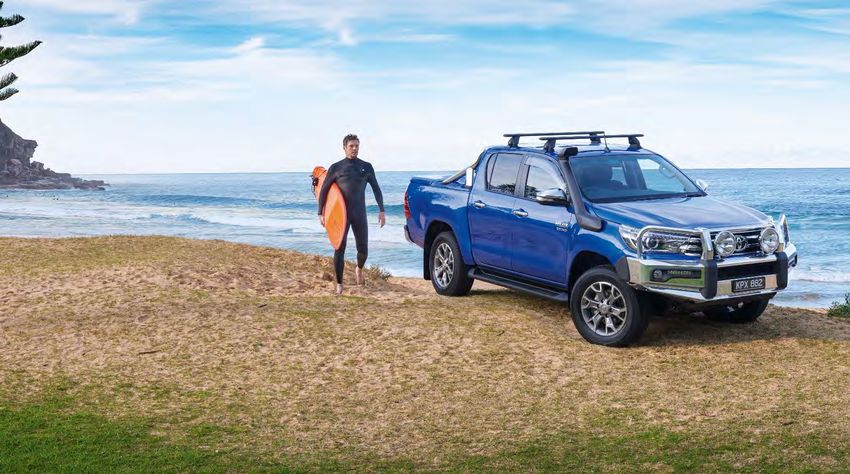
Toyota Hilux
15Toyota in Australia Value chain
Toyota Motor Corporation Australia Limited (“TMCA”)
Ι Sales , marketing & distribution
Ι Product planning & development
Ι Guest experience centre
ONE
Toyota Finance Australia Limited (“TFA”)
Ι Retail and wholesale finance & insurance
TOYOTA Ι
Ι
Fleet management
Guest experience
Toyota Dealer Network
Ι New and certified pre-owned vehicle sales
Ι Servicing & repairs
Ι Guest experience
Source: TFAL investor update FY2019, pg 15
16Toyota Motor Corporation Australia Australian market trend
Ι Australian vehicle market has shown solid long-term performance, with total new vehicle sales for CY2018 at 1,153
thousand.
Ι CY2019 is showing tough market conditions in the sector, Toyota is well positioned and maintains the largest market
share.
1,400,000
1,155K 1,178K 1,189K 1,153K
1,200,000 1,112K 1,136K 1,113K
New Vehicle Sales (units)
1,008K
1,000,000
800,000
775K
739K
600,000
692K
640K
624K
582K
577K
570K
566K
559K
535K
531K
516K
400,000
486K
450K
449K
378K
200,000
270K
-
2011 2012 2013 2014 2015 2016 2017 2018 2019 (Oct YTD)
Passenger Commercial
Source: Actual data based on VFACTS Industry Reports to October 2019 published by Federal Chamber of Automotive Industries
Note: Numbers displayed may not add due to rounding.
17Toyota Motor Corporation Australia Toyota’s market leadership
Market Share – 2019 October YTD
Ι Toyota remains the market leader in an industry demonstrating long term growth. Toyota (20.1%)
Mazda (9.6%)
20.1%
Ι 2019 will mark 17 years in a row as Australia’s top selling automotive brand and Hyundai (8.3%) 21.1%
the 15th year of vehicle sales above 200,000. Holden (4.2%)
Ford (6%)
4.1%
Ι 2019 Toyota has seen a market share consistently above 19.2%, double that of Mitsubishi
3.8%
9.6%
(7.8%)
our nearest competitor. Volkswagen
5.8%
(4.7%) 8.3%
Nissan (4.7%)
4.7%
4.2%
Kia (5.8%) 4.7%
7.8% 6.0%
Australian Vehicle Sales
350 25%
20.1%
300
20%
Units Sold ('000)
250
Market Share
200 15%
226
225
225
222
221
219
215
211
188
150
180
10%
100
133
126
118
116
115
114
112
111
106
5%
104
103
103
102
102
101
100
97
97
95
94
94
92
91
90
90
88
87
87
85
85
50
81
80
80
78
74
70
69
61
37
53
- 0%
2010 2011 2012 2013 2014 2015 2016 2017 2018 2019 (YTD)
Toyota* Mazda Hyundai Holden Ford Toyota* Market Share
Toyota includes Toyota and Lexus marques
Source: VFACTS Industry Reports to October 2019 published by Federal Chamber of Automotive Industries, TFAL investor update FY19,
https://www.goauto.com.au/news/toyota/toyota-on-track-for-211-000-sales-in-tough-market/2019-05-10/78673.html
Note: Numbers displayed may not add due to rounding. 18Toyota Motor Corporation Australia Overview
Toyota Australia Future Direction Toyota Australia
Toyota ranks in the top 5 most reputable companies in Australia for the last ten years
Ι In 2019 Toyota Australia continues its transformation from an automotive
company into a mobility company. 1 1
2 2
3 3
4 4 4 4
Ι Delving into areas such as alternative fuels or drivetrains, carshare services,
autonomous driving trials and connected vehicles, to ultimately contribute to 2010 2011 2012 2013 2014 2015 2016 2017 2018 2019
a zero-carbon society.
Product Innovation
Ι To achieve this future direction, Toyota are currently focused on the following
activities:
Ι Influence of product design and development to suit the Australian Ι Hybrid vehicles
market. Ι Electric vehicles
Ι Petrol and diesel vehicles
Ι Sourcing of fun-to-drive and innovative vehicles with
Ι Automated vehicles
environmentally focused drivetrains.
Ι Cooperative intelligent transport systems
Ι Study of new innovative usership (carshare / rideshare) and Ι Fuel cell vehicles
ownership solutions.
Ι Establishment of Toyota Australia’s Centre of Excellence at the
former manufacturing plant in Altona, Victoria.
Ι Toyota Community Trust (TCT) distribution of funds to not-for-
profit organisations encouraging young Australians to pursue further
studies within Science, Technology, Engineering and Mathematics
(STEM).
Source: Toyota Sustainability Report and Reputation Institute
Note: Numbers displayed may not add due to rounding.
19Toyota Motor Corporation Australia Vehicles in the spotlight
Toyota Hilux Toyota Rav4 Hybrid
Ι Top selling vehicle in Australia in Ι 60% of RAV4s sold are hybrid variants*.
2016, 2017 and 2018. Ι RAV4 hybrids offer fuel consumption of
Ι Hilux is the only commercial vehicle 4.7 (2WD) & 4.8L (Electric AWD) per
to have secured the #1 spot. 100km.
Ι Australia’s best-selling 4WD Ι First Toyota hybrid SUV for the Australian
vehicle for 12 consecutive years. market.
Toyota Corolla Toyota Corolla Hybrid
Ι Australia’s best-selling passenger Ι Corolla hybrid has become the most popular
car in 2018. hybrid vehicle in Australia in 2019 (as at April 30,2019).
Ι Top selling vehicle in Australia Ι Demand for Hybrid Corolla seen across
from 2013 – 2015. numerous industry sectors.
Ι 2020 Corolla Hatch available in Ι Hybrid sales are driving strong market share
Australian showrooms from outcomes for corolla.
November 2019.
Toyota Camry Toyota Camry Hybrid
Ι Australia’s best-selling mid-size Ι Over the long term hybrid Camry accounts
car for 25 consecutive years. for more than half of all Toyota hybrids sold
Ι 2018 Segment share of 53.1% in Australia.
Ι Camry redesigned under the Ι 45% of Camry sales this year are hybrid
Toyota New Global Architecture Ι Camry first offered a hybrid variant in 2010.
platform.
Source: https://toyota.pressroom.com.au/press_release_detail.asp?clientID=2&prID=32260&navSectionID
https://www.toyota.com.au/news/toyota-surpasses-100k-hybrid-sales-in-australia
* As at 31 May, 2019 20Toyota Motor Corporation Australia Sustainability
Cumulative hybrid sales in Local Sustainability
Australia
100,213 Ι TMCA hit a significant milestone in April 2019 announcing the
Total as at 30 April 2019 sale of more than 100,000 Toyota fuel-efficient hybrid electric
Camry
Corolla vehicles. Hybrid sales are expected to account for 20% of TMCA
55006
10654 sales in CY 2020 with 8 hybrid models offered across the range.
Ι Around CY2025, every model in the Toyota and Lexus line-up
around the world will be available as either a dedicated
electrified model or have an electrified option. TMCA are
Prius Prius V committed to bring a suite of electrified vehicles to
20534 4599
complement its existing hybrid range.
Ι March 2019 plans were unveiled to build a Hydrogen
Experience Centre at the former manufacturing site in Altona.
Ι The Toyota Mirai is powered exclusively by hydrogen, only emits
Prius C
9420 water vapour, has a cruising range of approx. 550 kms and is
currently sold in Japan, the United States and Europe.
Ι TMCA has been working closely with the Australian Hydrogen
Council and local organisations since 2018 to trial the use of
the Toyota Mirai within Australia.
Source Sustainability Report 2019 & VFACTS Industry Reports published by Federal Chamber of Automotive Industries
https://www.toyota.com.au/sustainability 21Toyota Finance Australia Business overview
Products and Services Business Highlights
Ι Established in 1982, TFA is a leading provider of automotive
Retail Finance Fleet Management finance and insurance in Australia.
•Consumer Loans •Asset Finance Ι TFA is a captive financier with strong market share that continues
•Commercial Finance •Fleet Management to drive revenue and support vehicle sales.
•Guaranteed Future •Vehicle Maintenance
Value •Novated Leasing Ι Increase in Total Assets year on year to over A$21.16b.(1)
•Salary Packaging
Ι Pre-tax income averaging A$198m over the past 5 years.(2)
Ι On January 21st, 2019 it was announced that Australian Alliance
Automotive Finance Pty Limited, a wholly owned subsidiary of
Dealer Finance Insurance TFA, has entered into a strategic alliance with Mazda Australia Pty
Limited to provide financial services to Mazda dealers and
•Wholesale •Comprehensive customers.
•Real Estate •Extended Warranty
•Working Capital •Finance Protection Ι On July 12th, 2019, the first Mazda Finance contract was written
and the vehicle was collected on the same day.
•Revolving Credit Lines •Finance Gap
•Roadside Assistance
(1) Total Assets as per TFA Interim Financial Statements for the Half Year ended 30 September 2019
Source: TFA Half Year report 2020, https://www.toyota.com.au/insurance/car-insurance (2) Profit before income tax for the five year period from FY15through FY19; A$198m + $227m + $154m + $209m + $204 = $992m
Note: Numbers displayed may not add due to rounding.
22Toyota Finance Australia Toyota network in Australia
Sales Network
Ι 222 Dealers PMAs (199 Toyota and 23 Lexus).
Ι 329 Physical Dealership sites.
Ι TMCA HQ, Regional Offices and Toyota WA.
Toyota Finance Australia Coverage
Ι 5 Regional Offices.
Ι 99% of the Toyota network.
Ι 100% of the Lexus network.
Ι 100% of the Hino network.
| Toyota, your essential partner throughout Australia |
Source: https://www.toyota.com.au/the-company
All figures as at June 2019
23Toyota Finance Australia Asset composition
Segment Assets in AUD billions Retail Fleet Unallocated
(Net of Provisions)
21.16
20.36
18.51 2.09
1.87
16.81
15.62 1.75 3.47
15.45 3.19
1.77
2.71
2.10 1.77
2.42
2.34
2.51
15.30 15.60
14.06
12.61
10.84 11.51
2015 2016 2017 2018 2019 HY 2020
Retail segment is comprised of loans and leases to personal and commercial customers including wholesale finance consisting of loans and bailment facilities to motor vehicle dealerships.
Fleet segment is comprised of loans and leases to small business and fleet customers consisting of medium to large commercial clients and government bodies.
Source: TFA Annual Financial Reports, 2015, 2016, 2017, 2018, 2019, Interim Financial Statement 2020
Note: Numbers displayed may not add due to rounding.
24Toyota Finance Australia Retail segment
Products and Services Overview
Ι One of Australia’s leading vehicle financiers with 35+ years experience.
Consumer
Ι Fixed rate consumer loan Ι Leading finance provider for both Toyota and Non-Toyota(2) vehicles
Ι Toyota Access (GFV/Used GFV) and Franchises.
Ι Novated lease(1)
Ι Long standing partnership with the Australian Dealer Network.
Commercial Ι Focused on Guest experience and retention.
Ι Fixed rate loan
Ι Toyota Access (GFV/Used GFV)
Ι Lease products(1)
Toyota Access
Wholesale
Ι Real estate capital loans
Ι Bailment facilities and insurance
Ι Charge plan facilities
Ι Working capital
Insurance
Ι Motor vehicle insurance
Ι Extended warranty
Ι Finance protection
Ι Finance gap
Ι Roadside assistance
(1) Lease products (Novated Lease, Finance Lease) are administered through Toyota Fleet Management
(2) TFA’s Power Torque brand ,AAAF’s & Power Alliance Finance Mazda Finance brand was established for non-Toyota
Source: TFAL investor relations presentation 2019 Franchises in 2008 and 2019 respectively 25Toyota Finance Australia Fleet segment
Products and Services Overview
Ι Largest Fleet Management business of the Toyota Group.
Ι Australia’s only end-to-end fleet solution through One Toyota.
Ι Variety of distribution channels.
Ι Ongoing development of innovative mobility services.
Ι Diversified fleet customer portfolio across various industries.
Ι One of the top 2 largest fleet management companies in Australia.
Source: https://www.toyotafleetmanagement.com.au/
26Mazda Finance Mazda network in Australia
AAAF Overview
Seamless and personalised end to end car financing experience
that includes “Manufacturer Branded” financial products and
services.
Backed by the strength of Toyota Finance Australia Limited;
AAAF is the “White Label” solution that assists our strategic
alliance partners to not only provide the best experience for
their customers, but also to safeguard their dealer networks
against the risk of financial market downturns.
Power Alliance Finance (PAF)
Launched on October 21st, 2019 PAF is the new generic brand
that sits under AAAF to support Mazda Dealers who have multi
franchises.
Sales Network
Ι 55 Mazda Dealerships on boarded to date.
Ι Total National Mazda Dealership 142.
27Toyota Finance Australia Financial highlights
Financing & Similar Revenue Net Financing Revenue Net Profit after Tax
426 148
1,197 144
1,094 357
244 85
612
FY2018 FY2019 HY2020 FY2018 FY2019 HY2020 FY2018 FY2019 HY2020
Cash and Cash Equivalents Total Assets Total Impairment Loss
21,156
61
1,417
20,362
1,383
18,514 25
1,283
14
FY2018 FY2019 HY2020 FY2018 FY2019 HY2020 FY2018 FY2019 HY2020
Sources: TFA Annual Financial Reports 2018, 2019 and TFA Interim Financial Statement 2020
Note: Numbers displayed may not add due to rounding. AUD millions 28Toyota Finance Australia Asset quality
Ι Credit losses average A$52m over the past 5 years. Credit Performance
Total impairment loss Provision for impairment
250M
Ι Provision for impairment established on objective 204M
194M 190M
evidence. 200M
168M 164M 164M
Ι Credit Risk Committee is responsible for risk 150M
assessment, ongoing management, collection,
100M 87M
enforcement and write-off monies lent by the 61M
58M
company. 40M
50M 25M
14M
0M
2015 2016 2017 2018 2019 HY 2020
Arrears (61-90 days past due exposure) Arrears (over 90 days past due exposure)
Retail Fleet Retail Fleet
100M 100M 87M
80M 80M 12 71M 67M
63M 63M
58M 4
11 55M
60M 51M 49M 60M 51M 3
45M 45M 47M
21 4 12 7
5 2 2
40M 26M 11 40M 26 75
60 64 60
7 42 46 45 43 45 20M 46 48
20M 34
19 25
0M 0M
2013 2014 2015 2016 2017 2018 2019 2013 2014 2015 2016 2017 2018 2019
Arrears measured as amount past due exposure on loans and receivables which includes unimpaired and impaired amounts. Values displayed are in AUD millions and are as at March 31 for each respective financial year.
Source: TFA Annual Financial Reports 2013, 2014, 2015, 2016, 2017, 2018 and 2019, Interim Financial Statement 2020
Note: Numbers displayed may not add due to rounding. 29Toyota Finance Australia Credit decisioning & collections
Ι TFA has been a leader in automotive industry application scorecards since 2001.
Ι Use of scorecards ensure consistent underwriting produced in the Retail portfolio.
AML/CTF/PEPS/
Sanctions
Fraudcheck Behaviour Score
Existing Customers Comprehensive
Bureau Tools
Application
Requesting Finance
Credit Decision
New Customers
Fraud Score
Application Score
Ι Fleet and Dealer applications assessed by Underwriters with industry expertise.
Ι Automation of Collections Activities improves efficiency as well as reinforces compliance with guidelines and
regulations.
Ι Continuous optimisation strategies that enable loss mitigation include a risk based collection segmentation model
and Champion/Challenger testing.
30Toyota Finance Australia Funding overview
Overview (1) (2) FY 2019 Total Debt by product in A$m (1)
Ι Issuing into domestic and international capital markets. Domestic commercial paper 897
Euro commercial paper 1,944
Ι Diverse currency mix including: AUD, USD, EUR, GBP, NZD.
US commercial paper 1,489
Ι Range of tenors to match assets (1 month to 5+ years).
Euro medium term note 6,759
Ι Established presence in Uridashi markets.
Domestic medium term note 2,018
Ι Access to Private Securitisation programmes. Securitisation, Bank Loans &
5,085
Other
Frequent Issuer - Capital Markets Issuances (2)
A$275m A$300m HK$340m A$22m A$/NZ$/US$ A$/NZ$/US$ EUR$650m EUR$500m
3yr DMTN 5yr DMTN 3yr EMTN 5yr DMTN 4yr Uridashi 4yr Uridashi 2yr EMTN 5yr EMTN
Nov-18 Nov-18 Dec-18 Dec-18 Jan-19 Mar-19 Apr-19 Apr-19
A$/NZ$/US$ Ongoing Ongoing
4.5yr Uridashi ABS CP
Oct-19
issuance issuance
2018
Source(1): TFA Annual financial report year ending 31 March 2019
Source(2): Bloomberg
Note: Numbers displayed may not add due to rounding.
31Toyota Finance Australia Liquidity
Master Credit Facility (US$15 billion) | Resilient
Ι Access to US$5 billion 364 day syndicated bank credit facility.
Ι Access to US$5 billion 3 year syndicated bank credit facility.
Ι Access to US$5 billion 5 year syndicated bank credit facility.
| Strong
Money Market Facilities
(1)
Ι A$1.34 billion in uncommitted and committed money market facilities.
| Stable
Commercial Paper
Ι A-1+ / P-1 rated domestic, euro and US commercial paper
programmes.
Securitisation
(1)
Ι A$1.1 billion of available liquidity from private securitisation programmes.
Cash and Cash Equivalents
(2)
Ι A$1.4 billion in short-term liquidity and investments.
Debt Capital Markets & Intercompany Lending
Ι Access to various domestic and international capital markets
Ι Credit Support Agreements from TMC- TFSC- TFA
Source: TFA Annual Financial Report 2019
(1) Amount not utilised as at March 31, 2019
(2) Cash and cash equivalents as at September 30, 2019
Note: Numbers displayed may not add due to rounding. 32Toyota Finance Australia Funding strategy
Diverse, cost effective and sustainable funding
P-1 | A-1+ . Global Issuer Private ABS
Commercial Paper Programmes Euro and Australian Dollar Readily Salable
Euro, Australian Dollar and USD Medium Term Note Programmes Retail Receivables
USD
NZD HKD
Private Placements EUR
GBP AUD
Receptive and responsive to reverse enquiry Multi-currency Issuance Capacity Intercompany Lending Infrastructure
Committed and Uncommitted Bank Credit Facilities
Investor focused
Long-Term Approach Best-in-Class Execution
Responsive Transparent
Source: TFA Interim Financial Statements for the Half Year ended 30 September 2019
33Toyota Finance Australia Funding strengths
Ι Diverse, sustainable and cost-effective funding programme. | Diverse
Ι Issuing into strong demand with attractive deals.
Ι Demonstrated capacity to securitise assets. | Sustainable
Ι Diversification across markets and currencies.
| Relationships
Ι Identifying & developing new markets and investor relationships.
Ι Responding quickly to opportunities with best-in-class execution.
Ι Strategic coordination amongst TFS Group Issuers.
Ι Long-term approach to maintaining strong business and stakeholder
relationships.
Ι Exceptional liquidity supported by strong balance sheet.
Ι Access to US$15b syndicated bank credit facility.
Ι Access to additional bilateral committed and money market facilities.
34Toyota Finance Australia Investment highlights
Strength of One Toyota
Ι Established business model and consistent market leader.
Ι Strategic coordination on a local and global scale.
Ι Continued financial strength and strong operating performance.
Ι Ongoing investment in technology, facilities and risk management.
Ι Part of a world class company and a global leader.
Ι Operates under the renowned ‘Toyota Way’ principles.
Our stakeholder management
Ι Focused on guest retention and customer satisfaction.
Ι Engaged workforce and experienced leadership team.
Ι Sustainable approach to our stakeholder relations be it our
business partners, our communities or our investors.
35Contact Email: Investorrelations@Toyota.com.au Website: www.toyota.com.au/finance
You can also read