Investor Update January 23, 2018 - United Continental Holdings

Page created by Jose Daniels
 
CONTINUE READING
Investor Update January 23, 2018 - United Continental Holdings
Investor Update
January 23, 2018
Investor Update January 23, 2018 - United Continental Holdings
Safe Harbor Statement

Certain statements included in this presentation are forward-looking and thus reflect our current expectations and beliefs with respect to certain current and
future events and anticipated financial and operating performance. Such forward-looking statements are and will be subject to many risks and uncertainties
relating to our operations and business environment that may cause actual results to differ materially from any future results expressed or implied in such
forward-looking statements. Words such as “expects,” “will,” “plans,” “anticipates,” “indicates,” “believes,” “forecast,” “guidance,” “outlook,” “goals” and
similar expressions are intended to identify forward-looking statements. Additionally, forward-looking statements include statements that do not relate solely to
historical facts, such as statements which identify uncertainties or trends, discuss the possible future effects of current known trends or uncertainties, or which
indicate that the future effects of known trends or uncertainties cannot be predicted, guaranteed or assured. All forward-looking statements in this presentation
are based upon information available to us on the date of this presentation. We undertake no obligation to publicly update or revise any forward-looking
statement, whether as a result of new information, future events, changed circumstances or otherwise, except as required by applicable law. Our actual results
could differ materially from these forward-looking statements due to numerous factors including, without limitation, the following: our ability to comply with the
terms of our various financing arrangements; the costs and availability of financing; our ability to maintain adequate liquidity; our ability to execute our
operational plans and revenue-generating initiatives, including optimizing our revenue; our ability to control our costs, including realizing benefits from our
resource optimization efforts, cost reduction initiatives and fleet replacement programs; costs associated with any modification or termination of our aircraft
orders; our ability to utilize our net operating losses; our ability to attract and retain customers; potential reputational or other impact from adverse events in
our operations; demand for transportation in the markets in which we operate; an outbreak of a disease that affects travel demand or travel behavior; demand
for travel and the impact that global economic and political conditions have on customer travel patterns; excessive taxation and the inability to offset future
taxable income; general economic conditions (including interest rates, foreign currency exchange rates, investment or credit market conditions, crude oil
prices, costs of aircraft fuel and energy refining capacity in relevant markets); economic and political instability and other risks of doing business globally; our
ability to cost-effectively hedge against increases in the price of aircraft fuel if we decide to do so; any potential realized or unrealized gains or losses related to
fuel or currency hedging programs; the effects of any hostilities, act of war or terrorist attack; the ability of other air carriers with whom we have alliances or
partnerships to provide the services contemplated by the respective arrangements with such carriers; the effects of any technology failures or cybersecurity
breaches; disruptions to our regional network; the costs and availability of aviation and other insurance; industry consolidation or changes in airline alliances;
the success of our investments in airlines in other parts of the world; competitive pressures on pricing and on demand; our capacity decisions and the capacity
decisions of our competitors; U.S. or foreign governmental legislation, regulation and other actions (including Open Skies agreements and environmental
regulations); the impact of regulatory, investigative and legal proceedings and legal compliance risks; the impact of any management changes; labor costs; our
ability to maintain satisfactory labor relations and the results of any collective bargaining agreement process with our union groups; any disruptions to
operations due to any potential actions by our labor groups; weather conditions; and other risks and uncertainties set forth under Part I, Item 1A., “Risk
Factors,” of our Annual Report on Form 10-K for the fiscal year ended December 31, 2016, as well as other risks and uncertainties set forth from time to time in
the reports we file with the U.S. Securities and Exchange Commission.

                                                                                                                                                                           1
Investor Update January 23, 2018 - United Continental Holdings
Oscar Munoz
Chief Executive Officer
Investor Update January 23, 2018 - United Continental Holdings
Agenda

 Fourth-quarter and full-year 2017 results

 2018 priorities

 United’s network and commercial strategy

 Financial update including full-year 2018 EPS and long-term EPS guidance

   - Greater accountability and transparency

                                                                             3
Investor Update January 23, 2018 - United Continental Holdings
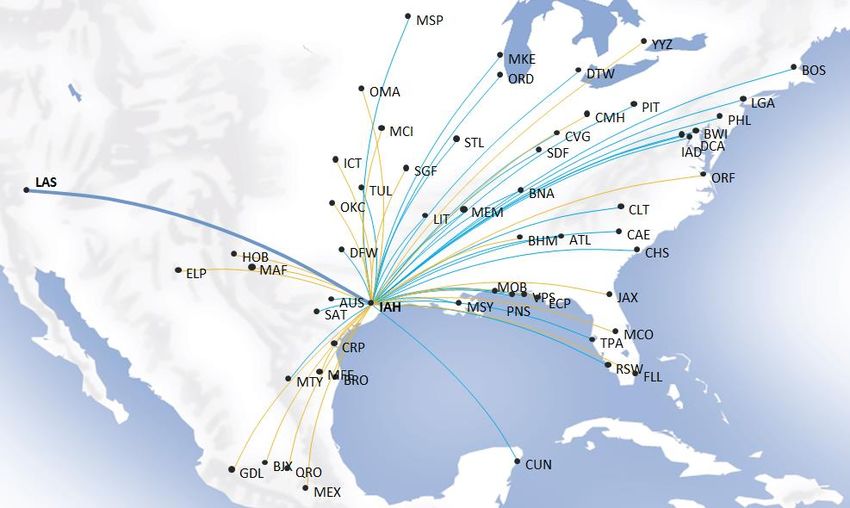
4Q17 pre-tax margin exceeded guidance due to revenue and cost improvements

                         Pre-tax margin1                     Revenue outperformed as close-in bookings
                                  (%)
                                                              firmed
                                                              – 4Q PRASM of 0.2% vs. initial guidance of (3.0%) –
                                                 6.7%
                                        6.4%                    (1.0%)

              3.0% - 5.0%                                    Positive momentum in all regions going into 2018

                                                             Better cost performance driven by improved
                                                              reliability
                                                              – CASM-ex1 increased 1.5% vs. original guidance of
                                 4Q17                           2.5% - 3.5%;
                       10/18/17 guidance                      – 4Q all-in CASM increased 4.0%
                       Including special charges
                       Excluding special charges

1   For a GAAP to non-GAAP reconciliation, see Appendix A

                                                                                                                    4
Investor Update January 23, 2018 - United Continental Holdings
Set strong foundation in 2017

                      Earnings per share, diluted1           Announced new $3B share repurchase
                                                              program
                                 $7.02      $6.76

                                                             Rebanked Houston and expanded hub
                                                              connectivity

                                                             Strong relative non-fuel CASM

                                                             Record breaking operational performance
                                       2017

                             Including special charges
                             Excluding special charges

1   For a GAAP to non-GAAP reconciliation, see Appendix A

                                                                                                        5
Investor Update January 23, 2018 - United Continental Holdings
2017 had the best operational performance in United history

                                                                               D:001
                                                                                              69.9%
                                                                               66.9%

                                                              60.3%

                                                              2015              2016          2017

                            Completion factor1                                                           A:001

                                                          98.0%                                          66.2%   66.7%
                                       97.9%

                    97.5%                                                                        58.8%

                    2015               2016                2017                                   2015   2016    2017

1Includes both mainline and regional operation
Note: History as defined by time since the merger of United and Continental in October 2010
                                                                                                                         6
Operational reliability, service and experience underpin customer strategy

          2013                             2014                            2015                         2016         2017

                                                                                                                            2

                                                                                                                       (4 of 8)
                                                                                                         (51 of 9)

                                                         2
                                                                              (7 of 9)

                                              (8 of 8)

             (9 of 9)

           Rankings based on on-time performance, cancellations, MBR, complaints and IDB
1Tied with JetBlue
2American Airlines and US Airways merged in 2014; Alaska and Virgin America merged in 2017
Note: MBR = Mishandled bag ratio, IDB = Involuntary denied boardings; Source: The Wall Street Journal
                                                                                                                                  7
2018 priorities – continued top-tier operational reliability is the foundation

    Strengthening our domestic network through growth

    Driving efficiency and productivity

    Continue investing in people, product and technology

                   Our strategy drives sustainably higher profits and margins

                                                                                 8
Scott Kirby
President
Network strategy – outlook

                   Our network has tremendous potential – capitalizing on our strengths and improving our hub
 Network is         quality
    our
                   Other commercial elements require a strong network to succeed
 foundation
                   Overall strategy returns United to profitable growth

                   Our international gateways are a structural advantage that we will continue to grow and enhance
Leverage our       Enhance and improve our alliances and JVs
 strengths
                   Geographic position of our hubs

                   Grow our domestic network to strengthen our mid-continent hubs
 “Uniquely
  United”      Greater scale at our hubs reinforces our relevance and value proposition to customers
opportunities  Continue to improve connectivity at our hubs

                                                                                                                      10
Network strength – strong international gateways

                                                   Local premium international demand by city
                                                                       (Daily passenger demand)
              6,000

              4,000                                                                                   UA's hubs account for ~80% of local
                                                                                                      premium international demand from
              2,000                                                                                               hub cities

                   0
                                LA

                                                                                                                                                                                      Salt Lake City
                                                                                                                          Phoenix
                                                                        Houston

                                                                                            Seattle
                                       SF

                                              DC

                                                                                                                Detroit

                                                                                                                                                            Minneapolis
                                                     Chicago

                                                                                  Atlanta

                                                                                                       Dallas
                                                               Miami

                                                                                                                                                                          Charlotte
                        NYC

                                                                                                                                    Denver

                                                                                                                                             Philadelphia
                       UA hubs in top 5 markets

                              United international gateways more profitable than competitors’
Note: Totals are daily each way; demand aggregated for cities with multiple airports (NYC includes Newark, JFK, and LaGuardia; LA includes Burbank, Long Beach,
Ontario, and Orange County; Miami includes Miami and Fort Lauderdale; SF includes Oakland, SFO, and San Jose; Chicago includes Midway and ORD; DC includes
DCA and IAD; Houston includes Hobby and IAH; and Dallas includes Love and DFW); Source: Adjusted MIDT TME 3Q 2017
                                                                                                                                                                                                       11
Network strength – membership in best alliance provides greatest reach

                                             28         191       18,400
                                           member     countries     daily
                                           airlines    served     departures

                                             20         177       16,609
                                           member     countries     daily
                                           airlines    served     departures

                                             15         157       13,199
                                           member     countries     daily
                                           airlines    served     departures

       Star Alliance is the largest with what we believe has the best connecting hub
                                  potential around the world
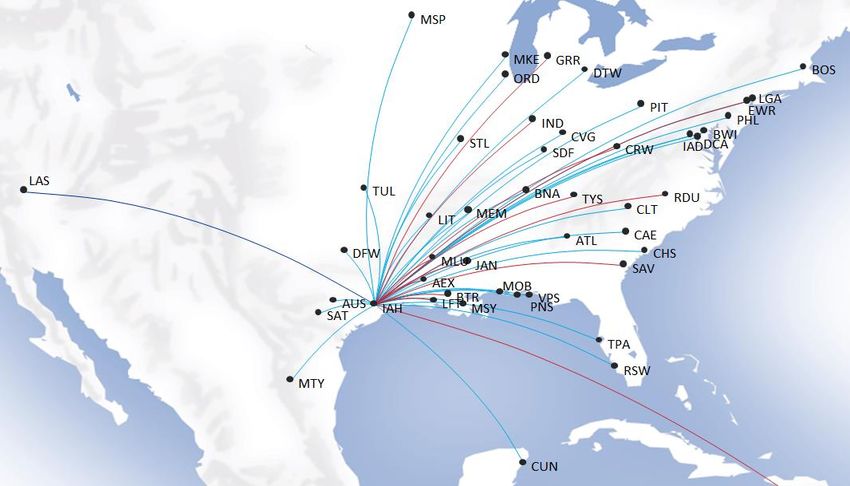
                                                                                       12
Each mid-continent hub has unique strengths

              ORD                                DEN                              IAH
 Connecting North-East, Midwest    Best hub for Mountain region    Southern tier transcontinental
  and West                          Transcontinental traffic         traffic
 3rd largest local market                                           Complemented by Latin
                                                                      America network

                            ORD, DEN and IAH all complement one another

                                                                                                       13
Opportunity – mid-continent hubs not yet fulfilling their potential

    Hub scale        UA domestic scale/share is low versus competitors

                     UA hubs have lower connectivity than peers
  Connectivity       Hub profitability directly correlated with hub connectivity and is the most
                      important element of a hub’s success

Revenue quality      UA shrank and became less exposed to high yield flow markets

 Asset efficiency    UA shrank without reducing fixed costs

                                                                                                    14
Hub scale – mid-continent hubs account for margin underperformance

             Hub type and margin breakdown                                                                      Mid-continent domestic hub quality3
                                                                                                          100
                             International        Mid-continent

                                                                                    Domestic seat share
                                                                                                           90
          Hub type             gateway1               flow2                                                80
                                                                                                                                        DL        AA
                                                                                                           70
                                                                                                           60
                                                                                                           50                                                  Legend
        Margin gap               ~7 pts               ~(10) pts                                                                    UA                            Local
                                                                                                           40
                                                                                                                                                                Pax/Day
                                                                                                           30
                                                                                                             30     40     50       60       70        80       90        100
                                                                                                                                        Flow %

 International gateway hubs outperform our competitors                            United mid-continent hubs have lower margins because
                                                                                    they lack scale, which is sub-optimal for:
                                                                                                                    Customers                     Customer loyalty
                                                                                                                     Revenue                 Credit card membership
                                                                                                                    Connectivity                       Profitability
1International
            Gateway defined as AA: JFK, MIA, LAX. DL: JFK, SEA, LAX. UA: EWR, IAD, SFO, LAX
2Mid-Continent Flow defined as AA: CLT, DFW. DL: ATL, DTW, MSP. UA: DEN, IAH, ORD.
Source: SEC filings, T100; Data FY 2016
3Source: Superset & OAG; Data FY 2016 Domestic only, includes MDW, DAL, and HOU in seat share and local pax/day volumes                                                         15
Hub scale – shrinking also invites competitive capacity growth in our hubs

               2011 – 2016 seat growth                                                            2011 – 2016 OA seat growth
                      (Legacy carriers)                                                                % in legacy hubs
                                               8%

                                                                                                   22%
                               3%

                                                                 Leads to higher                                   13%
                                                                 competitive growth                                                11%

              (8%)

Note: Seat growth % rounded to nearest whole number; United hubs: SFO, LAX, DEN, IAH, ORD, CLE, IAD, EWR; AA hubs: LAX, PHX, DFW, ORD, CLT, MIA, DCA, PHL, JFK;
DL hubs: SEA, LAX, SLC, MSP, CVG, DTW, ATL, JFK, LGA, BOS
Source: OAG 2011 - 2016 includes domestic 50 states
                                                                                                                                                           16
Hub scale – growth opportunities in mid-continent hubs are unique to United

                     Depth                                                   Breadth                                            Connectivity
            Hub departures to spoke                           Hub destinations served                                      Connecting itineraries (x1000)
(Weighted average of top mid-continent flow hubs) (Weighted average of top mid-continent flow hubs)                   (Average of top mid-continent flow hubs)

                         3.6           3.7                                        165           167                                                      34.0

                                                                    154                                                                    27.5
           2.8
                                                                                                                             21.4

           2.8                                                                                                              16.8
                                                                    148
                                                                                                                             16.8

                 Indicates expected progress at YE 2018

 Note: Top mid-continent flow hubs for UA: DEN, IAH, ORD; DL: ATL, DTW, MSP; AA: CLT, DFW. Depth and breadth are annual average weighted by flights, Connectivity is for a
 peak summer day
 Source: OAG
                                                                                                                                                                      17
Connectivity - rebanking drives significant connection opportunities

                                                          New spokes in bank
                         Pre rebank                       Connections moved to another bank
                                                                                                 Post rebank
                   (10 Directional banks)                 Unchanged connections             (8 Omni-directional banks)

Example: LAS 1st                                                                    LAS #1 accesses
   departure                                                                           10 net new
                                                                                   connections (+21%)

                                                                             Outcome: 21% more itineraries on 2% fewer aircraft movements

                                                        Hub             2018 vs. 2017 connectivity

                                                       IAH                         21%
                                                       ORD                         15%
                                                       DEN                         15%
Note: Based on Nov 2017 peak day vs. 2016; revenue data 12-month ending Nov 2017

                                                                                                                                        18
Revenue quality – we are less exposed to smaller, higher-yield markets

                                                                                               UA                         DL/AA
                                                                  2Q 2017                   passenger                   passenger
                               Market Size                       LOH yield1                composition                 composition

                                  Large                              8.7₵                        40%                         34%

                                Medium                              10.4₵                        34%                         35%

                                  Small                             13.6₵                        26%                         30%

1Length of haul (LOH) adjusted yield; normalized to 1,400 miles. Note: small markets are 6M industry passengers per year
Source: DOT Superset TME June 2017, Yield from United internal revenue management
                                                                                                                                                              19
Asset efficiency - United reduces capacity in off-peak, but costs remain the same

   Airline has same number of gates, aircraft and employees in all months

   United shrank in off peak months (RASM maximizing) without reducing fixed costs (CASM went up)

               Percent                                 United domestic seasonality1
           of peak month

           100%

                                                                                                        2010

             90%
11 pt reduction                                                                                         2017
 over 7 years
             80%

             70%
                Jan         Feb        Mar       Apr   May     Jun     Jul    Aug     Sep   Oct   Nov   Dec

   1   Diio Schedule Data; Domestic and Canada

                                                                                                               20
We will track progress along four dimensions

                                                                                                   Rank
                                                                               UA 2017   #1   #2          #3   #4

        Hub scale                Spokes: % of spokes where UA ranks #1 or #2     35%

      Connectivity               Flow traffic mix                                57%

    Revenue quality              Share of traffic in small markets               26%

                                 Schedule seasonality
    Asset efficiency             (January ASM / highest month)
                                                                                 77%

       Profitability             Pre-tax margin                                  7.9%
    (Domestic + International)   Pre-tax margin ex-specials1                     8.4%

1For a GAAP to non-GAAP reconciliation, see Appendix A
Source: OAG 2017, Superset 2017
Note: Domestic network
                                                                                                                    21
Overall, expect 2018 capacity growth of 4.0% - 6.0%

 Expected highest level of growth in domestic region in order to improve connectivity and regain relevance

 Anticipate similar growth rate in 2019 – 2020

                                          YOY consolidated ASM growth

                                                                    4.0% - 6.0%

                                          3.5%

                                          2017                         2018

                       Our strategy drives sustainably higher profits and margins

                                                                                                              22
Andrew Nocella
Executive Vice President and Chief Commercial Officer
Network is our starting point, surrounded by other commercial initiatives

                                Revenue management
                                    and pricing

                                   Network design
      Sales and distribution                              Products and services
                                    and alliances

                                     MileagePlus
                               and co-brand credit card

              A stronger network is good for customers and shareholders

                                                                                  24
UA System
Gemini expected     Q3 YOY Gross
                to contribute     RASM
                              70 bps     by YOYimprovement
                                     of PRASM   Capacity Growth
                                                            in 2018

                                                      Gemini vs. Orion test results1

                          Forecast bias                                    Yield                                         PRASM

                                                                                               +2.2%                                  +1.2%

                                                                   Orion            Gemini                       Orion       Gemini

                          Orion          Gemini

1Stage 1.1 Test ended on Nov 14th and included markets representing 10% of System revenue over a 10-week travel period
Note: Gemini is the new revenue management system, Orion is the current revenue management system
                                                                                                                                              25
Expanding segmentation initiatives

          United® Premium Plus                       Basic Economy

  Rollout begins in 2018                 Currently offered on the bottom 5 fare

  To be introduced on long-haul fleet     buckets

  3-year implementation                  In 2018, we plan to:

                                            - Implement more dynamic buy-ups

                                            - Sell seat assignments

                                            - Expand

                                                                                    26
YOY 2018
2018 PRASM        Gross PRASM
           – initiatives        atto
                         expected  +1.0%
                                     moderate the impact of high growth

                                                YOY 2018 PRASM drivers
                                                    (Contribution in % pts)

           Higher growth expected to drive                                       PRASM tailwinds
                a PRASM headwind

                                                                     Smaller gauge increases exposure to high
                    (0.5)
                                                                      yield/small markets

                                                                     Gemini revenue management
                                (0.5) – (1.0)
                                                                      enhancements

                                                                     IAH and ORD rebanking

    Expected     UA relative   OA competitive   Expected             Segmentation
 PRASM change     growth          growth      PRASM change
 at GDP growth

                                                                                                                 27
Andrew Levy
Executive Vice President and Chief Financial Officer
Improving profitability while growing the network

                                                                     Improve efficiency and productivity
                        Focus on CASM
                                                                     Provide long-term CASM-ex1 guidance

                      Accountable for                                Introduce 2018 EPS guidance
                      higher profitability                           Introduce 2020 EPS target

               A strong balance sheet is the foundation – maintaining $5B - $6B of liquidity

1Non-fuel CASM (operating expense per available seat mile) excludes fuel, profit sharing, third-party business expenses and special charges, the nature
and amount of which are not determinable at this time
                                                                                                                                                          29
Non-fuel CASM growth meaningfully lower in 2018 and beyond

              CASM and non-fuel CASM1                                                  Headwinds
                            H/(L) YOY
                                                             Increased regional flying ~0.5 point 2018 headwind
            CASM
                                                             Labor rate inflation
            Non-fuel CASM

                     3.1%
                                                             Airport costs
            2.8%
                                                             Technology investments
                                                                                           Tailwinds
                                                             Improved asset utilization

                                         (1.0%) - flat       Higher employee productivity

                                                             Aircraft lease to own

                                                             Increased operational efficiency given improved reliability
                 2017                    2018E

                                 Expect 2019 and 2020 non-fuel CASM to be flat or better
1   For a GAAP to non-GAAP reconciliation, see Appendix A
                                                                                                                            30
Productivity – labor, aircraft and ground assets

                       Productivity            Mainline aircraft utilization               Gate utilization
                            (ASMs/FTEs)            (Departures/aircraft per day)   (Average turns per gate on a peak day1)

                               +3%                              +2%                                  +7%

                       2017          2018E               2017         2018E                   2017         2018E

                               More effectively utilizing existing assets across the business

1   Peak Thursday in July

                                                                                                                             31
Capital expenditures in 2018 expected to be $3.6B - $3.8B

            Adjusted capital expenditures1
                                   ($B)
         GAAP                                                             24 scheduled aircraft deliveries in 2018
         Non-GAAP
                                      ~($1.0)
                            $4.7
                                                                          Opportunistic purchases of aircraft off-lease
              $4.0
                                                $3.6 - $3.8

                                                                          Continue to invest in product, technology and
                                                                             infrastructure

                                                                          2019/2020 capex expected to be higher than 2018,
                     2017                   2018E                            but below 2017

1   For a GAAP to non-GAAP reconciliation, see Appendix A; 2017 GAAP capital expenditures were $4.0B
                                                                                                                              32
Fleet plan provides flexibility in an economic downturn

                                                    Flexibility in mainline fleet
                                                         (Aircraft at year-end)

                                                                                                       Includes:
        Aircraft count

                                                                                               ~120    ~90 aircraft eligible to
                                                                                                       return to lessor

                         Base fleet plan   Fleet flexibility

               YE17                          YE18                           YE19                YE20

                                           Levers to manage fleet through 2020

                               Lease expirations                           Manage order book

                                                         Used aircraft

                                                                                                                                  33
2018 Guidance

                                                                                           FY2018

                                       Capacity                                    4.0% to 6.0%

                                 Non-fuel costs1                                   (1.0%) to flat

                                   EPS, diluted2                                   $6.50 to $8.50

                                          Capex                                   $3.6B to $3.8B

1 Excludes fuel, profit sharing, third-party business expense and special charges, the nature and amount of which are undeterminable at this time.
  For a GAAP to non-GAAP reconciliation, see Appendix A
2 Excludes special charges, the nature of which are not determinable at this time. Accordingly, the company is not providing earnings guidance on a GAAP basis.

  Note: EPS estimates based on book tax rate of ~22-24% and fuel forward curve as of January 18, 2018, with all-in fuel price of $2.11/gallon                     34
Reaching financial targets will guide our long term network strategy

                                                          Target earnings per share, diluted2

                                                                                                        $11.00 - $13.00

                                                 $6.50 - $8.50

                                                     2018E                                                   2020E

                                           Target ~25% CAGR1 EPS from 2018 through 2020
1Compound   annual growth rate
2Excludes special charges, the nature of which are not determinable at this time. Accordingly, the company is not providing earnings guidance on a GAAP basis

Note: 2018 EPS estimates based on fuel forward curve as of January 18, 2018, with all-in fuel price of $2.11/gallon for 2018 and includes share repurchase; 2020 EPS
estimate based January 18, 2018 forward curve, with all-in fuel price of $1.94/gallon for 2020 and includes share repurchase                                           35
Oscar Munoz
Chief Executive Officer
Closing

 Strengthening our hubs is a critical foundation to maximize profitability

 Driving revenue improvements from all areas of business

 Improving efficiency and productivity

 Greater accountability and transparency

  – Moving to annual guidance with 2018 EPS range

  – Providing multi-year network growth strategy, underpinned by commitments on long-term costs
     and 2020 EPS target

                  Our strategy drives sustainably higher profits and margins

                                                                                                  37
Appendix A: reconciliation of GAAP to Non-GAAP financial measures

UAL evaluates its financial performance utilizing various accounting principles generally accepted in the United States of America (GAAP) and Non-GAAP financial measures, including pre-tax
income and pre-tax margin excluding special charges, CASM as adjusted, net earnings (loss) per share excluding special charges, capital expenditures, as adjusted, among others. UAL believes
that adjusting for special charges is useful to investors because special charges are non-recurring charges not indicative of UAL’s ongoing performance. For additional information related to
special charges, see the press release issued by UAL dated January 23, 2018, filed on that date with the SEC as an exhibit to UAL’s Form 8-K.

                                                                                                     Three Months
                                                                                                        Ended             Year Ended
                             (in millions, except pre-tax margin)                                    December 31,        December 31,
                             Income before income taxes excluding special charges                        2017                2017
                             Income before income taxes                                                          $600            $2,999
                                Less: special charges and hedge adjustments before income taxes                    31               176
                             Income before income taxes excluding special charges and reflecting
                             hedge adjustments (Non-GAAP)                                                        $631            $3,175

                             Pre-tax margin excluding special charges
                             Total operating revenue                                                           $9,438           $37,736

                             Pre-tax margin                                                                      6.4%              7.9%
                             Pre-tax margin excluding special charges and reflecting hedge
                             adjustments (Non-GAAP)                                                              6.7%              8.4%

                                                                                                                                                                                                 39
Appendix A: reconciliation of GAAP to Non-GAAP financial measures (continued)

Cost per available seat mile (CASM) is a common metric used in the airline industry to measure an airline’s cost structure and efficiency. UAL reports CASM excluding profit sharing, third-party
business expenses, fuel, and special charges. UAL believes that adjusting for special charges is useful to investors because special charges are non-recurring charges not indicative of UAL’s
ongoing performance. UAL believes that excluding third-party business expenses, such as maintenance, ground handling and catering services for third parties, fuel sales and non-air mileage
redemptions, provides more meaningful disclosure because these expenses are not directly related to UAL’s core business. UAL also believes that excluding fuel costs from certain measures is
useful to investors because it provides an additional measure of management’s performance excluding the effects of a significant cost item over which management has limited influence. UAL
excludes profit sharing because this exclusion allows investors to better understand and analyze our recurring cost performance and provides a more meaningful comparison of our core operating
costs to the airline industry.
                                                                                      Three Months Ended      %                       Year Ended                %
                                                                                         December 31,     Increase/                  December 31            Increase/
   Non-Fuel CASM Consolidated (¢/ASM)                                                  2017       2016   (Decrease)                2017       2016         (Decrease)
   Cost per available seat mile (CASM)                                                 13.39      12.87       4.0                  13.05     12.70              2.8
         Less: Special charges (a)                                                     0.04      (0.05)      NM                    0.07       0.25             NM
         Less: Third-party business expenses                                           0.12       0.11        9.1                  0.10       0.10               -
         Less: Fuel expense                                                            2.88       2.49       15.7                  2.64       2.29             15.3
   CASM, excluding special charges, third-party business expenses and
   fuel (Non-GAAP)                                                                     10.35          10.32           0.3          10.24        10.06           1.8
         Less: Profit sharing per available seat mile                                  0.07           0.19          (63.2)         0.13          0.25         (48.0)
   CASM, excluding special charges, third-party business expenses, fuel,
   and profit sharing (Non-GAAP)                                                       10.28          10.13           1.5          10.11         9.81           3.1

   Consolidated Unit Cost (¢/ASM)                                                                                            FY 2017     Estimated FY 2018
   Consolidated CASM Excluding Special Charges (b)                                                                            12.98      13.15 -   13.37
      Less: Fuel (c), Profit Sharing and Third-Party Business Expense                                                          2.87       3.14 -    3.26
   Consolidated CASM Excluding Fuel, Profit Sharing, Third-Party Business Expense and Special Charges                         10.11      10.01 -   10.11

 (a) Excludes special charges, such as the impact of certain primarily non-cash impairment, severance and other similar accounting charges.
 (b) Excludes special charges. While the Company anticipates that it will record such special charges throughout the year in 2018, at this time the Company is unable to provide an estimate of these charges with reasonable
certainty.
 (c) Both the cost and availability of fuel are subject to many economic and political factors and are therefore beyond the Company’s control.
                                                                                                                                                                                                                                40
Appendix A: reconciliation of GAAP to Non-GAAP financial measures (continued)

UAL evaluates its financial performance utilizing various accounting principles generally accepted in the United States of America (GAAP) and Non-GAAP financial measures including net earnings
(loss) per share excluding special charges. UAL believes that adjusting for special charges is useful to investors because special charges are non-recurring charges not indicative of UAL’s
ongoing performance.

                                                                                                           Year Ended
                                                                                                          December 31,
                             Earnings per share, excluding special charges                                    2017
                             Diluted earnings per share                                                      $7.02
                                 Less: special charges and hedge adjustments                                  0.58
                                 Less: tax effect related to special charges and hedge adjustments           (0.84)
                             Diluted earnings per share, excluding special charges and reflecting hedge
                             adjustments (Non-GAAP)                                                          $6.76

                                                                                                                                                                                                   41
Appendix A: reconciliation of GAAP to Non-GAAP financial measures (continued)

UAL believes that adjusting capital expenditures for assets acquired through the issuance of debt and capital leases, airport construction financing and excluding fully reimbursable projects is
useful to investors in order to appropriately reflect the non-reimbursable funds spent on capital expenditures. UAL also believes that adjusting net cash provided by operating activities for
capital expenditures and adjusted capital expenditures is useful to allow investors to evaluate the company’s ability to generate cash that is available for debt service or general corporate
initiatives.

                                                                                                                                   Year Ended
                                                                                                                                    December
                                                                                                                                       31,
                             Capital Expenditures (in millions)                                                                      2017
                             Capital expenditures                                                                                 $    3,998
                                Property and equipment acquired through the issuance of debt and capital leases                          935
                                Airport construction financing                                                                             42
                                Fully reimbursable projects                                                                             (246)
                             Adjusted capital expenditures – Non-GAAP                                                             $    4,729

                                                                                                                                                                                                    42
You can also read