IRAP Star Rating and Investment Plan Implementation Support Guide - Amazon S3
←
→
Page content transcription
If your browser does not render page correctly, please read the page content below
iRAP Star Rating and Investment Plan
               Implementation Support Guide
                                                                                  March 2017

                                                                       Document description

                                                                                RAP-SR-4.1

PRINT WARNING – printed copies of this document or parts thereof should not
be relied upon as a current reference document.
Always refer to the electronic copy for the latest version at:
http://irap.org/en/about-irap-3/specifications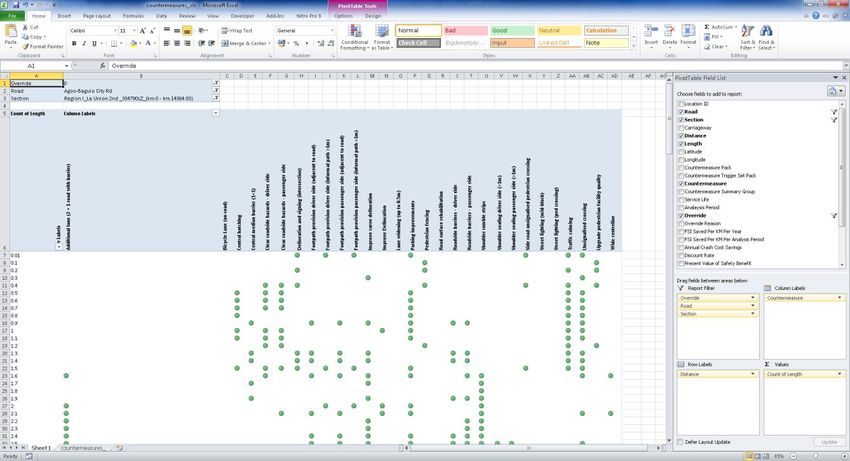
About iRAP
The International Road Assessment Programme (iRAP) is a registered charity dedicated to saving lives
through safer roads.
We provide tools and training to help countries make roads safe. Our activities include:
inspect high-risk roads and develop Star Ratings and Safer Roads Investment Plans
provide training, technology and support that will build and sustain national, regional and local
capability
track road safety performance so that funding agencies can assess the benefits of their investments.
The programme is the umbrella organisation for EuroRAP, AusRAP, usRAP, KiwiRAP and ChinaRAP. Road
Assessment Programmes (RAP) are now active in more than 80 countries throughout Europe, Asia Pacific,
North, Central and South America and Africa.
iRAP is financially supported by the FIA Foundation for the Automobile and Society and the Road Safety Fund.
Projects receive support from the Global Road Safety Facility, automobile associations, regional development
banks and donors.
National governments, automobile clubs and associations, charities, the motor industry and institutions such
as the European Commission also support RAPs in the developed world and encourage the transfer of
research and technology to iRAP. In addition, many individuals donate their time and expertise to support
iRAP.
For more information
For more information about this document, contact:
James Bradford
iRAP Global Operations Manager
james.bradford@irap.org
+44 1256 345 598 (GMT+0)
To find out more about the programme, visit www.irap.org. You can also subscribe to ‘WrapUp’, the iRAP e-newsletter,
by sending a message to icanhelp@irap.org.
Written by: Reviewed by: Approved by:
L.Rogers 27/07/2015 G.Smith 18/08/2015 J.Bradford, Aug.2015
Acknowledgements
iRAP would like to thank the following experts for their support, guidance and suggestions during the writing of this
document: Caroline Moore (EuroRAP), Alvin Poi (MIROS), Greg Miszkowycz (RACQ), Simon Harrison (TMR QLD), Gina
Waibl (KiwiRAP) and Emily McLean (RACV).
© International Road Assessment Programme (iRAP) 2015
iRAP technology including protocols, processes and brands may not be altered or used in any way without the express
written agreement of iRAP.
iRAP is registered in England & Wales under company number 05476000.
Registered Office: 60 Trafalgar Square, London, WC2N 5DS.
iRAP Star Rating and Investment Plan – Implementation Support Guide | 2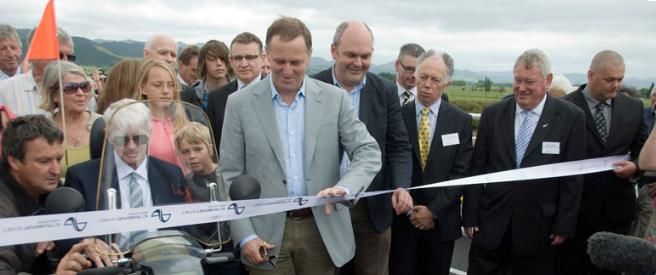
Version History
    Version                    Update
    July 2015                  Document created
    Nov. 2015                  Minor amendments after external review
    March 2017                 Appendix D added (guide to amending SRIPs in ViDA)

Contents
1      Introduction ................................................................................................................................................ 5
    1.1     About this document ............................................................................................................................. 5

    1.2     Star Ratings overview ........................................................................................................................... 6

    1.3     Safer Road Investment Plan overview ................................................................................................. 6

2      Securing funding for your project ............................................................................................................... 7
    2.1     The business case for safer roads ....................................................................................................... 7

    2.2     Setting policy targets ............................................................................................................................ 8

3      Understanding and using the iRAP results .............................................................................................. 10
    3.1     Star Rating maps and charts .............................................................................................................. 10

    3.2     Safer Road Investment Plans ............................................................................................................. 12

    3.3     Strip plans ........................................................................................................................................... 13

    3.4     Road survey data and detailed road attribute report .......................................................................... 14

    3.5     Download files .................................................................................................................................... 15

    3.6     Calculating the reduction in fatal and serious injuries ........................................................................ 16

4      How to prioritise road safety upgrades and investment plans ................................................................. 18
    4.1     Using the Core Data – Before download file to identify high risk locations ........................................ 18

    4.2     Using the Core Data – Before download file and the iRAP Star Rating Demonstrator to understand
    road user risk ............................................................................................................................................... 19

    4.3     Comparing Star Rating with Risk Mapping ......................................................................................... 22

    4.4     Identifying common severe crash types using the Fatality Estimations – Before download file ........ 24

    4.5     Identifying high risk sections (predicted casualty maps) .................................................................... 24

    4.6     Selecting appropriate countermeasure treatments ............................................................................ 25

    4.7     Exploring countermeasure options ..................................................................................................... 25

    4.8     Grouping countermeasures by works categories ............................................................................... 26

    4.9     Using Benefit Cost Ratios to prioritise investment options ................................................................. 27

                                                        iRAP Star Rating and Investment Plan – Implementation Support Guide | 3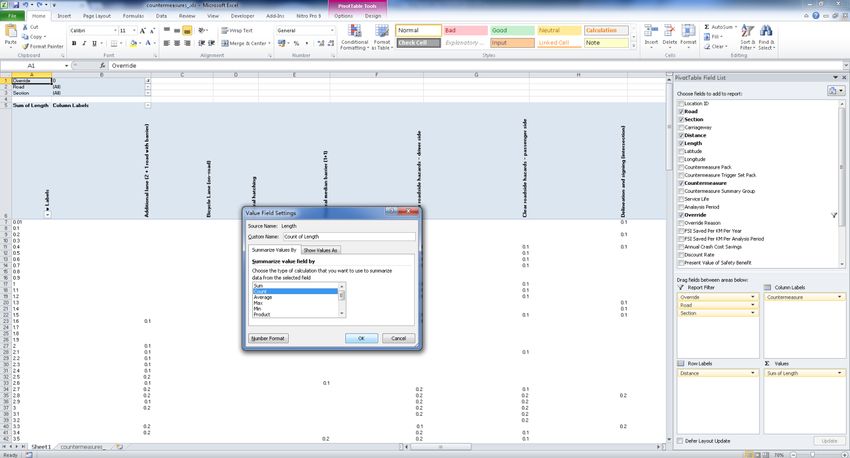
4.10       Route treatments ............................................................................................................................ 28

    4.11       Mass action treatments .................................................................................................................. 28

    4.12       Building safety into road maintenance budgets ............................................................................. 28

5     Designing safer roads .............................................................................................................................. 29
    5.1    Site visits - Safety ............................................................................................................................... 29

    5.2    Concept planning and preliminary design .......................................................................................... 30

    5.3    Detailed designs ................................................................................................................................. 31

    5.4    Countermeasures and the Road Safety Toolkit ................................................................................. 31

    5.5    Road Safety Audit ............................................................................................................................... 32

    5.6    Safety at Roadworks........................................................................................................................... 32

6     Star Rating designs .................................................................................................................................. 33
    6.1    A guide to Star Rating designs ........................................................................................................... 34

    6.2    iRAP Star Rating Demonstrator .......................................................................................................... 35

    6.3    Case study .......................................................................................................................................... 35

7     Monitoring and measuring the impact of your investment ....................................................................... 36
    7.1    Star rate and compare baseline and upgraded roads ........................................................................ 36

    7.2    Estimated FSI reduction ..................................................................................................................... 37

    7.3    Economic analysis .............................................................................................................................. 37

    7.4    Before and after studies ..................................................................................................................... 38

8     Communicating and celebrating success ................................................................................................ 38
    8.1    What to report, where and how .......................................................................................................... 38

    8.2    Raising community awareness ........................................................................................................... 39

    8.3    Good news stories, ribbon cutting 4 and 5 star roads ........................................................................ 39

Appendix A – Creating a strip plan using data from ViDA ............................................................................... 40
Appendix B – Star Rating Designs: creating an upload file using baseline data............................................. 44
Appendix C – Star Rating Designs: creating 100m GPS points using Google Earth ...................................... 46
Appendix D – How to adjust your Safer Road Investment Plans (SRIPs) in ViDA ......................................... 48

                                                      iRAP Star Rating and Investment Plan – Implementation Support Guide | 4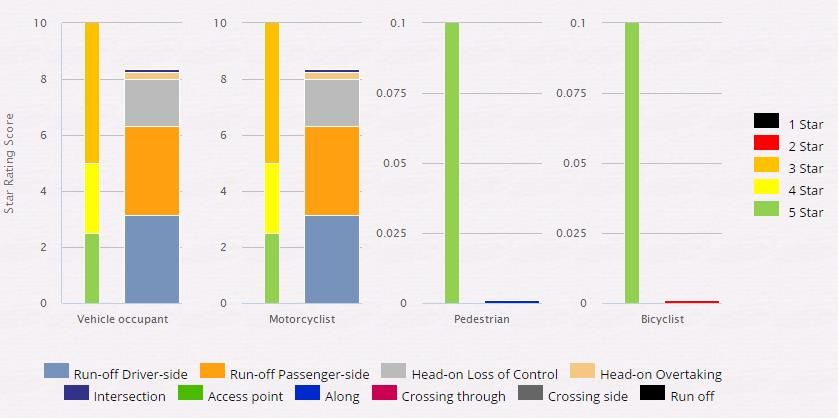
1 Introduction
Deaths and injuries from road vehicle crashes are a major and growing public health epidemic. Each year an
estimated 1.3 million people die and a further 50 million are injured or permanently disabled in road crashes.
Road crashes are now the leading cause of death for children and young people aged between 15 and 29.
The burden of road crashes is comparable with malaria and tuberculosis and costs 1-3% of the world’s GDP.

In low and middle income countries, road crashes represent a major health concern. More than 85% of the
global death toll and serious injuries occur in developing countries. Whereas road deaths are expected to fall
in high-income countries, they are set to increase in the rest of the world unless action is taken.

The International Road Assessment Programme (iRAP - www.irap.org) has drawn upon the extensive
knowledge base of the developed world’s Road Assessment Programmes (EuroRAP, AusRAP and usRAP),
with the generous support of the FIA Foundation, to develop a road survey methodology for low and middle
income countries. This Star Rating methodology does not require detailed crash data and works directly from
road surveys.

      1.1 About this document
The iRAP Star Rating and Investment Plan Implementation Support Guide provides help and guidance to road
authority engineers, design consultants and others using the iRAP Star Rating and Investment Plan results to
assess road user risk and improve the safety of road infrastructure for all users. This guidance document
builds on the experience of RAP users around the world and is designed to assist those using the iRAP results
to maximise the benefits of the road assessment outputs and shows users how to use the Star Rating Scores
to identify high risk locations and how to analyse and prioritise road safety countermeasure treatments for
inclusion in routine maintenance, local safety schemes, planned road upgrades and rehabilitation projects.
The document will assist users with the implementation phase shown on the right of the process diagram
below.

Figure 1        The iRAP Star Rating and Safer Roads Investment Plan process diagram

                                      iRAP Star Rating and Investment Plan – Implementation Support Guide | 5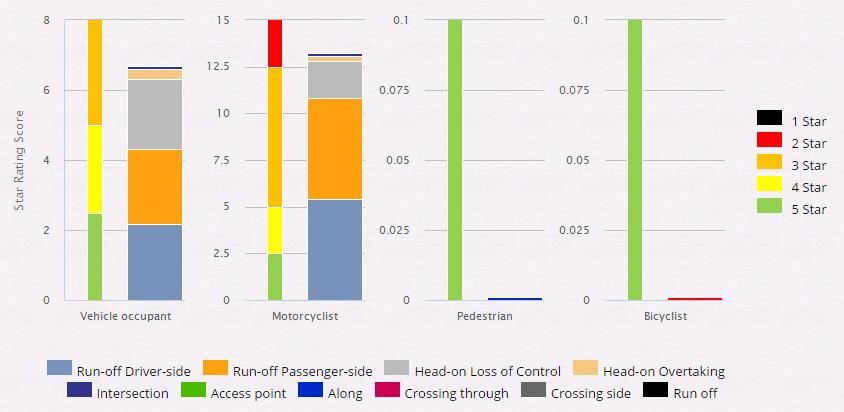
This Implementation Support Guide has primarily been developed in order to bridge the gap between a road
assessment being completed (with results published) and the design and construction phase, whether it be a
small scale road safety scheme, route treatment programme or major corridor upgrade. The document will
enable users to make best use of their data including instructions on conducting economic appraisals,
presenting results, step-by-step instructions on how to prioritise and create lists of recommended treatments
for further investigation and the importance of monitoring and evaluation.

It is designed to be a flexible document that will change and develop as new tools, reports and functionality
are added to the iRAP Star Ratings and Investment Plan protocols and associated software.

      1.2 Star Ratings overview
iRAP Star Ratings are an objective measure of the likelihood of a road crash occurring and its severity. The
focus is on identifying and recording the road attributes which influence the most common and severe types
of crash, based on scientific evidence-based research. In this way, the level of road user risk on a particular
road section or network can be defined without the need for detailed crash data, which is often the case in low
and middle income countries where data quality is poor. Research shows that a person’s risk of death or
serious injury is highest on a one-star (black) road and lowest on a five-star (green) road.

Star Ratings are also particularly useful in order to objectively quantify the level of risk associated with new
road designs (where crash data is not available) enabling evidence based decisions on road improvements
and also for use in high-performing countries where the relatively low frequency of crashes limits the ability of
crash analysis to influence performance monitoring and investment prioritisation. For further information on
iRAP Star Rating methodology and access to training courses visit http://capacity.irap.org/.

      1.3 Safer Road Investment Plan overview
iRAP considers more than 90 proven road safety countermeasure treatments to generate affordable and
economically sound Safer Road Investment Plans (SRIP) that will reduce road user risk, improve a road’s Star
Rating and will save lives. Road improvement options range from low cost road markings and pedestrian
refuges to higher cost intersection upgrades and full highway duplication.

The investment plans are developed in three key steps:

    1. Drawing on the Star Ratings, traffic volume data and crash data (if available), estimated numbers of
        deaths and serious injuries are distributed across the road network.

    2. For each 100 metre segment of road, countermeasure options are tested for their potential to reduce
        deaths and serious injuries. A series of triggers are used to select suitable countermeasure treatments
        at viable locations. For example, a section of road that has a poor pedestrian Star Rating and high
        pedestrian activity might be a candidate for a footpath or pedestrian crossing facility.

    3. Each countermeasure option is assessed against affordability and economic effectiveness criteria.
        The economic benefit of a countermeasure (measured in terms of the economic benefit of the deaths

                                      iRAP Star Rating and Investment Plan – Implementation Support Guide | 6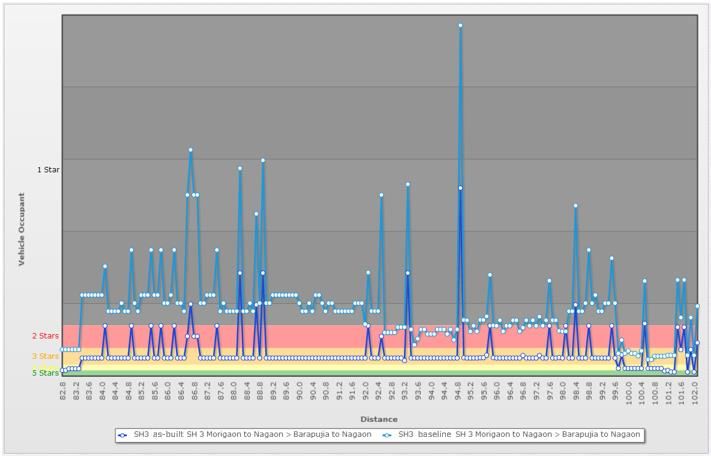
and serious injuries prevented) is compared to the cost of construction and maintenance over a set
           period to give a benefit to cost ratio (BCR) of each individual countermeasure plus a BCR for the
           overall SRIP. In many cases, the ‘threshold’ BCR for an investment plan is set at 1 which means that
           the benefit must at least equal the cost. The BCR setting can be lifted above one, which has the effect
           of making the plan more cost-effective and reducing the overall cost of the plan. This helps to ensure
           that the plan is affordable while representing a positive return on investment and the responsible use
           of public money.

Further information on countermeasure triggers, selection criteria, hierarchy rules and outcomes is provided
in   the    iRAP    Methodology    Fact   Sheet    #11   Countermeasures      at     http://irap.org/en/about-irap-
3/methodology?download=139:irap-methodology-fact-sheet-11-countermeasures.

2 Securing funding for your project
Simple, affordable improvements to road infrastructure have the power to dramatically reduce both the risk of
crashes occurring and their severity. By investing in life-saving features like sealed shoulders, footpaths, safety
barriers and traffic signals, high-risk roads can be made more forgiving – they can be made safe. iRAP’s
systematic approach helps to justify investment in safer roads.

Large-scale, targeted road infrastructure improvements make good financial sense. The iRAP results can help
to secure funding for road upgrades that will reduce the cost of crashes for the life of the countermeasures,
saving government spending further down the line. Proposed road safety upgrades that are often not cost-
effective when considered in isolation can often be justified as part of a network-wide mass action treatment.

       2.1 The business case for safer roads
Road crashes kill over 1 million people each and every year worldwide with an estimated 30-50 million
additional people injured annually. Road crashes impact the young and economically productive and impose
a significant burden on health, insurance and legal systems. The cost of road crashes globally is estimated at
more than US$2,000 billion a year. Investment does not match the scale of the problem. Road infrastructure
often has an unacceptable risk of head-on, run-off road, intersection and pedestrian deaths and injuries built
in to current designs. Proven and cost effective solutions exist for most crash outcomes and all that is missing
is the appropriate scale of response to the problem.

The gross underfunding of road infrastructure safety relates to the disconnection and incorrect apportionment
of funds between prevention and funding of consequences. That is the US$2,000 billion in annual road crash
costs are primarily borne by the health and welfare system, the legal system, the insurance sector, the
commercial and business sector and the families of those impacted. Without a whole of government / whole
of system response to solving this significant problem the scourge of road death and injury will remain for
future generations.

                                        iRAP Star Rating and Investment Plan – Implementation Support Guide | 7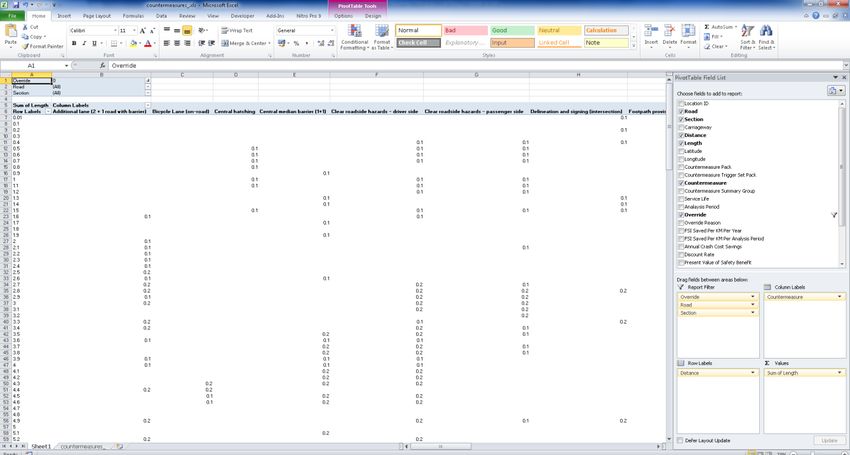
The preventative solutions for road death and injury are primarily in:
road infrastructure (e.g. significant lengths of our road network are 1- or 2-star where 5-star is the
safest and research shows that crash costs halve for each one star improvement in a road network)
policing and behaviour change (e.g. enforcement, education, technology improvements such as
alcohol interlocks)
vehicles (e.g. rapid modernisation of fleets to 5-star safety levels)
Road Assessment Programmes can help to provide the metrics which enable benefits to be captured and the
rightful, accelerated investment in safer road infrastructure to be delivered.
2.2 Setting policy targets
Funding for road safety improvements can be leveraged if policy targets are set. It is recommended that
Government agencies at regional or national level set policy targets to stabilise and then reduce the forecasted
level of road traffic fatalities in line with the recommendations discussed in the Global Plan for the Decade of
Action for Road Safety 2011-2020. Setting targets to improve Star Ratings can have a significant impact,
suggestions include:
Set a target to eliminate high risk (1- and 2-star) roads by the end of the Decade of Action for Road
Safety (2020).
Set minimum Star Ratings for all new road designs to ensure that no more ‘killer roads’ are built. For
example, adopt a policy that all new roads shall be built to a minimum 3-star standard for all road
users.
Conduct a road safety assessment (iRAP Star Rating and Investment Plans) on the highest risk or
highest volume (e.g. 10%) of roads in the region/country.
Star rating targets and risk mapping are being actively used by road agencies, development banks and auto-
clubs around the world. Some examples from high-income countries include:
The Dutch Government was the first to adopt a “no one or two star road by 2020” policy.
The Swedish Government measure the percentage of vehicle mileage on roads that meet EuroRAP four-
star standard. For further details see
http://ec.europa.eu/transport/road_safety/specialist/knowledge/dacota/pdf/safety_issues/policy_issues/0
8-safety_ratings_en.pdf
Highways England has adopted a target for 90% of travel to be on 3-star or better roads by 2020. This is
linked to broader goals for 4 and 5-star motorways.
The New Zealand Government has a target for 4-star Roads of National Significance (RONS) and recently
adopted a review of design standards that ensure Roads of National Significance will be implemented with
a minimum 4-star rating, see http://www.saferjourneys.govt.nz/action-plans/safe-roads-and-roadsides/.
iRAP Star Rating and Investment Plan – Implementation Support Guide | 8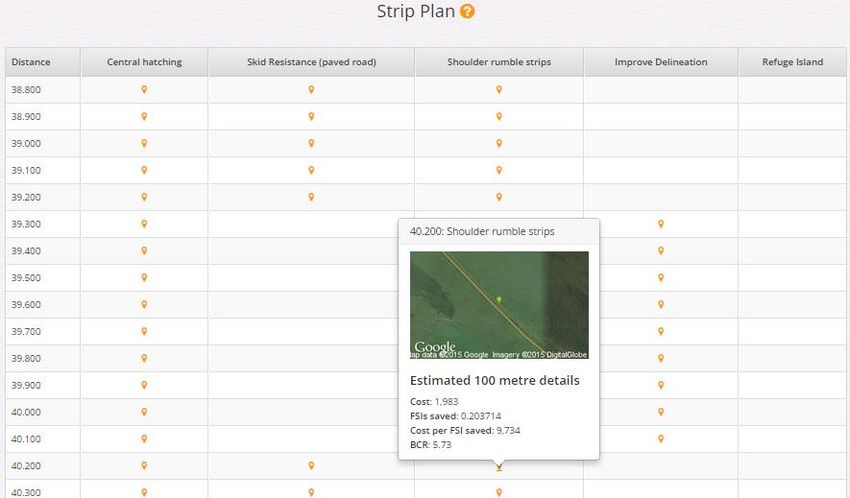
Performance tracking using risk mapping is active across Europe (EuroRAP), the US (usRAP) and New
Zealand (KiwiRAP), with AusRAP releasing a new performance tracking report in 2016. Example reports
include the 2014 UK results and the 2012 New Zealand results.
Benchmarking of the European road system was undertaken as part of the 2011 European Road Safety
Atlas project supported by the EU.
Low and middle-income country examples:
The MDB Road Safety Guidelines have identified road safety rating as one of the issues to be considered
in all stages of a road project.
The Ministry of Transport in China is rolling out ChinaRAP assessments to an expected 350,000km of
roads as part of their Highway Safety Enhancement Project titled “highway safety to cherish life”.
The road authority in Mexico (SCT) has assessed over 60,000km of roads and has implemented targeted
maintenance spending to reduce 1 and 2-star road sections by 20%.
The SLoCaT Results Framework developed to support achieving the proposed SDG target to halve road
deaths includes an implementation measure to eliminate one or two star roads by 2030 (p23).
The World Bank SSATP programme has developed the Managing Road Safety in Africa publication that
provides a framework for national lead agencies that “can develop a prioritised program of works
towards achieving at least 3 star safety ratings for all road users” (p46).
The ADB Sustainable Transport Appraisal Rating integrates the star rating performance targets into their
Sustainable Transport Appraisal Rating (see Figure 2 below).
Figure 2 Extract from ADB Sustainable Development Working Paper
iRAP Star Rating and Investment Plan – Implementation Support Guide | 9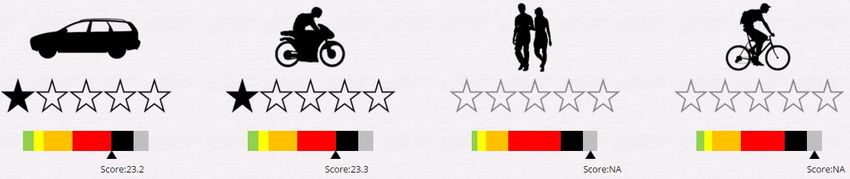
The World Bank and relevant state governments have applied minimum star rating standards as part of
road projects in Karnataka, Assam, Gujarat and Kerala in India. The Gujarat Results Report includes the
monitoring of the length of the corridor meeting the star rating target.
The ADB has also applied a similar star rating approach in Shaanxi and Anhui in China.
Figure 3 Example LMIC Policy Documents recommending safety ratings and iRAP metrics
For further information on the setting of road safety policy targets, the development of local and national action
plans and implementing sustainable road safety strategies, refer to the Global Plan for the Decade of Action
for Road Safety 2011-2020. Further information on the setting of iRAP Star Rating policy targets can be found
at http://irap.org/en/about-irap-3/research-and-technical-papers.
3 Understanding and using the iRAP results
Accessed via ViDA https://vida.irap.org, the iRAP online road safety software platform, the results can be used
to create and analyse interactive safety reports including road condition reports, Star Ratings and Safer Roads
Investment Plans.
ViDA is a suite of online tools for calculating, managing, analysing and presenting RAP Star Ratings and Safer
Road Investment Plans. By using state-of-the-art cloud-computing technology, ViDA provides tools, services
and workflows to manage the RAP data lifecycle, from initial dataset pre-processing to on-screen reports and
downloadable detailed data. The ViDA user guide is available at http://downloads.irap.org/docs/ViDA_tour.pdf.
3.1 Star Rating maps and charts
Star Ratings are a measure of individual risk and are based on Star Rating Scores (SRS). The iRAP models
are used to calculate an SRS at 100 metre intervals for four different road user types, vehicle occupants,
motorcyclists, pedestrians and bicyclists and are based on relative risk factors for each road attribute. The
scores are developed by combining relative risk factors using a multiplicative model. More information on the
risk factors used within the model can be found within the Methodology Documents at www.irap.org. Star
iRAP Star Rating and Investment Plan – Implementation Support Guide | 10Ratings are available in map, table, chart or risk worm format and are a simple and practical way of
communicating road user risk (derived from road infrastructure) to the public and for setting policy targets as
discussed above in section 2.2.
A Star Rating Score (SRS) is calculated for each 100 metre segment of road for vehicles occupants,
motorcyclists, pedestrians and bicyclists. These scores are then allocated to Star Rating bands to determine
the Star Rating for each 100 metre of road. However, for the purposes of producing a network level map
showing Star Ratings, 100 metres is too much detail. Hence, Star Ratings are smoothed (or averaged) over
longer lengths in order to produce more meaningful results. The effect of smoothing is illustrated in the chart
below, which shows unsmoothed (raw) SRS in blue and smoothed SRS in white.
Figure 4 Raw Star Rating Scores (blue) and smoothed SRS (white)
Star Rating Maps show the smoothed (averaged) Star Rating results for different road user groups allowing
the user to see the change in risk across a road network. 5-star roads are shown as a green line on the map,
4-star roads are coloured yellow, 3-star orange, 2-star red and 1-star black. ‘Not applicable’ (grey) is used
where no Star Rating results have been generated for a particular road user. This may be because the road
user type is not present on the surveyed network (for example, often no pedestrian Star Rating is produced on
Expressways and Motorways), or the presence of major road works at the time of the road survey has made
it difficult to accurately record the infrastructure attributes needed to generate the Star Ratings.
Star Rating results are also available in a table showing results by length (in kilometres) and percentage for
each of the four road user groups (where available) for the dataset(s) selected and in charts. Reporting options
allow the user to display the results for different road user types, and either ‘Before’ implementation of the
Safer Roads Investment Plan (SRIP), that is, showing the existing or baseline condition, or ‘After’ SRIP
implementation, that is, assuming all countermeasures identified within the SRIP have been implemented.
iRAP Star Rating and Investment Plan – Implementation Support Guide | 11Further details on the reporting options for each report type are available in the ViDA user guide at
http://downloads.irap.org/docs/ViDA_tour.pdf.
3.2 Safer Road Investment Plans
A Safer Road Investment Plan (SRIP) shows a list of affordable and economically sound road safety
treatments, specifically tailored to reduce risk on the surveyed network. Each countermeasure proposed in the
SRIP is supported by strong evidence that, if implemented, it will prevent deaths and serious injuries in a cost-
effective way. Nevertheless, each countermeasure should be subject to additional prioritisation, concept
planning and detailed design before implementation.
The Safer Roads Investment Plan table available within ViDA provides a summary of the SRIP and details of
the recommended countermeasures. The summary includes:
Total FSIs Saved – an estimate of the total number of fatal and serious injuries (FSIs) that could be
prevented over the life of the plan (analysis period is usually 20 years) assuming all the recommended
countermeasures are implemented.
Total PV of Safety Benefits – an estimate of the total present value (PV) of the economic benefits (from
crash cost savings) that could be realised over the life of the plan, assuming all the recommended
countermeasures are implemented.
Estimated Cost – estimated total cost of implementation and maintenance of the recommended
countermeasures over the life of the plan.
Cost per FSI saved – cost of implementing the countermeasures per fatal and serious injury avoided.
Program BCR – the benefit to cost ratio (BCR) is the estimated economic benefit divided by the
estimated cost of the countermeasures.
By default the countermeasures are listed in order of effectiveness in terms of the numbers of FSIs that the
individual treatment type is estimated to save over the analysis period if implemented. The column headers
within the SRIP table can be selected to sort the data based on other criteria. For example clicking on ‘Program
BCR’ will sort the data in order of cost effectiveness (BCR).
Users can click on any of the countermeasure names to see a map showing the location of the recommended
treatment and to find out more information on the countermeasure from the Road Safety Toolkit
http://toolkit.irap.org/. Zoom in and select one of the blue dots to show the countermeasure details at that 100
metre location.
iRAP Star Rating and Investment Plan – Implementation Support Guide | 12Figure 5 Map showing countermeasure location and 100 metre segment details
There may be a need to manually adjust the SRIP to suit specific project requirements, for example to remove
some recommended treatments from the list or to reduce the overall cost of the investment plan to match
available budgets. See Appendix D for guidance notes on how to amend countermeasure costs and other
aspects of the SRIP within ViDA.
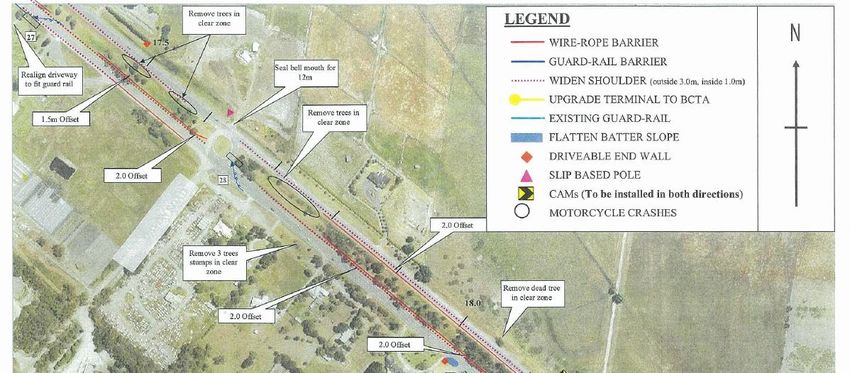
3.3 Strip plans
The strip plan lists countermeasures identified in the Safer Roads Investment Plan (SRIP) by distance along
a section of road. A strip plan can be created by filtering the data to a single road section and then selecting
up to five different countermeasures to be displayed in the report table. The report will show a marker for each
100 metre segment of road where each of the selected countermeasures are recommended. Click on a marker
to provide location details including a map, plus economic details (in local currency) of the proposed
countermeasure at that 100 metre location as shown in Figure 6.
iRAP Star Rating and Investment Plan – Implementation Support Guide | 13Figure 6 Strip plan
It is also possible to create your own customised strip plans from the Countermeasure download file using
pivot tables. Further details can be found in Appendix A.
3.4 Road survey data and detailed road attribute report
iRAP safety inspections take place in two parts, a road survey and road attribute coding. Surveys involve the
collection of digital, panoramic images or videos of the roads and GPS data. These images and data can be
collected using a range of equipment - from simple handheld devices to highly sophisticated survey vehicles
as part of asset data or pavement condition surveys. The images are then used to record (or ‘code’) more
than 50 road attributes that are known to influence the likelihood of a crash and its severity. The inspections
create a permanent video and database record that can be easily reviewed by local engineers and planners
and can also be used to supplement (or as a review of) any highway asset databases.
The Detailed Road Condition tables within ViDA provide the length and percentage for each category of road
attribute recorded during the survey. The data is presented in different groups including roadside attributes,
mid-block features, intersections, facilities for vulnerable road users (VRU), traffic flow information and vehicle
speeds. The information can be used to compare the infrastructure attributes of different roads or road sections
and can help to provide an understanding of the safety features that are present on a given road section and
particularly those features that are not present which are known to influence crash risk.
iRAP Star Rating and Investment Plan – Implementation Support Guide | 14Figure 7 Road attributes that help explain the level of risk on a network
3.5 Download files
Within ViDA there are several downloadable Excel files available that contain all the information collected
and produced during the assessment. There are three main types of download file:
3.5.1 Core Data download file
The Core Data download file contains:
location information for each 100 metre segment of road including road name, section name distance
(chainage), longitude and latitude [columns E to J]
traffic volumes [column BK]
pedestrian and bicycle peak hour flows [columns BM to BP]
road attribute codes [columns M to BJ and BY to BZ]
vehicle operating speeds [columns BQ and BR]
Star Rating Score for each road user crash type [columns CB to CG; CL to CR; CW to CY and DD to DF]
Star Ratings (smoothed and raw) [columns CH to CK; CS to CV; CZ to DC and DG to DJ]
iRAP Star Rating and Investment Plan – Implementation Support Guide | 153.5.2 Fatality Estimation download file
The Fatality Estimation download file contains:
location information for each 100 metre segment of road [columns A to F]
estimated (modelled) number of annual deaths for each 100m segment of road given as the rate per km
by crash type [columns H to M; O to U; W to Z and AB to AD]
estimated (modelled) number of annual deaths for each 100m segment of road given as the rate per km
by road user [columns N; V; AA and AE]
estimated (modelled) total number of annual deaths for each 100m segment of road [column AI]
estimated (modelled) total number of annual deaths and serious injuries for each 100m segment of road
[column AJ].
3.5.3 Countermeasures download file
The Countermeasure download file contains:
location information for each listed countermeasure [columns A to H]
a list of countermeasures for further investigation [column K]
countermeasure service life [column M]; analysis period [column N] and discount rate [column T]
an economic assessment of each countermeasure including initial costs [column V]; construction and
maintenance costs for the duration of the analysis period [column W]; FSIs saved [columns Q and R];
economic cost savings and value of safety benefits [columns S and U]; benefit-cost ratio [column Y] and
internal rate of return [column Z]
The Core Data and Fatality Estimation files are available ‘Before’ implementation of the Safer Roads
Investment Plan (SRIP), that is, showing the existing or baseline conditions, or ‘After’ SRIP implementation,
that is, assuming all countermeasures identified within the SRIP have been implemented.
3.6 Calculating the reduction in fatal and serious injuries
A SRIP (example shown in Figure 8) shows an estimate of the total number of fatal and serious injuries (FSIs)
likely to be prevented over the analysis period if all proposed countermeasures were to be implemented.
iRAP Star Rating and Investment Plan – Implementation Support Guide | 16Figure 8 Safer Roads Investment Plan showing total number of fatal and serious injuries likely
to be saved and analysis period (20 years).
In order to calculate the reduction in FSIs we must first know how many fatal and serious injuries are occurring
on the network. We can calculate how many annual FSIs have been distributed (modelled) across the surveyed
network by using the Fatality Estimations - Before download file and summing the column AJ. For example if
the sum of column AJ is 10,150.5 this means that 10,150.5 annual fatal and serious injuries have been
distributed (modelled) across the surveyed network. Multiplying the annual number of modelled FSIs (the sum
of column AJ) by 20 will give us the number of FSIs on the surveyed network over the next 20 years. Therefore
in this example we have 10,150.5 x 20 = 203,010 FSIs on the surveyed network in 20 years.
The percentage reduction can be calculated by dividing the decrease (120,067) by the original number
(203,010) and multiplying the answer by 100. Example (120,067/203,010)*100 = 59.1%
Note – the Fatality Estimations – After download file can be used to analyse the projected reduction in FSIs by
crash type.
iRAP Star Rating and Investment Plan – Implementation Support Guide | 174 How to prioritise road safety upgrades and
investment plans
In order to reduce the numbers of deaths and serious injuries on our road networks it is important to identify
and prioritise cost-effective road safety countermeasures at hazardous locations.
The analysis and investigation of detailed crash data enables road safety engineers to identify high-risk
locations, define collision problems and enables the design of cost-effective solutions that reduce the
occurrence and/or severity of road crashes.
Where detailed crash data does not exist, or where crashes are so sparsely and randomly distributed that
cluster sites are difficult to identify, the iRAP Star Ratings can help to proactively identify potential hazardous
locations from road infrastructure features based on road safety research conducted by the world’s leading
research agencies. Safer Road Investment Plans can help to identify road safety countermeasures that are
proven to reduce both the likelihood and severity of common road crashes. Many different methods of
identifying and prioritising road safety upgrades using RAP outputs are available, several of which are
described in this section.
4.1 Using the Core Data – Before download file to identify
high risk locations
The Core Data – Before download file can be used to identify the highest risk locations within the surveyed
network. Using the Sort function in Excel the highest risk 100m segments can be displayed in order of risk. For
example by sorting the data by Vehicle SRS Total (column CH) and ordering the data from Largest to Smallest
as shown in Figure 9 below, the data will be listed in order of vehicle occupant risk with the highest risk
segments shown first. The locations can be identified using the columns E (Road Name), F (Section Name),
G (Distance or chainage), and columns I and J (Latitude and Longitude). Copy the latitude and longitude values
of each location into Google Earth to show the location.
Note, in order to identify the highest risk corridors sort the data by Vehicle SRS Total Smoothed (column CI).
Figure 9 Sorting the Core Data – Before Download file by Car Star Rating
iRAP Star Rating and Investment Plan – Implementation Support Guide | 184.2 Using the Core Data – Before download file and the iRAP
Star Rating Demonstrator to understand road user risk
While the Safer Road Investment Plan provides a list of measures that will reduce the risk of a road and
improve the Star Rating, it is important to consider what makes a road section high risk.
The core data download file and the iRAP Star Rating Demonstrator (https://vida.irap.org/en-gb/demonstrator)
can be used together to gain an understanding of the contribution of different road attributes to road user risk.
In the Core Data - Before download file, the highest risk sections can be identified by filtering the roads which
score 1-star in column CJ (the raw Star Rating for each 100m segment). For each road segment that requires
investigation the recorded road attributes (input data) in columns M to BZ is fed into the iRAP Demonstrator
using the drop down lists. The input data in the download file is shown in numerical codes which should be
compared with the Upload File Specification http://downloads.irap.org/docs/RAP-SR-3-
3_Upload_file_specification.xlsx. For example, column AC gives the Roadside severity - driver-side distance.
The codes are shown in Figure 10.
Figure 10 Coding values for Roadside severity – driver-side distance
The numerical code given in the Core Data – Before download file for the selected road segment needs to be
compared with the far left column in Figure 10 and then the corresponding attribute category (in this case
distance to object) is selected in the Demonstrator (Figure 11).
Figure 11 iRAP Demonstrator input for Roadside severity – driver-side distance
Once all the road attributes in the iRAP Demonstrator have been selected to match the row of data from the
download file the corresponding Star Rating Score and Star Rating will be shown.
iRAP Star Rating and Investment Plan – Implementation Support Guide | 19Figure 12 iRAP Demonstrator Star Ratings
The crash type risk that contribute to the Star Rating Score for each road user is shown by selecting “Chart”
at the top of the Demonstrator home page (Figure 13).
Figure 13 Chart display in the Demonstrator for 1-star example
In Figures 12 and 13 there are no Star Ratings given for pedestrians or bicyclists as there was no flow recorded
for these two road user types. The results for both vehicle occupant and motorcyclist are 1-star and the two
large proportions shown in the graph are contributed from the run-off risk either side of the carriageway.
The measures that would be required to reduce the likelihood and/or severity of run-off road crashes therefore
should be considered and tested using the Demonstrator.
The input data in this example had trees located within 1 metre (0-1m) of the carriageway edge. By introducing
a concrete roadside safety barrier adjacent to the carriageway, the input data would change simply from a tree
(numerical code 11) to a safety barrier (code 2) for “Roadside severity - driver-side object” (Figure 14).
iRAP Star Rating and Investment Plan – Implementation Support Guide | 20Figure 14 Chart display in the Demonstrator for 1-star example with barriers
Figure 14 shows that as a result of introducing a roadside barrier the Star Rating becomes a 3-star for vehicle
occupants and 2-star for motorcyclists. Studying the charts further there is another crash type that has a large
proportion contributing to the risk. The head-on loss of control crash type. In the input data, delineation has
been recorded as poor. Figure 15 shows the effects of changing the quality of delineation from poor to
adequate.
Figure 15 Chart display in the Demonstrator for 1-star example with barriers and improved
delineation
The results now show 3-star for both vehicle occupants and motorcyclists.
iRAP Star Rating and Investment Plan – Implementation Support Guide | 21The aim of this exercise is to try out different scenarios based on a ‘what if’ analysis. Although both treatments
reduce risk, barriers and improved delineation may not be the most economically viable option in this example
and so other input variations need to be tested and it is recommended that the treatments suggested in the
Countermeasure download file also be considered. For example, instead of installing a roadside safety barrier,
the closest trees could be removed to create a 5m safety zone so that the distance to the trees is 5-10 metres
(Figure 16).
Figure 16 Chart display in the Demonstrator for 1-star example with improved delineation and 5-
10 metres distance to trees
The iRAP Demonstrator enables users to understand the road infrastructure attributes that influence risk of
death or serious injury for the different road users, the likelihood of various common crash types at a particular
location and the ability to explore different treatments options and their respective impact on reducing road
user risk regardless of economic justification. Whereas the SRIP can be used to provide a list of cost-effective
treatments for further investigation at a given location.
4.3 Comparing Star Rating with Risk Mapping
In countries where detailed crash and traffic data are available, RAP Risk Maps can be produced to give an
objective view of where people are being killed or seriously injured on a road network and where their crash
risk is greatest. By showing the number of fatal and serious collisions per kilometre travelled the results
demonstrate the risk arising from the interaction of road users, vehicles and the road environment.
Prioritising routes for improvement can be undertaken using the Star Rating data and comparing it with
available crash data in the form of Risk Maps. The RAP Risk Mapping protocol
http://downloads.irap.org/docs/RAP-RM-2-1_Risk_Mapping_technical_specification.pdf uses crash and traffic
data for the network surveyed to show individual risk rates per vehicle kilometres travelled. Individual risk is
calculated by dividing the frequency of crashes per year by the distance travelled on each section of highway
iRAP Star Rating and Investment Plan – Implementation Support Guide | 22per year. Routes with an average length of 25km should be produced with a risk rate and an average Star
Rating Score (SRS) assigned. Figure 17 shows the results for plotting the risk rates and Star Rating scores for
an example selection of routes.
Note, ‘Collective risk maps’ showing the density, or total number of casualty crashes over a given length of
road can also be produced by dividing the number of casualty crashes per year by the length of highway.
Figure 17 Average Star Rating Score vs Risk Mapping rates for example routes
120
crashes per billion vehicle km)
Risk Rate (fatal and serious
100
80
60
40
20
0
0 10 20 30 40 50
Average Star Rating Score
Figure 18 below provides a suggested treatment prioritisation plan that can be used to guide road safety
intervention based on crash rates and infrastructure risk based on the Star Rating Score. Note, the higher the
Star Rating Score the higher the potential risk of fatal and serious injury from the road design.
Figure 18 Prioritising routes using risk rates and Star Rating Scores
Road user behaviour, Investigation and action
enforcement, vehicle needed immediately to
Risk Rate
safety improvements improve road infrastructure
Crash investigation at Road engineering
cluster sites, action and improvements needed to
monitor prevent crashes occurring
Average Star Rating Score
Overlaying the risk data shown in Figure 17 with the suggested intervention prioritisation chart (Fig.18) can
help to identify an appropriate road safety treatment strategy.
iRAP Star Rating and Investment Plan – Implementation Support Guide | 23Figure 19 Average Star Rating score vs Risk Mapping rates for example routes
120
Risk Rate (fatal and serious crashes
100
per billion vehicle km) 80
60
40
20
0
0 10 20 30 40 50
Average Star Rating Score
4.4 Identifying common severe crash types using the
Fatality Estimations – Before download file
A detailed analysis of available crash data can be used in order to better understand the safety issues along
a section of road. However, where the quality of crash data is poor or in cases where crash data does not exist
the Fatality Estimations – Before download file can be used to estimate the number of fatalities that occur on
the surveyed network by crash type. For example, the annual number of vehicle occupant run-off road
fatalities estimated to occur on a particular corridor can be calculated by using the Filter to select the required
road or road section and then summing the total in columns H (run-off road driver side) and I (passenger side)
and dividing by 10 (to convert from per km per year to per 100m per year).
4.5 Identifying high risk sections (predicted casualty maps)
In order to prioritise work on the network the Predicted Casualty Reduction map available in ViDA can be used
to show the annual number of fatal and serious injuries that are likely to be prevented per kilometre if the
complete Safer Roads Investment Plan was implemented. This map can help to prioritise the implementation
of countermeasures by identifying specific locations or road sections where the potential to save lives is
greatest.
iRAP Star Rating and Investment Plan – Implementation Support Guide | 24Figure 20 Predicted Casualty Reduction Map
4.6 Selecting appropriate countermeasure treatments
Although a countermeasure may be listed in the Safer Road Investment Plan as being identified as a cost-
effective treatment this does not mean that it should or will be implemented in any future road safety upgrade.
This is because the proposed treatment/s may be inappropriate at a given location. It is therefore important
that each proposed countermeasure be subject to investigation and prioritisation prior to design and
implementation.
In some cases a countermeasure shown on the SRIP may not be suitable or may not be a viable option in a
given location. Some road authorities may wish not to consider certain treatment types and in some cases
design standards do not allow for a treatment type in certain locations. It is possible to customise the SRIP by
using the Ignore function on the Countermeasures page in Dataset setup within ViDA to remove individual
countermeasure treatments from being considered as an option in the SRIP.
Unwanted countermeasures can also be deleted from the Countermeasure download file in order to customise
the investment plan for local conditions. However it is advised that this only be done after the initial investigation
and site visit to ensure that all cost effective treatments are considered when evaluating possible solutions.
4.7 Exploring countermeasure options
Countermeasure options can be explored by amending the iRAP upload file to reflect proposed changes to
the road. For example if a mass-action programme of rumble strips is planned then that attribute can be
changed; if it is proposed that all horizontal curves will have enhanced curve delineation those sections can
be filtered and the road attribute code adjusted. The amended input file can then be uploaded back to the
iRAP Star Rating and Investment Plan – Implementation Support Guide | 25iRAP ViDA software and with fatality calibration factors remaining the same, reprocessed to produce new Star
Rating Scores and a new estimate of the number of deaths and serious injuries on the network, allowing for
the associated economic benefits from the proposed upgrades to be determined. Users may wish to upload
the amended input file to a newly created dataset in order to avoid overwriting the original.
This same approach is also applied when Star Rating designs where any proposed changes to road attributes
identified during the design process can be amended within the upload file and reanalysed. See Section 6 for
more information on Star Rating designs.
Countermeasure options, and their influence on crash risk can also be explored using the iRAP Demonstrator
software which is explained further in Section 6.2.
4.8 Grouping countermeasures by works categories
Countermeasure implementation might be undertaken according to each countermeasure’s works category or
likely source of funding and the ease with which it can be built. This was the approach taken by the Directorate
General of Highways and VicRoads during recent crash reduction investigations on major roads in Indonesia.
Their approach involved assigning countermeasures to one of four categories, as illustrated in Table 1. By
doing so, the responsibilities and tasks in designing and implementing the countermeasures were clarified,
with patterns emerging about what can be done in the short-term and which countermeasures require further
planning.
Table 1
Example
Category Description Lead time
countermeasure
Delineation,
Countermeasures for immediate implementation by the
road surface
A region/district public works office as part of its routine Immediate
improvement,
maintenance programme
informal footpaths.
Countermeasures that require reconstruction or other works
that do not add capacity to the road and which can be defined Shoulder sealing,
by simple diagrams or typical cross-sections but cost sidewalks,
B 1 year
estimates are required to schedule the works in the pedestrian crossing,
region/district public works office annual budget programme bicycle lane.
for funding road works
Countermeasures that require reconstruction or other works
that do not add capacity to the road, but for which Intersection
topographical survey and / or detailed design is required, and improvement,
C 2-5 years
for which cost estimates are required to schedule the works in horizontal
the region/district public works office annual budget realignment.
programme for funding road works
Countermeasures that require major new works and would
result in an increase in capacity of the road. These require Duplication,
D coordination with broader planning strategy and support from 5-10 years grade separation of
development banks, donors and consulting engineers might intersections.
be necessary
iRAP Star Rating and Investment Plan – Implementation Support Guide | 264.9 Using Benefit Cost Ratios to prioritise investment
options
Having identified a priority location or section of road, it is possible to further tailor the countermeasure plan to
suit specific circumstances. This is especially useful if budget constraints have changed. Figure 21 provides
an example of the way in which cost-effectiveness may be used to generate a list of priority countermeasures
within a limited budget. In this example the SRIP was used to produce a list of all countermeasures that could
feasibly be built on the road, sorted in order of descending benefit cost ratio (BCR). The countermeasure
download file, available within ViDA, was used to generate this list.
In the example shown below, the initial SRIP showed that the cumulative cost of investments with a BCR of 1
or more was slightly over $100 million, as indicated by the red line in Figure 21. An alternative option is to set
an initial budget of, say, $2 million. This is indicated by the green line in Figure 21. For this budget, all
countermeasures with a BCR of 45.6 or more could be implemented.
Figure 21 Prioritising countermeasures on a particular road according to different budgets
The most cost
effective
countermeasure is
listed first
With a $2 million
budget, all
countermeasures
with a BCR
greater than 45.6
could be
considered
If budget was
unlimited, all
countermeasures
with a BCR
greater than 1
could be
considered
Countermeasures
with a BCR below
1.0 are often not
considered
iRAP Star Rating and Investment Plan – Implementation Support Guide | 274.10 Route treatments
Road safety countermeasures can be identified, designed and implemented using a prioritization method
based on a corridor or route action approach. This involves systematically investigating collisions along a
section of road where the road character is relatively homogeneous. A study of such routes should include
investigation of each hazardous location (i.e. where SRS are highest) and sections of road that experience
repeated crash type (if detailed crash data is available). The aim is to identify common features that contribute
to collisions and identify engineering solutions that can be applied along the entire route or corridor. Examples
of route treatments include delineation improvements such as carriageway edge markings or retro-reflective
road studs (cats-eyes), roadside safety barriers on rural curves with hazardous roadsides and shoulder
sealing. These types of treatments can be filtered using the Countermeasure download file available in ViDA
to produce a schedule of works for further investigation and prioritisation.
4.11 Mass action treatments
The mass action approach uses data for an entire or a selected part of a road network to identify hazardous
locations with similar road infrastructure features for which there is a proven countermeasure treatment. This
involves applying a specific, cost-effective treatment to proactively address a particular issue at all locations
where the feature is present, irrespective of whether collisions have yet occurred at all of them. An evaluation
should be made of the viability (perhaps by BCR) of applying the proven treatment to all or some of these
locations. Examples of mass action treatments include dedicated turn lanes at priority junctions, footpaths
where pedestrians are prominent, pedestrian crossings and school safety zones at schools and other
educational establishments, gateway treatments and traffic calming features at rural towns and villages. These
types of treatments can be filtered using the Countermeasure download file available in ViDA to produce a
schedule of works for further investigation and prioritisation.
4.12 Building safety into road maintenance budgets
Best practice examples from high income countries shows that low-cost measures can make a significant
impact on road safety and return high BCRs. Table 2 provides a list of road attribute improvements that are
often reported on roads that have seen a significant reduction in deaths and serious injuries. The associated
relative risk factors used in the Star Rating model are also given.
Table 2 Risk factors by road attribute associated with maintenance measures
Attribute Risk Factor
Lowest Score (vehicle occupant) Medium/Highest score (vehicle occupant)
Intersection quality 1.0 (adequate) 1.2 (poor)
Delineation 1.0 (adequate) 1.2 (poor)
iRAP Star Rating and Investment Plan – Implementation Support Guide | 28You can also read