Ireland and the UK - Tax and Customs Links - July 2017 Statistics & Economic Research Branch - Irish Government ...
←
→
Page content transcription
If your browser does not render page correctly, please read the page content below
Ireland and the UK –
Tax and Customs Links

July 2017
Statistics & Economic Research Branch
Ireland and the UK –
Tax and Customs Links

The authors are Donnchadh O’Donovan (dodonova@revenue.ie), Sinead Duffy
(sduffy02@revenue.ie), Gerard McGuinness (gmcgui01@revenue.ie) and Keith Walsh
(keithw@revenue.ie) of the Statistics & Economic Research Branch in the Office of the
Revenue Commissioners. Gerard McGuinness and Keith Walsh are also members of the
Irish Government Economic & Evaluation Service (“IGEES”). Any opinions expressed in this
paper are the views of the authors and do not necessarily reflect the views of the Office of
the Revenue Commissioners or IGEES. The authors alone are responsible for the
conclusions.
July 2017

Table of Contents

    Table of Contents ................................................................................................. 1
    List of Figures ...................................................................................................... 1
    List of Tables ....................................................................................................... 1
    Executive Summary .............................................................................................. 2
    1 Introduction ................................................................................................... 3
    2 Flows between Ireland and the United Kingdom .................................................. 4
      2.1 Investment and Trade .................................................................................. 4
      2.2 Movements of Vehicles and Freight ................................................................. 6
      2.3 People .......................................................................................................13
    3 Taxpayers and Tax Receipts ............................................................................16
      3.1 Businesses in the Border Counties .................................................................16
      3.2 Businesses Trading with the UK ....................................................................18
      3.3 Multinational Companies Exposed to the UK Economy ......................................23
      3.4 Farmers .....................................................................................................24
    4 Conclusion ....................................................................................................26

List of Figures

Figure    1 – Irish Services Trade 2015 ......................................................................... 4
Figure    2 – Irish Goods Trade 2016 ............................................................................ 5
Figure    3 – Northern Ireland to Ireland Traffic Volumes ................................................. 7
Figure    4 – Northern Ireland to Ireland Traffic Volumes by Route 2014-2016 ................... 8
Figure    5 – Northern Ireland to Ireland Goods Vehicle Traffic by Day 2016 ...................... 9
Figure    6 – Northern Ireland to Ireland Passenger Vehicle Traffic by Day 2016 ................11
Figure    7 – Tonnage of Goods Received by Irish Ports and Trade Partner 2015 ................12
Figure    8 – Tonnage of Goods Handled by Irish Airports ...............................................13
Figure    9 – Cross Border Commuters by Origin and Destination .....................................15
Figure    10 – Tax Receipts in Border Counties 2016 ......................................................16
Figure    11 – Supply of Telecommunications, Broadcasting and Electronic Services ...........20
Figure    12 – Share of Companies Exporting to UK by Sector 2014 .................................23
Figure    13 – Share of Companies Exporting to UK and Other EU by Sector 2014 .............24

List of Tables

Table    1 – Value of Irish Goods Trade with UK by Product 2016 ..................................... 5
Table    2 – Volume of Irish Goods Trade with UK by Product 2016 ................................... 6
Table    3 – Ireland/Northern Ireland Journeys by Goods Vehicle Type .............................. 9
Table    4 – Road Freight Activity 2014 ........................................................................10
Table    5 – Road Freight Activity by Origin and Destination 2014 ....................................10
Table    6 – Border Counties – Numbers of Employers 2015 ............................................17
Table    7 – Border Counties – Number of Employees 2015 .............................................17
Table    8 – Border Counties – Employers by Sector 2015...............................................17
Table    9 – Duty Suspended Movements of Excisable Products 2015 ...............................18
Table    10 – Duty Suspended Receipts from Excisable Products 2016 ..............................18
Table    11 – Non-Duty Suspended Excisable Products 2016 ...........................................18
Table    12 – Distance Selling Traders Registered in Ireland ............................................20
Table    13 – Non-Irish Traders VAT Registered in Ireland ..............................................21
Table    14 – UK Exporters in Border Counties – Number of Employees 2015 ....................22
Table    15 – UK Importers in Border Counties 2015 ......................................................22
Table    16 – Farming Cases 2014 ...............................................................................25

1                                                                            Statistics & Economic Research Branch
July 2017 Executive Summary The decision of the United Kingdom (UK) of Great Britain and Northern Ireland to exit the European Union (EU) has significant impacts across many areas. This paper’s focus is on the links between Ireland and the UK that may affect tax and customs matters. Two primary topics are examined – flows between the two jurisdictions that may carry customs implications and the links of Irish based businesses to the UK and their tax contributions to the Irish Exchequer. Section 2 of the paper outlines the flows between Ireland and the UK – trade, investment, traffic (by road, sea and air) and people. The UK is Ireland’s largest trading partner, purchasing 19 per cent and 13 per cent of Irish services and goods exports respectively and the source of 8 per cent of services imports and 23 per cent for goods. Looking at trade with Northern Ireland (NI) alone, the importance of Food & live animals products is relatively more important than for overall UK-Ireland trade. For the twelve national roads crossing the border, in 2016 there are over 14 million vehicles entering Ireland from NI (or nearly 40,000 per day). With only around 15,000 residents of either jurisdiction in employment or education on the other side of the border, it is clear that trade accounts for significant shares of the cross border movements. Section 3 uses Revenue data to identify businesses in Ireland linked to the UK and outlines their contribution to the Irish tax base. This covers businesses trading with the UK, those located in border areas with NI, the multinational sector linked to the UK and farmers. Businesses in the border counties employ around 230,000 people and contribute slightly over 5 per cent of receipts for most taxes. In 2015 there are approximately 12,000 Irish traders exporting goods and/or services to the UK, with an estimated value of these exports in the region of €33 billion. These traders directly employ over 680,000 people. Around 1,600 of these businesses are in border counties and the value of their exports to the UK is €2.2 billion. Approximately 90,000 Irish based businesses import goods and/or services from the UK and 14,000 are based in the border counties. The analysis shows widespread linkages between Irish and UK economies. Links to NI are more limited but also more highly concentrated in specific areas or sectors. Brexit will not eliminate UK/Ireland linkages (or their Exchequer contributions) but it may well diminish or change them. This analysis indicates the potential scale and range of the outcome. 2 Statistics & Economic Research Branch
July 2017

1 Introduction

The decision of the United Kingdom (UK) of Great Britain and Northern Ireland to exit the
European Union (EU) has significant impacts across many areas. This paper’s focus is on
the links between Ireland and the UK that may impact on tax and customs matters.

Two primary topics are examined – flows between the two jurisdictions that may carry
customs implications and the links of Irish based businesses to the UK and their tax
contributions to the Irish Exchequer.

Economic research by Government on the impacts of Brexit has been underway since
2015. The Economic & Social Research Institute (ESRI) produced a Brexit scoping paper in
November 2015.1 This was followed in November 2016 with reports assessing product and
sector impacts of a hard Brexit and modelling the long term macroeconomic impact of
Brexit on Ireland.2 The Department of Finance (DoF) published several reports related to
Brexit at the time of Budget 2017 (October 2016), including an overview of how Brexit
may impact the Irish economy and a more in-depth analysis of the trade exposure of
sectors to the UK.3 InterTradeIreland recently published ESRI analysis of the impact tariffs
on cross border trade.4 The Central Statistics Office (CSO) published a report in December
2016 that documents numerous facets of Irish/British links and in April 2017 the National
Competitiveness Council benchmarked Ireland’s competitiveness with the UK.5

This paper follows the approach of the DoF trade sector exposure research and the CSO
summary. The objective is to outline links between Ireland and the UK and identify the
areas that may be affected by Brexit. Where available, the research uses Revenue case or
micro level data to build bottom up measures of these links. The focus is on the value and
magnitude of existing links, the paper does not draw inferences on the impact of Brexit.

Section 2 of the paper outlines the flows between Ireland and the UK – trade, investment,
traffic (by road, sea and air) and people. Section 3 uses Revenue data to identify
businesses in Ireland linked to the UK and outlines their contribution to the Irish
Exchequer. This covers businesses trading with the UK, those located in border areas, the
multinational sector linked to the UK and farmers. Section 4 concludes.

1
  See https://www.esri.ie/pubs/RS48.pdf (the research was conducted under the joint Department of Finance
and ESRI Research Programme on The Macroeconomy and Taxation).
2
  See http://www.esri.ie/pubs/WP550.pdf and https://www.esri.ie/pubs/WP548.pdf (the latter paper is also part
of research conducted under the joint Department of Finance and ESRI programme).
3
  See Getting Ireland Brexit Ready and UK EU Exit – An Exposure Analysis of Sectors of the Irish Economy
(updated March 2017).
4
  See http://www.intertradeireland.com/researchandpublications/publications/publications/name-43052-en.php.
5
  See Brexit – Ireland and the UK in Numbers and http://www.competitiveness.ie/News-Events/2017/NCC-
Benchmarking-Competitiveness-for-Publication.pdf.

3                                                                   Statistics & Economic Research Branch
July 2017

2 Flows between Ireland and the United Kingdom

Links exist between Ireland and the UK across numerous channels. These links are seen in
the myriad of flows of goods and services, vehicles and people between the two countries.

2.1 Investment and Trade
The CSO shows that the UK accounts for €89 billion or 10.9 per cent of total outward Irish
direct investment in 2015 (down from 15.3 per cent in 2014). For inward investment, the
UK’s share is lower at €37 billion or 4.6 per cent in 2015 (2014 is €43 billion or 12.6 per
cent, showing the volatility in these figures). 6 As well as direct investment, Irish residents
hold significant portfolio securities in the UK (2015): €114 billion in equities, €216 billion
in bonds and notes and €70 billion in money market instruments.

The CSO also outlines export and import positions between Ireland and the UK. For total
services trade, Irish exports and imports are valued at €122 billion and €151 billion
respectively for 2015 (Ireland has a net trade deficit in services). Ireland’s exports to the
UK are €23.5 billion, imports from UK are €12 billion (Figure 1). Computer services
account for the single largest share of Irish services exports to the UK. UK services
imports arise from businesses services but limited descriptive information is available.7

                                Figure 1 – Irish Services Trade 2015
                          Exports                                                  Imports

                                                                                          UK
                                 UK                                                       8%
                                19%

                Rest of                                                                     Other EU
                World                                                                         28%
                 46%           Other EU                                       Rest of
                                 35%                                          World
                                                                               64%

                            Source: Revenue analysis of CSO Balance of Payments data.

For trade in goods, total Irish exports are valued at €118 billion and imports at €72 billion
for 2016. Figure 2 shows the share of these traded with the UK. While Ireland has overall
net trade surplus for goods, trade with the UK has a deficit (imports of €16.8 billion, €15.0
billion in exports). With Great Britain (GB) only there is also a deficit (imports of €15.8

6
 Section 3.3 discusses employment in Irish and foreign owned affiliates.
7
 It is noteworthy that globally royalties and licences account for nearly half of Irish services imports but these
are relatively immaterial from UK.

4                                                                       Statistics & Economic Research Branch
July 2017
billion, exports of €13.4 billion) but trade with Northern Ireland (NI) is in surplus in 2016
(imports €1.1 billion, exports €1.6 billion).
Figure 2 – Irish Goods Trade 2016
Exports Imports
NI
GB 2%
11% GB
22%
Rest of
World NI
Rest of 40% 1%
World
49% Other EU
38% Other EU
37%
Source: Revenue analysis of CSO External Trade data.
Table 1 shows the distribution of Irish goods trade with UK by region and product. Food &
live animals is important for both GB and NI trade but particularly so in relative terms for
NI (31 per cent of Irish exports to NI and 42 per cent imports are in this category). A
number of manufacturing and related products are important to Ireland/GB trade but they
feature less in Ireland/NI trade.
Table 1 – Value of Irish Goods Trade with UK by Product 2016
Exports to Imports from
GB NI GB NI
€ Million € Million € Million € Million
Food and live animals 3,705 517 2,773 452
Beverages and tobacco 219 87 318 39
Crude materials, inedible, except fuels 372 79 153 52
Mineral fuels, lubricants and related materials 465 38 2,087 17
Animal and vegetables oils, fats and waxes 11 6 46 19
Chemicals and related products 3,993 179 2,374 62
Manufactured goods classified chiefly by material 929 237 1,739 122
Machinery and transport equipment 2,204 156 3,016 116
Miscellaneous manufactured articles 1,129 184 2,230 78
Other 334 165 1,005 110
Total 13,361 1,649 15,743 1,067
Source: Revenue analysis of CSO data.
The above information is based on values of trade. It is also useful to consider trade flows
in volume terms as shown in Table 2. The largest import sector is Mineral fuels, lubricants
& related materials, this is mainly petroleum and gas products. Within Food & live animals
the largest imports are cereals, vegetables, fruits and feed while meat, meat products and
dairy are the largest exports.8
8
Clearly for certain types of product, tonnage is of limited use as an indicator (e.g., pharmaceutical products).
5 Statistics & Economic Research BranchJuly 2017
Table 2 – Volume of Irish Goods Trade with UK by Product 2016
Exports to Imports from
GB NI GB NI
000s 000s 000s 000s
Tonnes Tonnes Tonnes Tonnes
Food and live animals 1,321 727 1,776 1,121
Beverages and tobacco 395 138 429 62
Crude materials, inedible, except fuels 952 1,281 579 1,360
Mineral fuels, lubricants and related materials 1,868 154 6,570 126
Animal and vegetables oils, fats and waxes 15 14 58 35
Chemicals and related products 253 123 872 113
Manufactured goods classified chiefly by material 2,135 1,017 1,217 156
Machinery and transport equipment 115 24 238 19
Miscellaneous manufactured articles 149 24 513 25
Other 0 0 9 1
Total 7,203 3,502 12,263 3,016
Source: Revenue analysis of CSO data.
DoF research examines in more detail the exposure of sectoral trade, including assessing
the dependence of Irish exporters on the UK market. The InterTradeIreland/ESRI research
referenced in Section 1 has more detail on the nature of the Ireland/NI trade and the
products that fall within the categories of goods outlined in Tables 1 and 2. It should also
be noted that significant Irish trade uses the UK as a “landbridge”, being shipped across
UK on the way to or from other markets. Such trade is not counted as UK/Ireland trade in
the CSO data.
The vast majority of used cars imported into Ireland are from the UK and these have
increased in recent years, largely due to changes in the Sterling/Euro exchange rate.
Based on Revenue’s VRT data, vehicle imports from the UK increased from 42,800 in 2015
to 66,500 in 2016 (an increase of 55 per cent). In the year to April 2017, there are 29,600
such registrations (up 56 per cent on the same period in 2016).
2.2 Movements of Vehicles and Freight
Vehicles can enter into the Republic of Ireland from the UK either via road from NI or on
ferries from the mainland UK. Freight also arrives through airports.
2.2.1 Roads
Transport Infrastructure Ireland (TII) capture data on the number of vehicles crossing the
border on national roads. This information is categorised by the direction of the traffic flow
and the vehicle type: Cars, Motor Bike, Bus, Caravans, Articulated Heavy Goods Vehicle
(HGV-ART), Rigid Heavy Goods Vehicle (HGV-RIG) and Light Goods Vehicle (LGV). 9
9
Goods vehicle classifications are determined by features such as axle number and axle width, measurements
are made at the point of data collection by the traffic counter system.
6 Statistics & Economic Research BranchJuly 2017
For the twelve national roads crossing the border, in 2016 there are over 14 million
vehicles entering Ireland from NI: 1 million crossings by HGVs or 2,700 on average per
day; 1.3 million by LGVs or 3,600 per day; and 12 million by cars or 32,900 per day.10
Figure 3 reveals a seasonal pattern with positive year on year growth rates in traffic flows
across all vehicle types entering Ireland from NI. Generally lower traffic flows are observed
during the winter months while higher volumes are observed during the other seasons.
Figure 3 – Northern Ireland to Ireland Traffic Volumes
All Traffic
1,600,000
1,400,000
1,200,000
1,000,000
800,000
600,000
400,000
200,000
0
Oct-14
Sep-15
Oct-15
Oct-16
Sep-14
Dec-14
Dec-15
Sep-16
Dec-16
Feb-14
Aug-14
Aug-15
Aug-16
Jan-14
Mar-14
Apr-14
Jan-15
Feb-15
Mar-15
Apr-15
Jan-16
Feb-16
Mar-16
Apr-16
May-14
Jun-14
Jul-14
Nov-14
May-15
Jun-15
Jul-15
Nov-15
May-16
Jun-16
Jul-16
Nov-16
Cars Goods Vehicles
1,400,000 140,000
1,200,000 120,000
1,000,000 100,000
800,000 80,000
600,000 60,000
400,000 40,000
200,000 20,000
HGV-ART HGV-RIG LGV
0 0
Jul-14
Jul-15
Jul-16
Jan-14
Oct-14
Jan-15
Oct-15
Jan-16
Oct-16
Apr-14
Apr-15
Apr-16
Jan-14
Apr-14
Oct-14
Jan-15
Apr-15
Oct-15
Jan-16
Apr-16
Oct-16
Jul-14
Jul-15
Jul-16
Source: Revenue analysis of TII data. Note: Cars includes other non-commercial vehicles also.
As shown in Figure 4, of the twelve cross border routes, the main Dublin to Belfast route
the N01 accounts for 28 per cent of all recorded vehicles. The two next busiest are the
10
Movements in the opposing northerly direction, Ireland to NI, are roughly equal.
7 Statistics & Economic Research BranchJuly 2017
N13 and the N14, both in Donegal. These three routes make up 53 per cent of all traffic
volumes and 52 per cent of all goods vehicles.
The profile of road freight varies between routes. While the N01 accounts for the largest
volume of LGVs in absolute terms, goods vehicles make up a larger proportion of traffic
along some of the other routes. The two routes from Monaghan have the highest ratio of
goods to passenger vehicles (almost 25 per cent of all traffic on these routes is classified
as goods vehicles) during 2014 to 2016.
Figure 4 – Northern Ireland to Ireland Traffic Volumes by Route 2014-2016
Source: Revenue analysis of TII data.
Looking at goods vehicles, LGVs are the largest category and have experienced the largest
positive (southerly) growth rate with an annual average yearly increase of 21 per cent
over the period 2014 to 2016. All other vehicle categories also experienced growth (at a
slower rate) over this period. HGV-RIGs make up the lowest number of journeys and show
the smallest increase (10.3 per cent).
8 Statistics & Economic Research BranchJuly 2017
Table 3 – Ireland/Northern Ireland Journeys by Goods Vehicle Type
Vehicle Type Direction 2014 2015 2016 YoY 14-15 YoY 15-16 YoY 14-16
HGV-ART Northerly 599,850 660,547 710,450 10.1% 7.6% 18.4%
Southerly 611,008 656,611 706,512 7.5% 7.6% 15.6%
HGV-RIG Northerly 279,888 303,136 329,041 8.3% 8.5% 17.6%
Southerly 299,589 305,421 330,469 1.9% 8.2% 10.3%
LGV Northerly 997,694 1,146,474 1,311,804 14.9% 14.4% 31.5%
Southerly 1,065,401 1,140,030 1,289,496 7.0% 13.1% 21.0%
All 3,853,430 4,212,219 4,677,772 9.3% 11.1% 21.4%
Source: Revenue analysis of TII data.
As well as seasonal patterns, daily patterns are also available (Figure 5). For both HGV-
ART and HGV-RID the pattern is similar. The majority of heavy goods freight is recorded
Monday through Thursday at an increasing volume. On Fridays, Saturdays and Sundays,
volumes drop. LGVs present a similar pattern to HGVs while less stark. For all goods
vehicles Saturday shows the lowest volumes of traffic.
Figure 5 – Northern Ireland to Ireland Goods Vehicle Traffic by Day 2016
1,400,000
HGV-ART HGV-RIG LGV
1,200,000
1,000,000
800,000
600,000
400,000
200,000
0
Sunday
Friday
Sunday
Friday
Sunday
Friday
Saturday
Saturday
Saturday
Monday
Tuesday
Wednesday
Thursday
Monday
Tuesday
Wednesday
Thursday
Monday
Tuesday
Wednesday
Thursday
Source: Revenue analysis of TII data.
An additional data source on road goods transport is provided by the NI Department of
Infrastructure relating to the total amount HGV freight movements across the island of
Ireland for 2014. The data are collated using a variety of sources from both jurisdictions to
provide an estimate of the volumes of road freight movement within the island of Ireland
and the proportion that moves between NI and Ireland.
9 Statistics & Economic Research BranchJuly 2017
The total HGV road freight activity within the island by vehicles registered in Ireland, NI or
GB in 2014 is 14.9 million laden journeys, carrying 169,000 thousand tonnes of goods is
provided in Table 4.
Table 4 – Road Freight Activity 2014
Tonne-Kilometres Tonnes Carried Vehicle Kilometres Laden Journeys
Vehicles Place of
Registration % of % of % of % of
million Thousand million thousand
total total total total
Republic of Ireland 9,772 73 112,499 67 1,307 72 10,094 68
Northern Ireland 3,466 26 55,363 33 490 27 4,533 30
Great Britain 61 0 1,138 1 19 1 290 2
Freight Overall 13,299 100 169,000 100 1,816 100 14,917 100
Source: Revenue analysis of Department of Infrastructure (NI) data.
Table 5 provides a breakdown of these journeys into origin and destination. The vast bulk
(over 90 per cent) of HGV movement by vehicles registered in the Republic is within the
State. Cross border movements to NI account for less than 1 per cent of all HGV
movements in 2014. In total, 489 thousand tonnes are carried from Ireland to NI and 316
thousand tonnes are carried from NI to Ireland. The same measures are also shown for
HGVs registered in NI. In total 62,707 thousand tonnes are carried by NI registered HGVs
with 4,921 thousand tonnes carried from NI to the Republic.
Table 5 – Road Freight Activity by Origin and Destination 2014
Republic of Ireland Registered HGVs
Destination
Origin Great Britain & Total
Republic of Ireland Northern Ireland
Other Countries
Republic of Ireland 106,213 489 2,062 108,765
Northern Ireland 316 52 7 376
GB & Other Countries 1,644 7 1,709 3,359
Total 108,173 547 3,777 112,499
Northern Ireland Registered HGVs
Destination
Origin Great Britain & Total
Northern Ireland Republic of Ireland
Other countries
NI 46,012 4,921 961 51,895
Republic of Ireland 2,912 1,518 : 4,504
GB & Other Countries 649 283 5,377 233
Total 49,160 6721 190 62,707
Source: Revenue analysis of Department of Infrastructure (NI) data. Note: figures are goods lifted (thousand
tonnes); total journeys for NI registered HGVs does not match Table 4 figure as excludes journeys that start and
end outside of the island of Ireland.
Turning to passenger vehicles, based on TII data, car volumes display the same seasonal
pattern as good vehicles (shown earlier in Figure 3). Peaks occur during summer months
and troughs during winter. On a daily basis, Sundays experiences the lowest volume of car
10 Statistics & Economic Research BranchJuly 2017
traffic and Fridays are consistently the highest (Figure 6). Volumes on Fridays are 18 per
cent higher than those experienced on Sundays. The weekly pattern for car traffic is
decidedly different from that of freight vehicles – with Thursdays, Fridays and Saturdays
being consistently busier days. Fridays and Saturdays have seen slightly increased
volumes of traffic since the referendum. 11
Figure 6 – Northern Ireland to Ireland Passenger Vehicle Traffic by Day 2016
4,000,000
3,000,000
2,000,000
1,000,000
0
Sunday
Friday
Saturday
Tuesday
Thursday
Monday
Wednesday
Source: Revenue analysis of TII data.
Looking at hourly data for the times of border crossings, there is a higher volume of traffic
flowing from the North into Ireland in the early mornings, with a higher volume flowing
from the Republic to NI in after 17:00 hours, likely to be indicative of a greater number of
NI residents working in Ireland (see Section 2.3).
2.2.2 Ports and Airports
Ireland’s maritime ports record significant flows of goods entering the country. Based on
CSO figures, Irish ports had 12,200 vessel arrivals in 2015. According the Dublin Port
Company, there are 115 UK ferries per week.12
According to the CSO, Irish ports handled 50.6 million tonnes of goods in 2015: 33.6
million tonnes of goods received and 17 million tonnes forwarded. Figure 7 shows the
received amounts by trade partner. The UK has the largest shares for both forwarding and
receiving, followed by other EU countries. Dublin port alone handles over 80 per cent by
weight of all goods received from the UK. Of the 11.2 million tonnes received in Ireland
11
InterTradeIreland produce a quarterly survey of shopping mall carparks in NI with the share of Irish registered
vehicles recorded. An increase in Ireland registered cars is evident in the first three quarters of 2016.
12
These ferries take approximately an hour to unload and an hour to load.
11 Statistics & Economic Research BranchJuly 2017
from the UK in 2015, 6.3 is received through Roll-on/Roll-off (RoRo) traffic and only 0.3
million through Lift-on/Lift-off (LoLo), with the largest share of the remainder coming in as
liquid bulk products (oil products are likely a significant component of this). The UK
accounts for 85 per cent of RoRo received traffic by weight.
Figure 7 – Tonnage of Goods Received by Irish Ports and Trade Partner 2015
000s Tonnes
0 5,000 10,000 15,000
Bantry Bay
Castletownbere
Dundalk
Drogheda
Dublin
Shannon Foynes
GB&NI
Greenore
Other EU
Galway
Rest of World
Killybegs
Coastal trade
Kinsale
New Ross
Cork
Rosslare
Sligo
Waterford
Wicklow
Youghal
Source: Revenue analysis of CSO data.
In terms of vehicles coming inward through Irish ports in 2015, CSO data show 397,300
cars (including trailers), 6,900 buses, 172,200 trade vehicles and 520,500 freight vehicles
(including 22,700 empty freight vehicles).13
2.2.3 Airports
A total 76,600 tonnes is received into Ireland by air in 2016 based on CSO data, of which
20,400 (27 per cent) came from the UK.14 Air freight received from the UK exceeds the
volume of goods received from any other country and is within a small margin of the total
volume received from all third countries (i.e., excluding EU member states). The two
principal Irish airports handling air freight goods are Dublin and Shannon airports, with
Dublin handling over 95 per cent of all goods (by weight). Close to 30 per cent of all goods
13
A breakdown for UK only is not available.
14
Outward volumes and numbers are similar.
12 Statistics & Economic Research BranchJuly 2017
handled by Dublin airport are from the UK while for Shannon airport this figure increases
to nearly 80 per cent.
Figure 8 – Tonnage of Goods Handled by Irish Airports
8
7
6
000s Tonnes
5
4
3
2
1
United Kingdom Other Countries
0
Sep-13
Sep-14
Sep-15
Sep-16
Jan-13
Jan-14
Jan-15
Jan-16
Jan-17
Mar-13
May-13
Mar-14
May-14
Mar-15
May-15
Mar-16
May-16
Mar-17
Jul-13
Nov-13
Jul-14
Nov-14
Jul-15
Nov-15
Jul-16
Nov-16
Source: Revenue analysis of CSO data.
As shown in Sections 2.1 and 2.2, there are considerable flows of goods and vehicles into
Ireland from the UK. Landbridge trade, traversing between Ireland and another country
via the UK, is also a factor in the movement of freight vehicles. Unlike the CSO trade data
in Section 2.1, which separates out such trade from UK imports and exports, the sources
discussed in Section 2.2 do not distinguish.
Of particular interest from a customs and tax perspective is the nature of the movement of
LGVs and their content. As noted, in 2016 there are 1.3 million LGV crossings by road
from NI into Ireland. The ports handled 172,200 trade vehicles in 2015 (this excludes
freight vehicles), the vast majority likely coming from the UK. Express carriers and
couriers have grown in recent years, increases in online shopping, ecommerce and
distance selling are often moved and delivered through such firms.
2.3 People
2.3.1 Transport Channels
People can travel into and out of Ireland through a range of channels and do so for
different reasons. For air passengers, there are 16.3 million arrivals in 2016, 6.4 million
(39 per cent) from the UK. There are 123,800 commercial flights into Ireland with 58,200
13 Statistics & Economic Research BranchJuly 2017
(47 per cent) from the UK.15 The UK accounts for around half of inward movements by air
from the EU in Ireland. There are 2.6 million passengers through Irish ports in 2016,
around 85 per cent from/to GB (Irish Maritime Development Office).
2.3.2 Visitors
Numbers of overseas visitors, from all sources, have been growing in recent years, as has
their average spending while in Ireland.
According to the CSO, there are 9.6 million overseas trips to Ireland by non-residents in
2016 and visitors from GB account for 3.9 million (41 per cent) of these trips.16 The vast
majority of these are visiting family/friends or for holidays. Residents from the UK are the
single highest country of origin for visits to Ireland.
While total expenditure (excluding fares) by visitors from GB is €1,061 million in 2016, the
average spend is quite small at €270 per trip (the average stay is for 4 nights). For all
visitors, the average spend is €478 (the average stay is 7 nights).
For Irish residents, the number of trips abroad is 7.4 million in 2016, with 27 per cent to
GB and 5 per cent to Northern Ireland. The average spend per trip is €490 for GB and
€249 for NI, with average stays of 4.1 nights and 2.5 nights respectively.
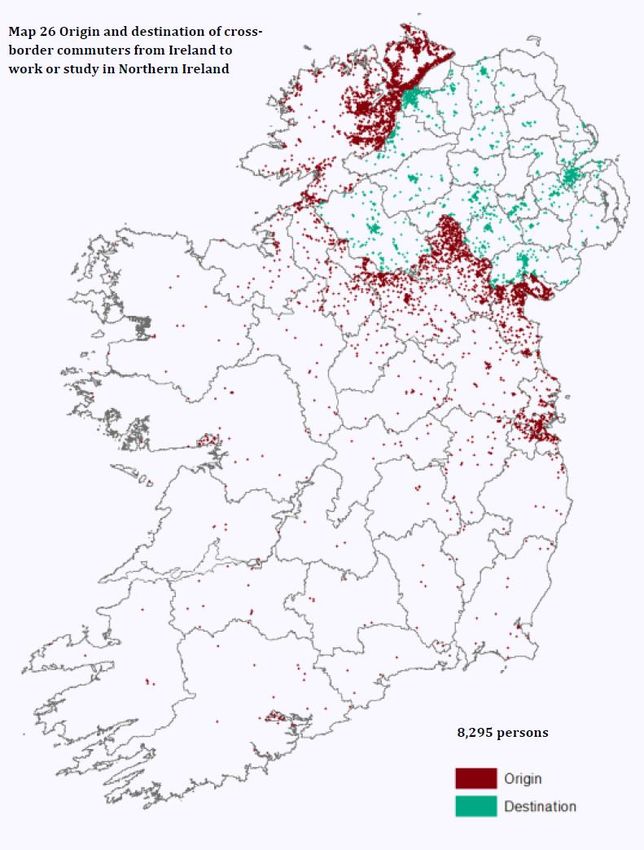
2.3.3 Commuters
Given the land border between Ireland and NI, it is not surprising that residents of both
jurisdictions commute to work on the other side of the border. CSO data (from the 2011
Census) indicate that 8,295 residents from Ireland are in full-time education or in
employment in NI. There are 6,456 residents from NI in 2011 that are either in full-time
education or in employment in Ireland. It is notable that while 43 per cent of Irish
residents commuting north are male, 57 per cent of those coming south are male. Figure
9 maps these linkages.
15
Outward volumes and numbers are similar.
16
Excludes trips from NI.
14 Statistics & Economic Research BranchJuly 2017
Figure 9 – Cross Border Commuters by Origin and Destination
Ireland to Northern Ireland Ireland to Northern Ireland
Source: CSO.
15 Statistics & Economic Research BranchJuly 2017
3 Taxpayers and Tax Receipts
There are significant linkages between Ireland’s tax base and the UK. The section outlines
these connections, where possible attempting to highlight the share of Irish tax receipts
arising from the links. Some are direct (e.g., such as Irish businesses exporting to the
UK), while other are more indirect and harder to quantify (such as taxpayers based in
border counties where some portion of their trade may depend on the UK).
3.1 Businesses in the Border Counties
Figure 10 shows the tax receipts, for the main taxheads, paid by businesses based in the
border counties.17 Beyond taxes paid by businesses in the border counties, about 10 per
cent of Stamp Duty transactions on property and over 5 per cent of Capital Acquisitions
Tax transactions are from the border counties.
Figure 10 – Tax Receipts in Border Counties 2016
200 8%
€ Million
175 7%
150 6%
125 5%
100 4%
75 3%
50 2%
25 1%
0 0%
VAT PAYE Self Employed Corporation Tax Capital Gains
Cavan Donegal Leitrim Louth Tax
Monaghan Sligo % of All Counties
Source: Revenue data. Note: VAT is VAT internal only; PAYE includes both Income Tax and USC for PAYE cases;
Self-Employed is both Income Tax and USC for self-assessed cases. County is based on the primary location of
the business on Revenue records, but a business may be located in one county and conduct some or much of its
trade in other counties, or have multiple locations.
The largest receipts are in PAYE (including both Income Tax and Universal Social Charge
(USC) for PAYE cases. This reflects that there are 230,000 employments by 16,700
employers in these cases in 2015. Table 6 gives more detail on the employer numbers
categorised by their number of employees and Table 7 shows the numbers of employees
for those same employers.
17
Sligo is included due to its close proximity to NI even though it does not share a border.
16 Statistics & Economic Research BranchJuly 2017
Table 6 – Border Counties – Numbers of Employers 2015
1 2 to 9 10 to 49 50 to 249 250+ All
employees employees employees employees employees employers
Cavan 722 1,350 376 81 13 2,542
Donegal 1,231 2,495 975 160 20 4,881
Leitrim 277 531 133 28 3 972
Louth 990 2,126 718 132 19 3,985
Monaghan 634 1,223 385 84 11 2,337
Sligo 552 1,018 362 75 12 2,019
All Border Counties 4,406 8,743 2,949 560 78 16,736
Source: Revenue data. Note: Employees reflects number of employments in the year.
Table 7 – Border Counties – Number of Employees 2015
1 2 to 9 10 to 49 50 to 249 250+ All
employees employees employees employees employees employers
Cavan 756 5,450 7,315 7,373 9,353 30,247
Donegal 1,283 10,208 19,183 14,796 11,263 56,733
Leitrim 295 2,144 2,680 2,624 26,761 34,504
Louth 1,038 8,875 14,140 12,278 20,235 56,566
Monaghan 652 4,884 7,586 8,143 6,044 27,309
Sligo 571 4,122 7,448 6,699 5,844 24,684
All Border Counties 4,595 35,683 58,352 51,913 79,500 230,043
Source: Revenue data. Note: Employees reflects number of employments in the year.
Table 8 provides further information on the sector of the employers in border counties.18
While there is variation, Agriculture, Accommodation & food services, Construction and
Wholesale & retail trade are the most important.
Table 8 – Border Counties – Employers by Sector 2015
All
NACE Sector Cavan Donegal Leitrim Louth Monaghan Sligo
Border
Agriculture, forestry & fishing 13% 8% 7% 7% 16% 7% 9%
Industry 7% 6% 7% 8% 9% 6% 7%
Construction 15% 13% 12% 11% 14% 12% 13%
Wholesale & retail trade 20% 19% 19% 21% 21% 17% 20%
Transportation & storage 4% 5% 4% 5% 7% 4% 5%
Accommodation & food service 8% 12% 11% 10% 6% 11% 10%
Information & communication 1% 2% 4% 3% 1% 3% 2%
Financial & insurance activities 2% 1% 2% 2% 1% 1% 1%
Real estate activities 2% 2% 2% 2% 1% 2% 2%
Professional scientific & technical 6% 6% 7% 10% 6% 10% 7%
Administrative & support service 3% 3% 3% 3% 3% 3% 3%
Public administration 1% 1% 2% 1% 1% 1% 1%
Education 4% 5% 6% 4% 3% 6% 4%
Human health & social work 6% 6% 7% 6% 4% 9% 6%
Other services 8% 9% 10% 8% 7% 9% 8%
Total (per county) 100% 100% 100% 100% 100% 100% 100%
Source: Revenue data. Note: Employees reflects number of employments in the year.
18
There are other businesses operating in these counties, without employees. The CSO Business Demography
series uses Revenue data and others sources to present more detailed breakdowns of businesses in Ireland.
17 Statistics & Economic Research BranchJuly 2017
3.2 Businesses Trading with the UK
3.2.1 Excisable Products
Irish traders can import excisable products from the UK and other EU countries through
either a duty suspended regime or a non-duty suspended regime (i.e., non-warehouse).
Table 9 shows a summary of the duty suspended movements of excisable products
(alcohols, oils and tobacco) in 2015. A total of 56,149 duty suspended movements arrived
into Ireland from EU member states, with the UK accounting for 86 per cent. For excisable
products received or produced under the duty suspended regime, Table 10 shows the level
of importation and the receipts (Excise Duty) collected. A significant proportion is received
into Dublin. As indicated by Table 9, the majority of the imports originate from the UK,
which could indicate either a UK warehouse source or that the UK is used as a landbridge
in the transportation of these goods from warehouses located in other member states.
Table 9 – Duty Suspended Movements of Excisable Products 2015
Importers UK Rest of EU Total % UK
Arrivals to Ireland 168 48,125 8,024 56,149 86
Dispatches from Ireland N/A 20,115 25,453 45,568 44
Total 68,264 33,477 101,741 67
Source: Revenue data.
Table 10 – Duty Suspended Receipts from Excisable Products 2016
Percentage Excise Duty €m
Home Imports Home Imports
Beer 72% 28% €309.52m €120.37m
Spirits 41% 59% €138.58m €199.43m
Wine 4% 96% €15.21m €365.08m
Cider 86% 14% €51.00m €8.30m
Tobacco 0% 100% €0.0m ~€1.1 billion
Oils 20% 80% €450.8m ~€1.7 billion
Source: Revenue data.
For non-duty suspended products an Excise Duty Entry (EDE) form is required where
excisable products are imported into Ireland. Table 11 shows the number of importers, the
EDEs processed and the Excise Duty liable on these goods. In 2016, the UK accounts for
over 70 per cent of all Excise Duty paid. This equates to around 10 per cent of the total
alcohol supply and around 4 per cent of oil consumed in the State.
Table 11 – Non-Duty Suspended Excisable Products 2016
Importers Number of EDEs Excise Duty €m
Rest of EU UK Rest of EU UK Rest of EU UK
Alcohol 176 61 3,393 2,979 101.4 101.7
Oils 17 23 248 13,237 0.5 132
Tobacco 2 1 30 3 0.8 0
Source: Revenue data. Note: Based on EDEs only.
18 Statistics & Economic Research BranchJuly 2017 In the supply of alcohol, the number of EDEs arising from the UK is comparable with the total number processed from all other EU 26 member states combined but the number of importers is 3 times greater for the rest of the EU.19 There are close to 60 transactions received from the UK every week in 2016 from 61 different importers. There is also a greater variety in the types of alcoholic goods supplied from the UK. Over recent years the Excise Duty from alcoholic products from other EU states has risen steadily while the UK has remained relatively flat. With the fall in Sterling, Excise Duty increased significantly post the Brexit referendum, indicating the quantity of alcohol sourced from the UK has risen although the number of shipments remained stable. The volume of EDEs processed for oils is significantly higher than those for alcoholic goods with the vast majority originating from a UK destination. The UK accounts over 99 per cent of Excise Duty on oil that is imported on EDEs, with an average of 50 transactions processed every day. This compares with less than 1 transaction on average per day from the other EU members. 3.2.2 Distance Sales and Cross Border Suppliers Under EU regulations, businesses supplying goods online or by other distance sales channels are required to register for VAT in each EU member states where the value of their supplies exceeds a specific threshold.20 The residence country of the supplier and the value of these goods can be estimated in certain instances, although due to data limitations a complete picture is not available. The UK supplies a significant proportion of all goods sourced using online channels from outside Ireland (Table 12). The market share of the UK has increased. However, many UK traders have operations within Ireland and some online supplies are provided through these outlets instead. 19 SADs indicate a negligible volume of transactions on the importation of alcoholic goods in 2016 from third countries (countries outside the EU). 20 Where the total value of supplies by an EU trader (VAT exclusive) exceeds €35,000 in a calendar period. 19 Statistics & Economic Research Branch
July 2017

                   Table 12 – Distance Selling Traders Registered in Ireland
         Year          Number of        Number of Other       Value of UK               UK Traders’ Share of
                       UK Traders         EU Traders        Trader Supplies              Value of Supplies
         2013             184                 84                  €159m                        36%
         2014             205                114                  €228m                        40%
         2015             228                138                  €263m                        47%
         2016             249                154                  €333m                        52%
                                            Source: Revenue data.

3.2.3 Telecommunications, Broadcasting and Electronic Services

Under an EU scheme in effect from 2015 governing the place of supply of
telecommunications, broadcasting and electronic services, data are provided on consumer
demand for these services.21 Extracted from these data is the country where the consumer
of these services resides, along with the VAT that is liable on these supply.

Irish consumers source such services across 27 EU member states. In 2016 the UK
supplies 18 per cent of the total value of these services with an approximate VAT exclusive
value of €100 million (the total value of these services supplied to Irish consumers in 2016
is in the region of €550 million). Businesses in Ireland also supply these services across 27
EU member states. The value of these services supplied to EU consumers in 2016 is in the
region of €2.4 billion. As shown in Figure 11, the UK is a significant market of consumers,
accounting for over 30 per cent of the total value of these supplies each year from 2015 to
present. This is followed by Germany (18 per cent) and France (15 per cent).

Figure 11 – Supply of Telecommunications, Broadcasting and Electronic Services

                                               Source: Revenue data.

21
     A number of non-EU companies that do not have a physical presence in Ireland are included in these data.

20                                                                     Statistics & Economic Research Branch
July 2017
3.2.4 Non-Irish Registered Traders
In addition to traders registering in Ireland to supply goods to Irish consumers through
distance sales channels (Section 3.2.2), traders from other countries also transact with
Irish consumers from within Ireland and register in the Republic. The number of UK
traders relative those from other EU member states is provided in Table 13. Within this
selection, the numbers of UK traders is higher than those of any other country.
Table 13 – Non-Irish Traders VAT Registered in Ireland
Year Number of Number of Other UK Traders’ Share of
UK Traders EU Traders Value of Supplies
2013 2,483 541 75%
2014 2,396 538 78%
2015 2,325 553 72%
2016 2,345 617 74%
Source: Revenue data.
There are also a number of Irish VAT registered traders with a direct connection to NI
(close to 2,500 identified in 2016). The majority (over 70 per cent) operate within the
construction industry or in activities linked to construction.
3.2.5 Businesses Importing and Exporting
Through the VAT Information Exchange System (VIES) and Intrastat returns, of the
240,000 VAT registered traders in Ireland, those that register to import or export goods or
services that are zero rated to a business in the UK or other EU member states are
identified on Revenue records.22
In 2015 there are approximately 12,000 Irish traders exporting goods and/or services to
the UK, with an estimated value of these exports of €33 billion. These traders directly
employ over 680,000 people.
Around 1,600 of the UK exporting businesses are based in border counties, they employ
49,400 people and 52 per cent of their EU exports go to the UK at a value of €2.2 billion
(Table 14). Of all business sectors located in border counties, close to 9 per cent are
involved in the export industry. The remaining 10,000 businesses exporting to the UK are
in non-border counties, they employ 630,000 people and less than 30 per cent of their EU
exports are to the UK market at a total value of around €30 billion.
22
See http://www.revenue.ie/en/vat/goods-and-services-to-and-from-abroad/acquisitions-from-other-eu-
member-states/what-are-vies-and-intrastat.aspx.
21 Statistics & Economic Research BranchJuly 2017
Table 14 – UK Exporters in Border Counties – Number of Employees 2015
1 2 to 9 10 to 49 50 to 249 250+ All
employees employees employees employees employees employers
Cavan 11 348 1,478 3,008 2,792 7,637
Donegal 41 1,049 3,795 4,159 2,851 11,895
Leitrim 3 59 564 377 407 1,410
Louth 25 804 3,201 4,431 4,262 12,723
Monaghan 24 853 2,479 4,274 2,324 9,954
Sligo 6 210 793 2,156 2,597 5,762
All Border Counties 110 3,323 12,310 18,405 15,233 49,381
Value of Exports (€m) 19 294 351 896 703 2,264
Source: Revenue data. Note: Employees reflects number of employments in the year.
A number of these businesses have a large reliance on the UK as their primary export
market for their goods and services. Classifying these businesses according to the
proportion of goods/services provided to the UK market relative other EU countries
provides an indicator for measuring this level of exposure. The majority of traders in
Ireland involved in the export of goods and services into the EU can be classified as having
greater than 80 per cent reliance on the UK market for their EU exports.
Based on VIES data, there are approximately 100,000 Irish based businesses importing
goods and/or services from the EU, with 90,000 importing from the UK. In 2015 the value
of goods imported from the UK is €18 billion while services of €14 billion. This compares
against €18.5 billion of goods for the other EU member states and €50 billion of services.
Of these UK importers, 14,000 are based in the border counties with 70 per cent of their
EU imports from the UK (valued at €2 billion). The remaining 76,000 businesses importing
from the UK are based in non-border counties, with less than 30 per cent of their imports
from the UK (valued at €30 billion).
Table 15 – UK Importers in Border Counties 2015
Businesses Importing UK Imports Other EU Imports
Number € billion € billion
Cavan 2,027 0.35 0.18
Donegal 4,670 0.71 0.11
Leitrim 904 0.03 0.07
Louth 3,226 0.38 0.29
Monaghan 2,166 0.34 0.15
Sligo 1,490 0.20 0.08
All Border Counties 14,483 2.02 0.89
Source: Revenue data.
On the UK leaving the EU, third country rules and procedures will likely apply. Businesses
trading outside the EU complete a Single Administrative Document (SAD) for goods
22 Statistics & Economic Research BranchJuly 2017
arriving or departing the EU.23 Revenue processed around 736,200 SADs in 2016.24 It is
clear from this analysis, that UK trade has the potential to greatly increase the numbers.
3.3 Multinational Companies Exposed to the UK Economy
Multinational companies and companies in Revenue’s Large Cases Division are significant
contributors to the Irish Exchequer.25 Foreign owned affiliates in Ireland employ 306,000 in
Ireland in 2015, with 27 per cent being UK owned (CSO). Irish owned foreign affiliates in
2014 employ over 300,000 people globally, 28 per cent in the UK. Foreign turnover
amounts to nearly €100 billion with 38 per cent in the UK.
Given the globalised nature of these businesses, their potential exposure to changes
following Brexit could have implications for the Irish tax receipts.
From VIES data, around 7 per cent of companies in Ireland export to the UK. Figure 12
shows the share of companies by sector. The tax associated with these companies is
approximately €2.7 billion in Corporation Tax in 2014 (from €4.4 billion in total
Corporation Tax receipts from all companies in that year) and €6.9 billion in employment
related taxes (from a total of €12.6 billion from all companies).
Figure 12 – Share of Companies Exporting to UK by Sector 2014
All Companies 7%
Manufacturing 23%
Transportation 16%
Wholesale & retail trade 12%
Information & comm. 11%
Mining 11%
Professional & scientific 9%
Administration 8%
Agriculture 4%
Public admin & defence 3%
All other activities 3%
Construction 2%
Finance 1%
Real estate 1%
Accommodation & food 0%
0% 5% 10% 15% 20% 25%
Source: Revenue data.
Figure 13 shows the share of companies exporting to the UK compared to other EU
member states. While the number of linkages to the UK is high, the proportion and value
23
See http://www.revenue.ie/en/customs-traders-and-agents/index.aspx.
24
With Revenue’s risk rating system, over 87 per cent passed through customs, 10 per cent had a paperwork
check and the remaining 2 per cent were stopped for checking. Simplified SADs account for 39 per cent of SADS.
25
See for example: http://www.revenue.ie/en/corporate/documents/research/corporation-tax-returns-2016.pdf.
23 Statistics & Economic Research BranchJuly 2017
of exports in each sector that go to the UK is considerably lower. For Manufacturing,
approximately 24 per cent of the total €36 billion in value of exports in 2014 is destined
for the UK. For Wholesale & Retail and Information & Communications, the shares of total
values of sectoral exports to the UK are slightly higher at 27 per cent and 28 per cent.
Figure 13 – Share of Companies Exporting to UK and Other EU by Sector 2014
100%
90%
80%
70%
60% Exporting other
50% 100%
92% 94% 94% Exporting UK
90% 90% 91%
85% 88%
82% 82% 83%
40% 78%
77%
71%
30%
20%
10%
0%
Finance
Administratio
All other activities
Mining
Wholesale & retail
Manufacturing
All companies
Accommodation & food
Agriculture
Construction
Real Estate
Information & comm.
Transportation
Professional & scientific
Source: Revenue data. Public admin & defence
It is important to note that not all tax payments of companies exporting to or operating in
the UK are derived from their UK exports, most of the companies will operate in across
multiple countries including Ireland.
3.4 Farmers
Much of the commentary around potential Brexit impacts for Ireland has focused on the
agricultural sector. This reflects both that significant shares of Irish agricultural exports
are destined for the UK and the integrated nature of processing and supply chains
between Ireland and NI.
Information on imports and exports are shown in Section 2.1. From CSO data, the import
of animal products and by products from the UK to Ireland is 3.8 million tonnes (valued at
€3.7 billion) in 2016, exports from Ireland to UK are 3.5 million tonnes (valued at €4.8
billion). In volume terms (values in brackets), NI accounts for 37 (14) per cent of Irish
exports and 35 (14) per cent of imports. NI is the source for over three quarters of live
animal imports from the UK.26
26
As noted previously, volume measures of trade can be distorted somewhat by light, high value products or
large, low value products. It is notable that within the agricultural sector, the largest Irish export product to the
24 Statistics & Economic Research BranchJuly 2017
Given the potential for Brexit to impact on farmers, it is useful to examine their
contribution to the Irish Exchequer. Revenue has published detailed analysis of farmers in
Ireland from the perspective of tax returns and other data sources. 27 This research shows
there are around 130,000 farmers on Revenue records and their tax payments total
around €350 million in 2015: €84 million in PAYE, €200 million from self-employed cases;
€41 million in Corporation Tax; and €131 million in Capital Gains Tax; with a net VAT
repayment from the sector of €105 million.
An assessment of the links of farming cases with the UK is limited by the data available.
However, Table 16 shows the number of cases and their average gross income by county.
There around 24,000 farming cases in the border counties, the average incomes in all of
these counties are below the national average.
Table 16 – Farming Cases 2014
Average Gross Income
County Number of Cases
€
Carlow 2,367 46,012
Cavan 4,584 41,300
Clare 5,406 42,547
Cork 16,732 48,046
Donegal 6,453 32,483
Dublin 2,989 57,161
Galway 9,337 41,600
Kerry 7,101 42,245
Kildare 3,795 53,928
Kilkenny 4,235 49,170
Laois 2,806 45,311
Leitrim 2,274 38,661
Limerick 5,887 48,481
Longford 2,032 42,758
Louth 1,940 41,320
Mayo 7,462 38,135
Meath 5,223 47,258
Monaghan 4,908 34,542
Offaly 3,004 43,996
Roscommon 4,208 41,209
Sligo 2,914 40,699
Tipperary 9,808 44,329
Waterford 3,642 47,394
Westmeath 3,757 44,954
Wexford 5,873 42,282
Wicklow 2,447 43,787
Total 131,587 43,735
Source: Revenue data.
UK by tonnage is forestry products.
27
Available at: http://www.revenue.ie/en/corporate/information-about-revenue/research/statistical-
reports/index.aspx.
25 Statistics & Economic Research BranchJuly 2017 4 Conclusion The UK is Ireland’s largest trading partner, purchasing 19 per cent and 13 per cent of Irish services and goods exports respectively and the source of 8 per cent of services imports and 23 per cent for goods. For the twelve national roads crossing the border, in 2016 there are over 14 million vehicles entering Ireland from NI (or nearly 40,000 per day). With only around 15,000 residents of either jurisdiction in employment or education on the other side of the border, it is clear that trade accounts for significant shares of the cross border movements. There are further movements by port and airport between the two countries, which may pose customs challenges following Brexit. Businesses in the border counties employ around 230,000 people and contribute approximately 5 per cent of receipts for most taxes. In 2015 there are around 12,000 Irish traders exporting goods and/or services to the UK. Approximately 90,000 Irish based businesses import goods and/or services from the UK. The analysis shows there are relatively small numbers of traders exporting goods and/or services but their level of activity is quite significant, while the numbers involved in the importation of goods is significantly higher and spans a wider range of business sectors. The analysis shows widespread linkages between Irish and UK economies. Links to NI are more limited but also more highly concentrated in specific areas or sectors. Brexit will not eliminate these linkages (or their contributions to the Exchequer) but it may well diminish or change them. This analysis indicates the potential scale and range of the outcome. Follow up research could include the following: using scenario/sensitivity analysis of impacts (or tax at risk) on the tax base of different Brexit scenarios; further analysis and assessment of the landbridge element of Irish trade and freight movements between Ireland and the UK; and more in-depth profile of the border areas. 26 Statistics & Economic Research Branch
You can also read