IRELAND'S OCEAN ECONOMY - AGECON SEARCH
←
→
Page content transcription
If your browser does not render page correctly, please read the page content below
Ireland’s
Ocean
Economy
IRELAND’S OCEAN ECONOMY

    Authors:
    Amaya Vega
    Stephen Hynes

    For further information please contact:

    Dr. Amaya Vega
    Socio-Economic Marine Research Unit (SEMRU)
    Whitaker Institute of Innovation and Societal Change,
    National University of Ireland, Galway
    Office: +353(0)91 49 5679
    Email: amaya.vega@nuigalway.ie
    Web: http://www.nuigalway.ie/semru/

    Acknowledgements
    The authors would like to thank Gerard Doolan, Andrew Murray and Barry Sobey (Central Statistics Office), Liam Lacey and
    Edel O’Connor (Irish Maritime Development Office), Nessa Skehan (Fáilte Ireland), Emmet Jackson, John Dennis, Caitríona
    McCarthy and Michael Keatinge (BIM), Rebecca Corless (NUIG) and Jenny O’Leary (Marine Institute).

    Finally, we would like to thank all the companies that kindly gave their time to complete the SEMRU Marine Enterprise Survey.

    SEMRU
    The main research focus of the Socio-Economic Marine Research Unit (SEMRU) at NUI Galway involves examining the
    economic utility of the marine environment (e.g. transportation, recreation) and ecological value (e.g. fisheries, aquaculture)
    derived from the productivity of associated ecosystems. The coastal and contiguous marine environment surrounding Ireland
    and the EU in general provides the geographical focus for the research of the unit. Consideration of the human dimension in
    the management of marine ecosystems is also a critical component of all research projects within the unit.

    SEMRU has been commissioned under the Marine Research Sub-Programme PBA/SE/16/01 to report on the performance
    of Ireland’s ocean economy. The focus is not only on continuing to collect reliable and comparable marine socio-economic data
    across all the marine sectors, but also to satisfy one of the specific core tasks for SEMRU, namely to develop a methodology
    which will provide reliable estimates of the economic contribution of the marine sector and its growth over time.

    This work was carried out with the support of the Marine Institute and it is funded by the Marine Research Sub-Programme
    PBA/SE/16/01 Valuing and understanding the dynamics of Ireland’s Ocean Economy.

    For a full breakdown on the recent research outputs of SEMRU go to www.nuigalway.ie/semru/publications.html

    Photographs courtesy / copyright:
    Malcolm McGettigan; Pauhla McGrane; Marine Institute; SEMRU

    Dedication
    Dedicated to the memory of friend and NUIG colleague Dr. Richard Fitzgerald who passed away on December 5th, 2016;
    a man with a passion for all things marine.

i
Table of Contents
Executive Summary                                    1

Introduction                                         4

Direct and Indirect Gross Value Added                7

International Comparison                             9

A Profile of Ireland’s Ocean Economy                 11

Established Marine Industries                        19

Shipping and Maritime Transport                      21

Tourism and Leisure in Marine and Coastal Areas      24

International Cruise Industry                        26

Marine Retail Services                               28

Sea Fisheries                                        30

Marine Aquaculture                                   32

Seafood Processing                                   34

Oil and Gas Exploration and Production               36

Marine Manufacturing, Construction and Engineering   38

Emerging Marine Industries                           41

Advanced Marine Products and Services                43

Marine Commerce                                      45

Marine Biotechnology and Bioproducts                 47

Marine Renewable Energy                              49

A note on Marine Training                            51

Conclusions                                          52

Appendices                                           55

                                                          ii
IRELAND’S OCEAN ECONOMY

     Executive Summary
     Marine socio-economic data are not readily available in Ireland. However, they are essential in determining the value of
     Ireland’s ocean economy, so as to realise its full potential. SEMRU began the extensive task of data collection and analysis of
     Ireland’s ocean economy in 2009. This resulted in the publication of a series of bi-annual ocean economy reports, to which,
     this report is the latest addition. The report provides a quantification and realistic monitoring of Ireland’s ocean economy over
     time and presents a complete and comparable sectoral profile across the ocean economy, which allows us to observe progress
     on the targets set out in the Government’s Integrated Marine Plan for Ireland - Harnessing Our Ocean Wealth (2012).
     The reference year for this report is 2014. The report includes a set of economic projections that forecast Ireland’s ocean
     economy up to 2016. For the first time, this report includes a full 2008-2016 data series illustrating Ireland’s ocean economic
     performance and trends over an eight-year period.

     This report aims to:

     •    Provide a profile of Ireland’s ocean economy for 2014 and 2016;
     •    Provide estimates for turnover, Gross Value Added1 (GVA) and employment for the 2008-2016 period;
     •    Assist in monitoring progress of a number of targets set out in the Government’s Integrated Marine Plan for Ireland -
          Harnessing Our Ocean Wealth (2012);
     •    Provide an overview of the policy environment and outlook of the sector where appropriate;
     •    Revise and update, where necessary, the methodology and data used in previous reports;

     In 2016, Ireland’s ocean economy had a turnover of €5.7 billion. The direct economic value was worth €1.8 billion or
     approximately 0.9% of GDP. Ireland’s ocean economy provided employment for 30,176 FTEs. Compared to 2014, 2016 saw a
     23% increase in turnover, a 20% increase in gross value added (GVA) and a 10% increase in employment.

     The indirect GVA that is generated from ocean related activity in Ireland in 2016 amounts to a €1.57 billion, with a total GVA
     (direct and indirect) of €3.37 billion, which represents 1.7% of GDP.

     This report is divided into two broad types of marine industries:

     The Established Marine Industries in 2016 had a turnover of €5.3 billion and provided employment of 28,231 FTEs
     representing 93% of the total turnover and 94% of total employment in Ireland’s ocean economy. This sector includes
     shipping and maritime transport, tourism and leisure in marine and coastal areas, international cruise, sea fisheries, marine
     aquaculture, seafood processing, oil and gas exploration and production, marine manufacturing, construction and engineering
     and marine retail services.

          Oil and gas exploration and production, marine aquaculture and tourism and leisure in marine and coastal areas
          experienced the largest increase in activity in 2016, with overall turnover, GVA and employment increasing across
          established marine industries in the 2014-2016 period. The oil and gas exploration and production and the seafood
          processing sectors experienced the largest increase in employment.

     The Emerging Marine Industries in 2016 had a turnover of €383 million and provided employment to 1,945 FTEs
     representing 7% of the turnover and 6% of employment in Ireland’s ocean economy. Emerging industries refer to those that
     are still at a relatively early stage of development or growth, and are primarily R&D intensive and/or use the latest cutting
     edge technology in their pursuit of economic growth. Ireland’s ocean economy includes a number of emerging industries
     with considerable growth potential. It includes advanced marine technology products and services, marine commerce, marine
     biotechnology and bio-products and marine renewable energy

     1      Gross value added is the value of output less the value of intermediate consumption and it is a measure of the contribution to GDP made by an individual
            producer, industry or sector.

01
IRELAND’S OCEAN ECONOMY 2016
€
Direct Impact
Employment Turnover % GDP GVA
30,176 €5.71bn 0.9% €1.8bn
Indirect Impact
Total Direct &
Indirect Impact
GVA % GDP GVA
€1.57bn 1.7% €3.37bn
MARITIME
TRANSPORT
SERVICES
13%
Breakdown
TOURISM & 23% 21% 15%
LEISURE IN
MARINE &
30%
COASTAL 37% 23%
SEAFOOD Turnover GVA Employment
(INCLUDING
17% 22% (FTE)
FISHERIES,
AQUACULTURE,
SEAFOOD
PROCESSING) 23% 27% 49%
OTHER SECTORS
Established Marine Industries - Trends 2008-2016
6,000,000.00 1,800,000.00
1,600,000.00
5,000,000.00
TOTAL 1,400,000.00
TURNOVER
(’000s)
4,000,000.00 1,200,000.00 Note: 2008 and 2009 figures
3,000,000.00
1,000,000.00 exclude International Cruise
TOTAL
8000,00.00 GVA
(’000s)
Services, Marine Retail Services
2,000,000.00 600,000.00
and Marine Manufacturing,
400,000.00
1,000,000.00
TOTAL TURNOVER (’000s) Construction and Engineering
200,000.00
TOTAL GVA (’000s)
0.00 0.00
2008 2009 2010 2011 2012 2013 2014 2015 2016
Emerging Marine Industries - Trends 2010; 2012-2016 HOOW Targets
450,000.00 180,000.00
400,000.00 160,000.00
Double the value of
350,000.00 140,000.00
Ireland’s ocean wealth
300,000.00 120,000.00 to 2.4% of GDP by
TOTAL 250,000.00 100,000.00 2030
TURNOVER TOTAL
(’000s) 80,000.00 GVA
200000.00
150,000.00 60,00000
(’000s)
Increase the turnover
100,000.00 40,000.00 from Ireland’s ocean
50,000.00 20,000.00 TOTAL TURNOVER (’000s)
economy to exceed
0.00 0.00
TOTAL GVA (’000s)
€6.4bn by 2020
2010 2012 2013 2014 2015 2016
02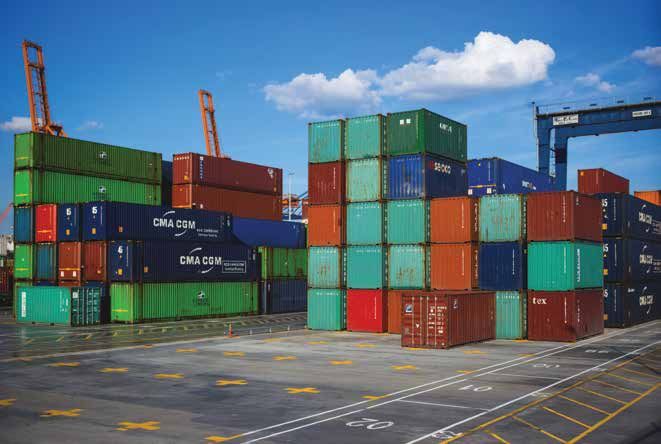
IRELAND’S OCEAN ECONOMY

          All of the emerging industries are excelling in terms of growth. Advanced marine technology products and services and
          marine renewable energy experienced the largest increases in turnover and GVA. Employment rose in all four emerging
          sectors, with an overall 13% increase in the 2014-2016 period.

     The methodology used in compiling this report has built on and progressed from that used in previous reports. To allow for
     comparability across the periods, figures from earlier reports have been revised and updated. See the Appendix for details.

       The Ocean Economy - Definition
       For the purpose of this report, the ocean economy is defined as any economic activity that directly or indirectly uses the sea as an input or produces an
       output for use in a sea-specific activity.

       The coastal economy, on the other hand, represents all economic activity that takes place in the coastal region, for example, agriculture, which is not part of
       the ocean economy.

03
Introduction
The first attempt at quantifying the size of Ireland’s ocean economy was presented in the 2005 publication by the Marine
Institute “Ireland’s Ocean Economy and Resources”2. That initial briefing document provided a profile of Ireland’s ocean
economy in 2003, and explained why, and how, Ireland should seek to develop its marine resources. The Socio-Economic
Marine Research Unit (SEMRU) subsequently published three additional reports on the economic value of Ireland’s ocean
economy in 2010, 2012 and 2015 using 2007, 2010 and 2012 data respectively.
This report builds on these previous works by profiling and analysing Ireland’s ocean economy using 2014 data. For the first
time, the full 2008-2016 data series is published illustrating Ireland’s ocean economic performance and trends over an eight-
year period. As in the previous report and in order to enhance its relevance for policy making, this report presents economic
estimates and projections up to 2016.
The importance of marine socio-economic data collection and analysis has been recognised by the Irish Government in
Harnessing Our Ocean Wealth – an Integrated Marine Plan (IMP) for Ireland. Published in 2012, the IMP presents “the
Government’s vision, high-level goals and integrated actions across policy, governance and business to enable Ireland’s marine
potential to be realised”3.
Harnessing Our Ocean Wealth Targets (Baseline year for targets: 2007)
Double the value of Ireland’s ocean wealth to 2.4% of GDP by 2030
Increase the turnover from Ireland’s ocean economy to exceed €6.4bn by 2020
Source: Government of Ireland, Inter-Departmental Marine Coordination Group (MCG), Harnessing Our Ocean Wealth - An Integrated Marine Plan
(IMP) for Ireland,” July 2012
Table 1: Sectoral targets set out in the Integrated Marine Plan
Sector Ocean Wealth 2020 Target*
Seafood (fisheries, aquaculture, seafood processing) €1,000 million
Maritime Commerce and Ship Leasing €2,600 million
Marine and Coastal Tourism and Leisure (including Cruise Tourism) €1,500 million
Marine ICT and Biotechnology >€61 million
Ports and Maritime Transport Services, Maritime Manufacturing, Engineering, Offshore Oil and Gas, other >€1,200 million
marine industries
Source: Harnessing our Ocean Wealth – An Integrated Marine Plan for Ireland; *Projected Annual Turnover by 2020. Baseline period: 2007
The overarching aim of this report is to assist in policy making by providing a profile of Ireland’s Ocean Economy in the 2008-
2014 period and sector-by-sector economic projections for 2015 and 2016 against which future marine socio-economic data
can be compared. Data is also being provided to support the implementation of the EU Marine Strategy Framework Directive
(MSFD) and Marine Spatial Planning (MSP) in Ireland.
2 O’Connor, J., O’Leary, J. & Shields, Y., ‘Ireland’s Ocean Economy and Resources’, Marine Institute 2005
3 Government of Ireland, Inter-Departmental Marine Coordination Group (MCG), Harnessing Our Ocean Wealth - An Integrated Marine Plan (IMP) for
Ireland,” July 2012
04IRELAND’S OCEAN ECONOMY
The methodology used in compiling this report on Ireland’s ocean economy has built on and progressed from that used in
previous reports. In this report, estimates from the previous published reports have been revised and updated to align our
Ireland’s ocean economy data with the new revised 2008-2014 Central Statistics Office (CSO) data series, which has brought
coherence between the CSO Business Demography (BD) and Structural Business Statistics (SBS) data series and the
National Accounts (Income Method) series for Gross Value Added (GVA). Estimates have also been updated with more up-to-
date information on some of the categories of activity that has become available in the intervening period.
The reference year, or the latest year for which data is available, is 2014. There is a two-year time lag in the release of SBS
from the CSO. However, more up-to-date data is available for some sectors such as Sea Fisheries and Marine Aquaculture.
To allow for a complete and comparable representation of Ireland’s ocean economy across all sectors, the report presents
estimates based on economic projections of Ireland’s ocean economy up to 2016. These estimates are based on forecasting
exercise on the economic performance of a number of sectors on a sector-by-sector basis. The methodology used combines
the latest published economic data from the CSO, government economic forecasts and expert judgement obtained from
interviews with marine-related businesses and relevant government departments and agencies. Details on the methodologies
used for the economic projections are presented in the Appendix.
The substantial growth in Ireland’s ocean economy over recent years is a reflection of the economic recovery that Ireland is
experiencing as well as of an increased level of activity in shipping and maritime transport, the seafood sector, tourism and
leisure in marine and coastal areas and oil and gas production. This latter sector has given an important boost to turnover and
GVA in the Irish ocean economy through the coming on line of the Corrib gas field in December 2015.
05General trends in the Irish economy are inevitably reflected in the ocean economy. However, figures presented in Table 2
suggest that Ireland’s ocean economy keeps performing on average better than the general economy. While growth in Irish
GDP from 2012 to 2014 was approximately 8%, the ocean economy grew by over 19% in the same period. Estimates
suggest that GVA growth rates in Ireland’s ocean economy for the 2014-2016 period are approximately 20%, which is again
above the recently released growth trends from the CSO that show an increase of 9% in Ireland’s GDP for the same period.
Table 2. The Irish Ocean Economy key figures and trends, 2012, 2014 and 2016
2012 2014 % Change 2012-2014 2016 % Change 2014-2016
GVA €1.2 billion €1.5 billion 19% €1.8 billion 20%
% GDP 0.8% GDP 0.85% GDP 0.94% GDP
Turnover €4.7 billion €4.6 billion -2% €5.7 billion 23%
Employment 25,523 FTEs 27,391 FTEs 7% 30,176 FTEs 10%
06IRELAND’S OCEAN ECONOMY
Direct and Indirect Gross Value Added
Under the Beaufort Socio-Economic Award (2008 – 2016), SEMRU in association with colleagues in Teagasc developed
a Bio-Economy Input-Output (IO) model for Ireland which can be used to analyse the linkages between the bio-economy
sectors and the wider economy. As part of the development of the model, the main ocean economy sectors analysed in this
report were disaggregated from the national IO tables. This facilitates examining the wider economic impacts originating
from economic activity that uses marine resources. Input-Output Modelling is a linear modelling approach which involves the
examination of the economic cycle of production by analysing the relative relationship between the flow of production inputs
and resultant flow/destination of produced outputs in an economy4. In essence, an Input-Output model tracks the flow of
activities between sectors and final demand uses.
In this section, the Bio-Economy Input-Output model is used to study the relationship between Ireland’s marine sectors and
the rest of the economy in order to estimate the indirect macroeconomic impact of value added in the ocean economy on the
wider economy. The indirect impact of a marine sector is the value-added generated in other industries supplying inputs to the
marine sector of interest.
Table 3: GVA Multipliers for Marine Sectors from Bio-Economy Input-Output Model
Sector GVA Multiplier
Sea Fisheries 1.31
Aquaculture 1.39
Oil and Gas Exploration and Production 1.53
Seafood Processing 2.26
Marine Manufacturing, Engineering and Construction 2.03
Marine Retail Services 1.44
Shipping & Maritime Transport 2.42
Tourism in Marine and Coastal Areas 1.59
Source: Teagasc SEMRU Bio-Economy IO Model as described in Grealis, E. and O’Donoghue, C. (ed.) (2015). The Bio-Economy Input-Output Model:
Development and Uses, Teagasc Publication, Dublin;
Table 3 presents the estimated GVA multipliers for the disaggregated marine sectors from the Bio-Economy Model. Shipping
and Transport and Seafood Processing provide the largest GVA multipliers across the marine sectors while the lowest GVA
multipliers are witnessed in the primary production sectors namely fishing and aquaculture. Using these multipliers we then
estimate the indirect GVA that is generated from ocean related activity in Ireland in 2016. As shown in table 4 this amounts to
a €1.57 billion indirect effect from Ireland’s ocean economy activity and a total GVA (direct and indirect) of €3.37 billion.
4 Grealis, E. and O’Donoghue, C. (ed.) (2015). The Bio-Economy Input-Output Model: Development and Uses, Teagasc Publication, Dublin
07Table 4: Direct and Indirect GVA, 2016
Sector Direct GVA (€’000) Indirect GVA (€’000) Direct and Indirect GVA
(€’000)
Shipping & Maritime Transport 533,151 757,074 1,290,225
Tourism in Marine and Coastal Areas 489,646 288,891 778,537
International Cruise 9,765 5,761 15,526
Marine Retail Services 63,889 28,111 92,000
Sea Fisheries 187,000 57,970 244,970
Marine Aquaculture 71,533 27,898 99,431
Seafood Processing 140,457 176,976 317,433
Oil and Gas Exploration and Production 71,674 37,987 109,661
Marine Manufacturing, Construction and Engineering 70,989 73,119 144,108
Marine Advanced Technology Products and Services 60,632 62,451 123,083
Maritime Commerce 41,763 18,376 60,139
Marine Biotechnology and Bioproducts 16,989 17,499 34,488
Marine Renewable Energy 38,099 20,192 58,291
Total 1,795,587 1,572,305 3,367,892
Harnessing Our Ocean Wealth (HOOW) – An Integrated Marine Plan for Ireland, published in July 2012, set out an
overarching target to double the value of Ireland’s ocean economy to 2.4% of GDP by 2030. This 2.4% figure was based on a
total GVA estimate (both direct and indirect) in 2007 for the Irish Ocean economy that amounted to 1.2% of GDP at that time.
The total direct and indirect value of the Irish ocean economy is estimated here to be €3.37 billion which represents 1.7% of
total GDP in 2016. This would suggest that HOOW is moving steadily towards its 2030 target.
08IRELAND’S OCEAN ECONOMY
International Comparison
European policies such as the Integrated Maritime Policy (IMP) for the European Union, the Blue Growth Strategy, etc.
have recognised the importance of economic data to inform future decision making, management and regulation of marine
sectors. European policy, such as the IMP, emphasizes the need for economic and social information on maritime affairs in
its objectives. These include the construction of a decision-making framework, involving national and local authorities and
stakeholders in maritime and coastal areas. Many countries, both in the EU and globally, now compile ‘marine/ocean’ sector
accounts and produce ocean economy reports similar to this one, making international comparisons possible. However, the
definitions used are not always directly comparable.
Table 5: International Comparisons
Country Year Direct Ocean GDP % National GDP % National Employment
(€ billions)
USA* 2013 262.28 2.17 2.2
Canada* 2006 12.42 1.2 1.1
Iceland*1 2010 0.88 10.2 5.1
South Korea^ 2014 30.35 3.02 2.8
China^2 2016 571 5.8 4.7
United Kingdom* 2006 67.62 4.2 3
New Zealand* 2013 2.48 1.9 1.3
France^ 2013 35.5 1.73 1.7
Ireland 2016 1.8 0.9 1.5
Australia*^ 2014 28.52 2.7 2.1
*Figures from official national reports, ^ Figures from communications with national representatives,
Sources: UK: Socio-economic indicators of marine-related activities in the UK economy, https://www.thecrownestate.co.uk/media/5774/socio_economic_
uk_marine.pdf, Canada: Economic Impact of Marine Related Activities in Canada, http://www.dfo-mpo.gc.ca/ea-ae/cat1/no1-1/no1-1-summary-eng.
htm, Iceland: http://skjol.islandsbanki.is/servlet/file/store156/item110209/Sjavarklasinn_Skyrsla-enska-low.pdf, NZ: http://www.stats.govt.nz/browse_
for_stats/environment/environmental-economic-accounts/nz-marine-economy-2007-13.aspx, USA: State of the U.S. Ocean and Coastal Economies - 2016
Update, http://www.oceaneconomics.org/Download/, Australia: The AIMS Index of Marine Industry, http://www.aims.gov.au/docs/media/latest-news/-/
asset_publisher/EnA5gMcJvXjd/content/australia-s-burgeoning-blue-economy-
1. Data for Iceland is only for the fisheries sector
2. The direct GVA figure for China is based on the portion of total Gross Ocean Product that is referred to as “marine industries”.
Table 5 provides a comparison of figures from a number of ocean economy studies around the world. The highest share of direct
ocean economic activity in national GDP can be seen for countries such as China, Iceland and the UK. Similar to the case in
Ireland, shipping and maritime transport and tourism in marine and coastal areas are key marine sectors in terms of contribution
to economic value and employment in the USA, Canada, UK, France and Australia. For South Korea and China shipbuilding and
fisheries are also important in terms of contribution to their ocean economies while the wild fishing sector is one of the most
important sectors in terms of employment and output in Iceland. Oil and Gas is also a key sector for many of these countries and
particularly in the case of the USA and the UK. At the European level it has been estimated that the ocean economy represents
approximately 5.4 million jobs and generates a gross added value of approximately €500 billion per annum across the EU5.
5 https://ec.europa.eu/maritimeaffairs/policy/blue_growth_en
09While it is interesting to compare the ocean economy across the different countries it should be noted that the structural
composition of the industries in each case differ. For example, the Irish ocean economy figures do not include marine related
public sector output such as naval defence services, publicly funded research or education. This is included in the estimated
figures in Table 5 for France, Canada, the UK, New Zealand and South Korea. An area for future research therefore is to
develop ocean economy statistics related to output from the Irish public sector.
The EU Interreg IV (Priority 1) project MARNET (Marine Atlantic Regions Network) brought together eight partners across
the five European Atlantic Arc countries – France, Ireland, Spain, Portugal and the United Kingdom. A primary aim of the
project was to develop a framework for the collection of marine socio-economic data across the participating countries.
The framework developed a comparable and replicable data collection methodology using available data sources. To ensure
consistency among countries, Eurostat statistical classifications were used – NUTS (Nomenclature of Territorial Units for
Statistics) for the spatial dimension and NACE codes for the sectoral dimension of the data. The figures presented in this
report have also adhered to the principles of the MARNET framework6.
6 Foley, N., Corless, R., Escapa, M., Fahy, F., Fernandez-Macho, J., Gabriel, S., Gonzalez, P., Hynes, S., Kalaydjian, R., Moreira, S., Moylan, K., Murillas, A., O’Brien,
M., Simpson, K., and Tinch, D. (2015). Developing a Comparative Marine Socio-Economic Framework for the European Atlantic Area, Journal of Ocean
and Coastal Economics, 14, Article 3.
10IRELAND’S OCEAN ECONOMY
A Profile of Ireland’s Ocean Economy
Ireland’s ocean economy had a turnover7 of €4.6 billion in 2014, of which €1.5 billion was direct gross value added (GVA)8.
The Irish Marine sector employed 27,391 FTEs. Ireland’s total Gross Domestic Product (GDP) in 2014 was approximately
€175 billion. The GVA from marine economic activity is approximately 0.9% of national GDP. In 2016 Ireland’s ocean economy
had an estimated turnover of €5.7 billion and provided estimated employment to 30,176 FTEs.
The established industries in Ireland’s ocean economy account for 94% of total marine turnover. This category is dominated by
shipping and maritime transport and tourism and leisure in marine and coastal areas (Table 6). Shipping and maritime transport
was the largest contributor in terms of turnover and value added in 2014. Tourism and leisure in marine and coastal areas is
the next largest category overall and is the largest contributor in terms of employment.
Within the emerging marine industries, marine commerce and marine advanced technology make the largest contribution in
terms of turnover and value added. The marine advanced technology products and services category along with the marine
biotechnology sector is also an important category in terms of employment.
7 Turnover is the value of sales
8 GVA refers to a sector’s turnover (output) minus intermediate consumption (the inputs into the production process). It is measured at basic prices,
excluding taxes less subsidies on products.
11Table 6: Direct Turnover, GVA and Employment by sector, 2014
2014 Direct Turnover € Millions Direct GVA € Millions Direct Employment (FTEs)
Established Industries
Shipping & Maritime Transport 1,945.46 488.50 4,375
Tourism in Marine and Coastal Areas 984.58 396.53 13,865
International Cruise 24.30 9.79 …
Marine Retail Services 152.63 60.05 743
Sea Fisheries 311.90 168.10 2,395
Marine Aquaculture 116.30 49.16 941
Seafood Processing 517.05 135.21 2,360
Oil and Gas Exploration and Production 199.64 23.96 85
Marine Manufacturing, Construction and Engineering 121.00 64.96 906
Established Industries Sub-Total 4,372.85 1,396.26 25,670
Emerging Industries
Marine Advanced Technology Products and Services 80.07 36.11 561
Marine Commerce 138.45 42.17 322
Marine Biotechnology and Bio-products 29.51 4.63 436
Marine Renewable Energy 26.89 15.40 401
Emerging Industries Sub-Total 274.92 98.30 1,720
Total 4,647.77 1,494.56 27,391
Tables 7-9 show the direct turnover, GVA and employment by sector from 2008 to 2016. Estimates for the 2014-2016 period
suggest an overall increase in turnover of 23% to €5.7 billion, with an increase in GVA and employment of 20% and 10%
respectively in the 2014-2016 period.
Turnover in the traditional, established marine industries fell from €4.5 billion to €4.4 billion in the 2012-2014 period.
This represented a 3% reduction, which was mainly driven by shipping and maritime transport, oil and gas production and
exploration and marine aquaculture. Employment in the established industries category rose from 24,324 FTEs in 2012 to
25,670 in 2014, an increase of 5.5%. Estimates for the established marine industries suggest that in 2016, turnover increased
to €5.3 billion, an increase of 22% on 2014. Estimates show an increase of 17% in GVA to €1.6 billion and an increase of
nearly 10% in employment to 28,231 FTEs in the established industries in the 2014-2016 period (See Tables 7-9).
Turnover of firms in the emerging marine industries increased from €218 million to €274 million in the 2012-2014 period, an
increase of 26%. Employment in the emerging industries category experienced an increase of 43%, while GVA decreased
by 15%. In Tables 7-9, estimates for the 2014-2016 period suggest that established trends are likely to continue with an
estimated increase in turnover, GVA and employment, of 39% to €383 million, 60% to €157 million and 14% to 1,945 FTEs,
respectively.
12IRELAND’S OCEAN ECONOMY
Table 7: Direct Turnover by sector (Euro Million), 2008-2016
Direct Turnover (€ millions) % Change
2012 2014
2008 2009 2010 2011 2012 2013 2014 2015 2016
-2014 -2016
Established Markets
Shipping and Maritime 2,065.22 3,078.48 1,684.81 1,722.46 2,247.40 1,636.86 1,945.46 2,081.64 2,123.27 -13% 9%
Transport
Marine Tourism and 961.05 948.41 1,003.38 864.47 775.75 890.83 984.58 1,157.31 1,304.29 27% 32%
Leisure
International Cruise … … 21.66 21.44 20.83 25.72 24.30 27.00 25.94 17% 7%
Industry
Marine Retail Services … … 57.69 … 119.23 109.50 152.63 158.58 162.38 28% 6%
Sea Fisheries 225.20 168.30 187.80 235.30 268.90 276.40 311.90 244.17 279.80 16% -10%
Aquaculture 94.30 106.60 122.50 128.50 130.30 117.72 116.30 148.66 167.17 -11% 44%
Seafood Processing 467.78 472.09 470.22 530.69 535.49 576.84 517.05 548.07 537.11 -3% 4%
Oil and Gas Exploration 346.14 279.37 212.59 205.11 229.88 215.73 199.64 186.06 597.28 -13% 199%
and Production
Marine Manufacturing … … 110.81 … 199.08 164.91 121.00 128.64 132.23 -39% 9%
Construction and
Engineering
Established Markets 4,159.69 5,053.25 3,871.46 3,707.97 4,526.86 4,014.51 4,372.86 4,680.13 5,329.47 -3% 21%
Sub-Total
Emerging Markets
Advance Marine Products 55.92 71.28 74.03 80.07 90.94 139.68 12% 74%
& Services
Marine Commerce 53.60 86.56 108.18 138.45 134.55 140.73 60% 2%
Marine Biotechnology and 29.87 44.51 46.40 29.51 39.61 43.61 -34% 48%
Bio-products
Marine Renewable Energy 11.54 15.83 18.75 26.89 29.03 59.00 70% 119%
Emerging Markets 150.93 218.17 247.35 274.92 294.13 383.02 26% 39%
Sub-Total
Total 4,022.39 4,745.03 4,261.85 4,647.77 4,974.26 5,712.49 -2% 23%
13Table 8: Direct GVA by sector (Euro Millions), 2008-2016
Direct GVA (€ millions) % Change
2012 2014
2008 2009 2010 2011 2012 2013 2014 2015 2016
-2014 -2016
Established Markets
Shipping and Maritime 542.17 271.79 416.25 433.97 374.59 467.31 488.50 522.70 533.15 30% 9%
Transport
Marine Tourism and 384.77 326.29 289.52 316.06 329.92 357.49 396.53 434.47 489.65 20% 23%
Leisure
International Cruise … … 6.25 7.84 8.86 10.32 9.79 10.14 9.76 10% 0%
Industry
Marine Retail Services … … 33.91 … 34.56 33.37 60.05 62.39 63.89 74% 6%
Sea Fisheries 128.70 60.70 65.00 105.10 142.60 134.70 168.10 114.00 187.00 18% 11%
Aquaculture 27.70 33.20 46.20 53.30 60.60 31.19 49.16 81.85 71.53 -19% 46%
Seafood Processing 92.90 109.15 121.36 140.23 126.71 127.86 135.21 143.32 140.46 7% 4%
Oil and Gas Exploration 42.00 33.90 25.80 24.89 27.89 26.18 23.96 22.33 71.67 -14% 199%
and Production
Marine Manufacturing … … 44.00 … 32.83 46.72 64.96 69.06 70.99 98% 9%
Construction and
Engineering
Established Markets 1,218.24 835.03 1,048.28 1,081.39 1,138.57 1,235.12 1,396.26 1,460.25 1,638.10 23% 17%
Sub-Total
Emerging Markets
Advance Marine Products 20.81 38.61 43.55 36.11 38.11 60.63 -6% 68%
& Services
Marine Commerce 31.81 49.17 49.91 42.17 41.63 41.76 -14% -1%
Marine Biotechnology and 12.99 18.76 19.67 4.63 13.91 16.99 -75% 267%
Bio-products
Marine Renewable Energy 3.65 8.65 11.95 15.40 18.68 38.10 78% 147%
Emerging Markets 69.26 115.18 125.07 98.30 112.33 157.48 -15% 60%
Sub-Total
Total 1,117.53 1,253.75 1,360.19 1,494.56 1,572.58 1,795.59 19% 20%
14IRELAND’S OCEAN ECONOMY
Table 9: Direct Employment by sector, 2008-2016
Direct Employment (FTEs) % Change
2012 2014
2008 2009 2010 2011 2012 2013 2014 2015 2016
-2014 -2016
Established Markets
Shipping and Maritime 5,238 4,434 4,092 3,684 3,933 4,336 4,375 4,492 4,666 11% 7%
Transport
Marine Tourism and 14,969 13,146 12,562 12,753 13,003 13,439 13,865 13,946 14,891 7% 7%
Leisure
International Cruise … … … … … … … … … … …
Industry
Marine Retail Services … … 252 … 590 613 743 781 790 26% 6%
Sea Fisheries 3,404 3,692 3,479 2,688 2,709 2,717 2,395 2,522 2,536 -12% 6%
Aquaculture 1,287 976 952 958 956 956 941 988 1,030 -2% 9%
Seafood Processing 1,855 1,892 1,975 2,013 2,174 2,226 2,360 2,976 3,029 9% 28%
Oil and Gas Exploration 99 74 57 64 84 83 85 90 265 1% 212%
and Production
Marine Manufacturing … … 726 … 875 953 906 971 1,023 4% 13%
Construction and
Engineering
Established Markets 24,094 22,160 24,324 25,323 25,670 26,766 28,231 6% 10%
Sub-Total
Emerging Markets
Advance Marine Products 391 420 437 561 574 695 33% 24%
& Services
Marine Commerce 110 161 165 322 339 342 100% 6%
Marine Biotechnology and 304 373 406 436 482 453 17% 4%
Bio-products
Marine Renewable Energy 216 245 276 401 432 454 64% 13%
Emerging Markets 1,021 1,199 1,284 1,720 1,827 1,945 44% 13%
Sub-Total
Total 25,115 25,523 26,607 27,391 28,594 30,176 7% 10%
15Figures 1 and 2 show the general trend in direct turnover, GVA and employment respectively for established and emerging
marine industries in the 2008-2016 period. Overall the established sectors experienced a fall in activity between 2009 and
2012, reflecting the economic downturn. Between 2013 and 2016, there has been a general increase in economic activity,
which in some sectors has been quite significant. Sectoral details on these trends are shown in the following sections of the
report.
Figure 1: Direct Turnover, GVA and Employment; Established Marine Industries, 2008-2016
Figure 2: Direct Turnover, GVA and Employment; Emerging Marine Industries, 2010, 2012-2016
The general trend in direct turnover, GVA and employment in emerging marine industries for the period 2008-2016 is
upwards, in particular in terms of turnover and employment. GVA experienced a slight decline in 2014, which rapidly recovered
in the 2014-2016 period. Overall, emerging marine industries exhibited considerable resilience to the economic downturn,
with relatively steady growth rates in turnover between 2010 and 2016. Similarly, employment within the emerging marine
sectors has maintained relatively stable growth from 2010 to 2016.
16IRELAND’S OCEAN ECONOMY 17
Established
    Marine
 Industries

              18
IRELAND’S OCEAN ECONOMY
Established Marine Industries
Established marine industries refer to the traditional sectors that are usually associated with marine activity. Established
marine industries had a turnover of €4.3 billion in 2014 and provided employment of 25,670 FTEs, representing 94% of the
turnover and employment in Ireland’s ocean economy. In 2016 the Established Marine Industries had an estimated turnover
of €5.3 billion and provided estimated employment to 28,230 FTEs. The established industries include shipping and maritime
transport, tourism and leisure in marine and coastal areas, international cruise, sea fisheries, marine aquaculture, seafood
processing, oil and gas exploration and production, marine manufacturing, construction and engineering and marine retail
services. The relative contribution of each of these sectors to the overall turnover, employment and GVA of the established
marine industries are shown in Figure 3.
Figure 3: Relative contribution (%) of each subsector within the Established Irish Marine Industries to
turnover, GVA and employment, 2014
The shipping and maritime transport sector was the largest contributor to established marine industries in terms of turnover,
followed by tourism and leisure in marine and coastal areas, seafood processing, sea fisheries and oil and gas exploration and
production, respectively.
Tourism and leisure in marine and coastal areas was the largest contributor to employment in the established marine
industries, followed by shipping and maritime transport, seafood processing and sea fisheries, respectively.
In terms of GVA, again shipping and maritime transport is the largest contributor to Ireland’s established marine industries,
followed by tourism and leisure in marine and coastal areas, sea fisheries and seafood processing, respectively.
Figure 4 shows the rate of change in turnover, GVA and employment for the established industries in the 2014-2016
period. Oil and Gas exploration and production has experienced the largest increase in all three indicators, turnover, GVA and
employment. This is due to the start of production in the Corrib gas field in December 2015, which has resulted in a large
increase in the performance of this sector in 2016. Marine aquaculture and tourism and leisure in marine and coastal areas
also show significant increases in economic activity in the 2014-2016 period. In contrast, Sea Fisheries shows a slight decline
in turnover, which can be explained by the changes in quota for some of the key pelagic stocks. Details on economic trends by
sector are presented in the following sections, as well as the economic projections out to 2016.
19Figure 4: Rates of change (%) in turnover, GVA and employment. Established Industries, 2014-2016
20IRELAND’S OCEAN ECONOMY
Shipping and Maritime Transport
Sea-based transport accounts for 85% of the total volume and 56% of the total value9 of the goods traded in Ireland in
201610. The shipping and maritime transport sector has historically been the largest contributor to Ireland’s ocean economy in
terms of turnover and GVA. The sector comprises Irish sea-based transport operations for freight and passenger transport, as
well as associated services, including those related to ship leasing.
As an island nation, shipping and maritime transport represents an essential part of the strategic infrastructure that allows the
Irish economy to connect with the global market place. Table 10 shows the turnover, GVA, and employment for 2012, 2014
and 2016 as well as the % change between 2012 and 2014 and between 2014 and 2016. Figure 5 shows the trends for
both turnover and employment between 2008 and 2016.
Profile
• Sea and coastal passenger water transport
• Sea and coastal freight water transport
• Services incidental to water transport
• Cargo handling
• Renting and leasing of water transport equipment
• Other transportation support activities
Table 10: Shipping and Maritime Transport turnover, GVA, employment, 2012, 2014 and 2016
Shipping and Maritime 2012 2014 2016 2012-2014 2014-2016
Transport (% change) (% change)
Turnover €000’s 2,247,403 1,945,455 2,123,270 -13.4% 9.1%
GVA €000’s 374,594 488,502 533,151 30.4% 9.1%
Employment FTEs 3,933 4,375 4,666 11.2% 6.7%
Location of activity TThe majority of shipping and maritime operations and services occur around commercial ports along the coast of Ireland:
Cork, Drogheda, Dublin, Waterford, Dundalk, Dun Laoghaire, Galway, New Ross, Shannon Foynes and Wicklow
Source: CSO – Annual Services Inquiry (ASI), NACE Four-Digit Codes: 50.10, 50.20, 52.22, 52.24, 52.29, 77.34; IMDO iShip Index; CSO Quarterly
National Household Survey 2015, 2016; Figures for 2015 and 2016 are estimates11
The turnover generated by shipping and maritime transport operations and services in 2014 was €1.94 million. Total GVA
generated was €488.5 million. Turnover decreased between 2012 and 2014 by 13%, with a 30% increase in GVA in the
same period. These figures reflect a significant increase in productivity in this sector, which may be due to increases in
efficiency and market power as a result of the process of consolidation experienced in the container market over the last
few years. Employment in shipping and maritime services was 4,375 FTEs in 2014, which shows an increase of 11.2% with
respect to the previous reported period.
Estimates suggest that the turnover generated by the sector in 2016 was €2.1 million, representing an increase in activity
of over 9% between 2014 and 2016. Total GVA also increased by 9% at €533.1 million in the same period, as well as
employment with an increase of 6.7% to 4,666 FTEs.
9 44 million tonnes and €68 billion
10 CSO Trade Statistics – INTRASTAT, 2017
11 See Appendix for details on the methodology.
21While still below 2009 activity levels, the sector in gradually recovering in terms of turnover and employment. Figure 5 shows
the trends for both turnover and employment between 2008 and 2016.
Figure 5: Shipping and Maritime Transport turnover and employment trends, 2008 – 2016
Source: CSO – Annual Services Inquiry (ASI), NACE Four-Digit Codes: 50.10, 50.20, 52.22, 52.24, 52.29, 77.34; IMDO iShip Index; CSO Quarterly
National Household Survey 2015, 2016; Figures for 2015 and 2016 are estimates12
Overall fluctuations in the level of economic activity in the sector are mainly triggered by variations the services component associated
with shipping and maritime transport operations. Figure 6 shows turnover and GVA trends by shipping and maritime transport operations
and services in the 2008-2014 period
12 See Appendix 1 for details on the methodology.
22IRELAND’S OCEAN ECONOMY
Figure 6: Shipping and Maritime Transport Operations and Services turnover and GVA trends, 2008 – 2014
According to the Irish Maritime Development Office (IMDO), total port traffic increased by 2% in 2016, its highest level
since 2007. While this is undoubtedly a positive outcome and a reflection of the healthy economic environment that Ireland
is experiencing, concerns have been raised about the impact of Brexit on the maritime industry. The possibility of the re-
introduction of border and customs controls brings uncertainty regarding the operational consequences of increased transit
times and potential delays at Irish ports, for both freight and passenger transport. This could be particularly relevant in the case
of the UK landbridge route, which is currently the most reliable and frequently used route for freight traffic between Ireland
and continental Europe.
23Tourism and Leisure in Marine and Coastal Areas
Tourism and leisure in marine and coastal areas13 is a large contributor to Ireland’s ocean economy and has historically been
an important sector for the Irish coastal economy. The sector is the largest sector by employment and by enterprise in the
ocean economy and is also comprised of the largest number of separate NACE coded industry classifications. The tourism
industry contributed an estimated €7.5 billion in 2015 to the Irish economy and overseas tourist visits to Ireland in 2015 grew
by 13.1% (8 million visitors) relative to 201414. Tourism and travel data from the CSO indicated that there were 9.6 million
overseas visitors to Ireland in 2016 - an increase of 11% on 201515. Excluding coastal accommodation, an estimated 260
enterprises are also involved in the delivery of marine leisure activities around the coast of Ireland.
Demand for marine-based leisure comes from both domestic and overseas visitors. An estimated 127,000 people go sea
angling every year along Ireland’s 5,600 kilometres of coastline and recent research has demonstrated that sea anglers in
Ireland derive considerable utility from this recreational activity16. Adventure tourism, which includes marine activities such as
surfing, windsurfing, kite surfing, sailing and sea kayaking, also has a strong domestic market. Coastal attractions, such as the
Cliffs of Moher and Dun Aengus fort on the Aran Islands also receive high numbers of international visitors. Indeed, the Cliffs
of Moher Visitor Experience, was ranked the second most popular tourist attraction in the country in 2016, recording 1.4m
visitors and a 14pc increase on the previous year’s figures. Table 11 shows the turnover, GVA, and employment for 2012,
2014 and 2016 as well as the % change between 2012 and 2014 and between 2014 and 2016. Figure 7 shows the trends
for both turnover and employment between 2008 and 2016.
Profile
Watersports Seaside / Resort Trips Angling
• Sailing at sea • Swimming in the sea • Sea angling from boats
• Boating at sea • Bird watching in coastal areas • Sea angling from the shore
• Water skiing / Jet skiing • Whale/dolphin watching
• Surfing, sail boarding • Visiting coastal natural reserves
• Sea kayaking • Other trips to the beach seaside
• Scuba diving / snorkelling and islands
• Other sea sports • Coastal accommodation
Table 11: Tourism and Leisure in Marine and Coastal Areas; turnover, GVA, employment, 2012, 2014 and
2016
Tourism 2012 2014 2016 2012-2014 (% 2014-2016 (%
change) change)
Turnover €’000 775,745.40 984,580.28 1,304,287.92 26% 32%
GVA €000's 329,923.77 396,528.85 489,645.64 20% 23%
Employment FTEs 13,003 13,865 14,891 7% 7%
Location of activity Tourism and leisure in marine and coastal areas are offered all along the coast of Ireland
Source: Source: CSO – Annual Service Inquiry (ASI); NACE Four-Digit Code: 5510, 5520, 5530, 9312, 9319, 9321, 9329; Fáilte Ireland statistics.
13 For the purpose of this study, tourism is defined as tourism in coastal areas. Coastal areas are defined as municipalities (LAU-2) that either border on the
sea or have 50% of their surface within a distance of 10 km from the sea).
14 Fáilte Ireland Tourism Facts, 2015
15 CSO Overseas Travel. Available at http://pdf.cso.ie/www/pdf/20170525082428_Overseas_Travel_February__April_2017_full.pdf
16 Hynes, S., Gaeven, R. and O’Reilly, P. (2017). Estimating a Total Demand Function for Sea Angling Pursuits. Ecological Economics, 134, 73–81.
24IRELAND’S OCEAN ECONOMY
The turnover generated by tourism and leisure in marine and coastal areas in 2016 is estimated to be €1304 million and the
total GVA generated was €490 million. Following the decrease in GVA in the sector from 2008 through to 2010 there has
been a steady increase in both GVA and turnover since 2011. The decrease in activity in the 2008 to 2010 period reflected
the general downturn in the global economy following the financial crisis. The 51% increase in turnover between 2011 and
2016 reflects an improvement in the state of the global economy but also the success of such Fáilte Ireland initiatives such
as the Wild Atlantic Way and the Gathering Initiatives; the latter aimed at attracting the diaspora to visit Ireland in 2013.
Employment in marine tourism and leisure was 5,195 FTEs in 2014, which shows an increase of 6.6% with respect to 2012.
The turnover generated by the sector in 2014 was €984 million, representing an increase in activity of 11% between 2012
and 2014. Estimated GVA increased to €286 million in the same period, while employment also increased to 5,952 FTEs, an
increase of 15%.
Overall, the turnover and employment trends shown in Figure 7 indicates a turning point in marine tourism activity in 2012,
with a clear recovery in years 2013-2016.
Figure 7: Tourism and Leisure in Marine and Coastal Areas; turnover and employment trends, 2008 – 2016
Source: CSO – Census of Industrial Production (CIP) NACE Four-Digit Code: 5510, 5520, 5530, 9312, 9319, 9321, 9329. Fáilte Ireland statistics.
According to the CSO, in the period November 2016 – January 2017, the total number of trips to Ireland increased by 7.2% to
1,871,100 - an overall increase of 126,400 compared to the same period twelve months earlier17. Tourism Ireland has reported that
industry sentiment within Ireland and among overseas trade partners is ‘cautiously positive overall’ for the 2017 season18. Tourism Ireland
does warn however that a decline in air access to Ireland for the summer of 2017 from Britain of 4% and the decline in sterling (which
continues with political and Brexit uncertainty) has made trips to Ireland more expensive for British visitors to Ireland; and economic
uncertainty is making British travellers more cautious about discretionary spending. This is a concern given that British visitors to Ireland
are the second most frequent following visitors from mainland Europe.
17 CSO Statistical Release, February 2017: Overseas Travel, November 2016– January 2017
18 Tourism Ireland, Situation and Outlook Analysis Report, May 2017
25International Cruise Industry
In 2015, cruise industry direct expenditures grew by 1.5% from 2014 to €16.89 billion19 . Growth of the industry over the past
decade has increased demand for additional destinations for cruise line operators, and Ireland continues to capitalise on this
with its strong tourist product in close proximity to its main ports of call. Table 12 shows the total expenditure by disembarking
cruise passengers at Irish ports and GVA for 2012, 2014 and 2016 as well as the percentage change in the 2012-2014 and
2012-2014 periods. Figure 8 shows the number of passenger and cruise ship visits to Irish ports from 2009 to 2014.
Profile
The main ports of call for cruise liners include:
• Dublin
• Cork
• Waterford
• Dun Laoghaire
Table 12: International Cruise passengers, calls, expenditure, GVA, 2012, 2014 and 2016
International Cruise Industry 2012 2014 2016 2012-2014 2014-2016
(% change) (% change)
Average passengers per port call 1,357 1,525 1,614 12% 6%
Number of calls Irish ports 229 200 274 -12% 4%
Total expenditure by disembarking cruise 20,829 24,296 25,937 17% 7%
passengers €000’s
Estimated Gross Value Added €000’s 8,859 9,785 9,765 10% 0%
Source: IMDO - The Irish Maritime Transport Economist
There was a total of 274 visits by liners at Irish ports in 2016, which represents an increase of 6% on 2014 figures. The total
expenditure by disembarking cruise passenger was €25.94 million in 2016, representing a 7% increase with respect to 2014.
Estimates suggest that the gross value added from cruise tourism expenditure generated by the sector in 2016 was €9.7
million, which represents no change with respect to GVA recorded for 2014. The average number of passengers per port call
in the same period rose to 1,614, an increase of 6% on 2014 numbers although slightly down on 2015 figures where the
average number of passengers per vessel was a record high of 1,816. This was mainly due to a number of larger international
liners visiting Irish ports in that year.
19 CLIA, “The Cruise Industry: Contribution of Cruise Tourism to the Economies of Europe”, 2016. Note this direct expenditure figure includes spending for
the construction of new cruise ships and the maintenance and refurbishment of existing ships with European shipyards.
26IRELAND’S OCEAN ECONOMY
Figure 8: Passenger and Cruise Ship visits to Irish Ports (Number) 2011 – 2016
Source: IMDO
The international cruise industry remains the fastest growing travel sector in the world and strong growth is continuing to be
projected for the global cruise industry in the coming years20. The Cruise Lines International Association (CLIA) estimate that
25.8 million passengers will partake in a cruise in 2017. With an estimated total (direct and indirect) economic contribution
to the EU of €41 billion in 2015, the cruise industry is seen as a driving force for coastal economies in Europe. This figure
represents an increase of 2% compared to 201421. Irish ports continued to capitalise on the rise in cruise tourism in the last
decade and cruise ship calls to Irish ports rose to 274 in 2016 . As seen in Figure 8 this is the highest number of calls since
2013. This upwards trend is expected to continue in the coming years with ports such as Dublin and Galway planning to
expand their capacity to handle increased cruise traffic.
20 Cruise Lines International Association (CLIA), 2017. State of the Cruise Industry Outlook 2017
21 Tourism Review. http://www.tourism-review.com/cruise-tourism-in-europe-recorded-growth-news5215
27Marine Retail Services
Marine Retail Services are comprised of small and medium sized enterprises involved in retail activities including the sale of
marine equipment, boat sales, chandlery, and the retail of seafood in fishmonger shops. Table 13 shows the turnover, GVA, and
employment for 2012, 2014 and 2016 (estimated) as well as the % change for each period. Figure 9 shows the trends for
both turnover and employment over the 2008-2016 period.
Profile
• Chandlery
• Boat sales
• Marine equipment sales
• Retail of seafood in fishmonger specialised stores
Table 13: Marine Retail Services turnover, GVA, employment, 2012, 2014 and 2016
Marine Retail Services 2012 2014 2016 2012-2014 2014-2016
(% change) (% change)
Turnover €000’s 119,230 152,626 162,384.17 28% 6%
GVA €000’s 34,559 60,050 63,889.16 73% 6%
Employment FTEs 590 743 790 26% 6%
Location of activity Marine Retail Services are located throughout Ireland, both along the coast and inland, (the boat sales and seafood
retail categories particularly relates to the latter). The majority of the technology-related marine service companies are
located within the larger cities, primarily Galway, Cork and Dublinlin
Source: SEMRU Company Survey, CSO – Annual Services Inquiry (ASI) NACE Four-Digit Code 47.23; CSO – Retail Services Inquiry; CSO – National
Household Survey; Figures for turnover and GVA for 2016 are estimates.
The turnover generated by marine retail services in 2014 was €152 million. Total GVA generated was €60 million. Turnover
increased between 2012 and 2014 by 28%, with a 73% increase in GVA in the same period. Employment in marine retail
services was 743 FTES in 2014, which shows an increase of 26% with respect to the previous reporting period. Estimates
suggest that the turnover generated by the sector in 2016 was €162 million, representing again an increase in activity of 6%
between 2014 and 2016. Estimated GVA and employment increased again by approximately 6% to €64 million and 790 FTEs
respectively in the same period.
Figure 9 shows the trends in turnover and employment over the 2012-2016 period. After a strong recovery from the low levels
of activity experienced in 2010, the sector shows positive trends since 2013, in particular in terms of employment numbers,
with strong growth in 2013 with respect to the previous period.
28IRELAND’S OCEAN ECONOMY
Figure 9: Marine Retail Services turnover and employment trends, 2010 and 2012-2016
Source: SEMRU Company Survey, CSO – Annual Services Inquiry (ASI) NACE Four-Digit Code 47.23; CSO – Retail Services Inquiry; CSO – National
Household Survey; Figures for turnover and GVA for 2016 are estimates.
In general the marine retail sector is subject to similar challenges and opportunities as the overall retail sector in Ireland.
Following the economic downturn, the retail sector is gradually recovering with an estimated increase in retail sales of 12%
between 2014 and 201622. This trend is set to continue in 2017 with key indicators pointing to further improvements in the
sector. According to IBEC, disposable income grew by 3% last year as a result of sustained employment and wage growth.
This had a positive impact on consumer spending, which grew by 3% in 2016 with respect to the previous period23.
22 CSO Retail Sales Index, 2014-2016
23 IBEC Quarterly Economic Outlook, Q1 2017.
29You can also read