IRELAND SELECTED ISUUES - International Monetary Fund
←
→
Page content transcription
If your browser does not render page correctly, please read the page content below
IMF Country Report No. 17/172
IRELAND
SELECTED ISUUES
June 2017
This paper on Ireland was prepared by a staff team of the International Monetary Fund as
background documentation for the periodic consultation with the member country. It is
based on the information available at the time it was completed on June 7, 2017.
Copies of this report are available to the public from
International Monetary Fund Publication Services
PO Box 92780 Washington, D.C. 20090
Telephone: (202) 623-7430 Fax: (202) 623-7201
E-mail: publications@imf.org Web: http://www.imf.org
Price: $18.00 per printed copy
International Monetary Fund
Washington, D.C.
© 2017 International Monetary Fund
IRELAND
               SELECTED ISSUES
June 7, 2017
                 Approved By                 Prepared By Alessandro Giustiniani, Nir Klein, and Jiri
                 European Department         Podpiera

                  CONTENTS

               INCOME INEQUALITY AND THE WELFARE SYSTEM IN IRELAND: AN OVERVIEW 3
               A. From Crisis to Recovery ____________________________________________________________5
               B. Why is Ireland’s Market-Income Inequality High? __________________________________ 10
               C. Can Ireland’s Social Protection System Be More Effective? _________________________ 13
               D. Conclusions ________________________________________________________________________ 19

               BOXES
               1. Broader Measures of Well-Being _____________________________________________________4
               2. Pensions and Social Insurance _____________________________________________________ 14

               References ____________________________________________________________________________ 20

               HOUSEHOLD DELEVERAGING IN IRELAND ________________________________________ 23
               A. Introduction _______________________________________________________________________ 23
               B. The Dynamics and Composition of Household Debt _______________________________ 24
               C. Determinants of Household Debt __________________________________________________ 28
               D. Key Takeaways _____________________________________________________________________ 33

               BOXES
               1. Methodologies Applied to Study Household Debt _________________________________ 30

               TABLES
               1. Summary Statistics, 2003Q1–2016Q3 ______________________________________________ 31
               2. Determinants of Household Debt-to-Disposable Income __________________________ 32

               References ____________________________________________________________________________ 35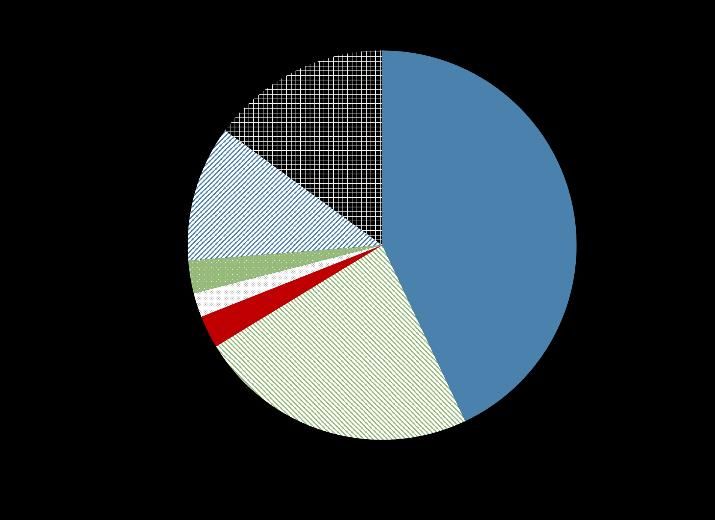
IRELAND

          ANNEX
          I. Determinants of Household Debt __________________________________________________ 37

          TABLE
          1. Correlation Matrix __________________________________________________________________ 39

          IRELAND: THE ROLE OF FOREIGN-OWNED MULTINATIONAL ENTERPRISES_____ 40
          A. Overview ___________________________________________________________________________ 40
          B. Policy Implications _________________________________________________________________ 49

          BOXES
          1. Overseas Activities of Multinationals _______________________________________________ 49
          2. Impact of Potential US and International Tax Changes on Multinationals in Ireland 50

          FIGURES
          1. Foreign Investors in Ireland ________________________________________________________   41
          2. Irish Competitiveness ______________________________________________________________    42
          3. Foreign-Owned Multinational Enterprises __________________________________________      43
          4. Multinational Productivity and Wages Compared __________________________________        44
          5. Global Value Chain Position ________________________________________________________    44
          6. Length of Global Value Chains _____________________________________________________     45
          7. Share of Non-Irish Employment ____________________________________________________      46
          8. Job Vacancies Rate, by activity _____________________________________________________   46
          9. Export and Net International Investment Position __________________________________     47
          10. Share of domestic GVA embedded in gross exports ______________________________         48
          11. Revenues from CIT ________________________________________________________________     51

          APPENDIX
          I. Statistical Challenges _______________________________________________________________ 54

          BOXES
          1. Impact of Multinationals on GDP___________________________________________________      55
          2. Impact of Multinationals on External Accounts _____________________________________     57
          3. Statistical Impact of IP-Related Operations by Multinationals ______________________    57
          4. How Statistical Issues Affect the IMF’s Work _______________________________________    59
          5. ESRG Recommendations and Planned CSO Follow-up _____________________________            60

          FIGURE
          1. Growth and Trade __________________________________________________________________ 58

          References ____________________________________________________________________________ 62

2   INTERNATIONAL MONETARY FUND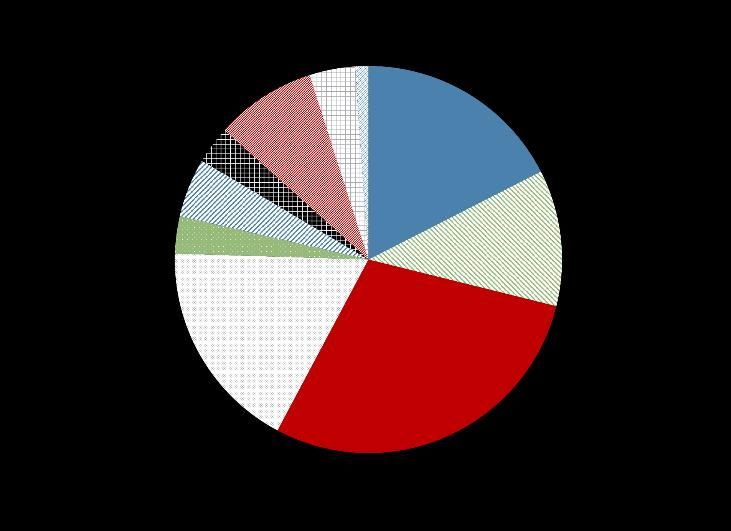
IRELAND
INCOME INEQUALITY AND THE WELFARE SYSTEM IN
IRELAND: AN OVERVIEW1
1. This paper provides a brief overview of income distribution and the welfare system in
Ireland, with a focus on the crisis and post-crisis period. Ireland’s flexible economy and strong
social safety net helped mitigate the adverse effects of the property-driven crisis. While economic
conditions are improving rapidly, lifting employment, ongoing efforts are needed to address the
lingering impact on those hardest hit, including the long-term unemployed and unemployed youth.
More broadly, the tax-benefit system has been effective in redistributing income and mitigating
poverty, but the long-recognized challenges of market-income inequality, i.e. before taxes and
transfers, and regional disparities continue to be relevant. In this context, consistent efforts will be
needed to support sustainable and inclusive growth and meet ambitious social targets, including the
reduction of consistent poverty to 2 percent by 2020.2
2. Important caveats apply to this analysis. Given data limitations, the quantitative analysis
in this paper focuses on basic aspects of income distribution. However, economic inequality is a
holistic concept that goes beyond narrow measures of income distribution and comprises the
capacity and ability of people to attain goods and services to satisfy their diverse needs and to
thrive as individuals. In addition, household living standards are also affected by the provision of
public services, such as health and education, with an impact on inequality that is hard to quantify
(Lawless and Reilley, 2016). Ireland performs relatively well in studies of broader well-being, where
these factors are relevant (Box 1). In addition, the latest available data on social conditions and
income distribution does not reflect more recent improvements in the Irish economy.
3. The paper is structured as follows. Section A provides an overview of economic and social
developments from crisis to recovery. Section B discusses the main causes of the relatively high
market-income inequality that characterizes Ireland. Section C summarizes Ireland’s tax-benefit
system, focusing on issues regarding personal income taxation, labor market policies, and the
impact of social benefits in mitigating income disparities and poverty. Section D concludes.
4. The main findings can be summarized as follows:
Ireland is characterized by one of highest dispersions of market income among EU (and OECD)
countries. Specific features of the Irish economy, as well as specific structural gaps, contribute to
explaining this situation.
1Prepared by Alessandro Giustiniani. The author wishes to thank the participants to the seminar organized by the
Central Bank of Ireland and, in particular, Reamonn Lydon for his useful comments to the presentation.
2The term consistent poverty describes individuals whose income is below the relative/at risk of poverty threshold
and who cannot afford at least two of eleven deprivation indicators (such as two pairs of strong shoes, a warm
waterproof overcoat, or an adequately warm home).
INTERNATIONAL MONETARY FUND 3
IRELAND
Ireland’s tax-benefit system is one of the most effective in the EU in redistributing income,
thereby mitigating income disparities across a range of factors (including regions). A relatively
progressive tax system funds a robust system of social benefits, a significant share of which is
means-tested.
Box 1. Ireland: Broader Measures of Well-Being
A better understanding of people’s well‑being is central to developing better policies for better lives. To this
end, the OECD has developed a well‑being index (Better Life Index), a multidimensional metric covering
aspects of life ranging from civic engagement to housing, from household income to work‑life balance, and
from skills to health status.1/
Current Well-Being in Ireland
(Ranking of OECD countries; Longer lines show areas of strength, shorter lines show areas of weakness)
Subjective Income and
well-being wealth
House-
Personal Life hold Financial
security Feeling
satis- income wealth
faction
safe at Employment
night
Jobs and
Homicides Earnings
earnings
Civic engagement Stakeholder Labor market
and governance engagement insecurity
Voter Long-term
turnout unemploy-
ment
Social Social Working Work-life
connections support hours
balance
Cognitive Rooms per
skills person
Years in Housing
education affordability
Education
Educational
Basic Housing
and skills attainment
sanitation
Perceived Water
health Life Air quality
expectancy quality
Health
Environmental quality
Source: OECD Better Life Initiative. status
Ireland performs well in many measures of well-being relative to most other countries, particularly regarding
housing (despite the current supply shortfall), personal security, health status, education and skills, social
connections, subjective well-being, work-life balance, and environmental quality. However, Ireland ranks
below average in income and wealth, and civic engagement.
1/
See, http://www.oecdbetterlifeindex.org/
Despite the severe financial crisis and substantial budget cuts, the government succeeded in
preserving most welfare expenditure, which provided an important cushion against the worst
effects of the crisis. This helped safeguard social solidarity and cohesion.
During the crisis, the elderly were shielded more than younger generations, who also face more
uncertain job opportunities than before the crisis. With the economic recovery and the
4 INTERNATIONAL MONETARY FUND
IRELAND
associated decline in unemployment, including youth joblessness, the intergenerational
distribution has shown some improvement. Nonetheless, it would be useful to consider potential
steps to reinforce the current welfare system to address future challenges.
Although efficient, the welfare system is complex, covers a relatively high number of individuals
and families, and represents a sizable portion of public expenditures. Efforts should continue to
get more people into jobs, and specifically more secure and better paying jobs, thus mitigating
market-income, as well as regional, inequality. To this end, the authorities recognize that
upskilling and reskilling the labor force requires enhancing the effectiveness of active labor-
market policies and, more broadly, better aligning educational path with enterprise needs. They
are also working to address gaps in childcare provision, a crucial drag on female labor market
participation.
A. From Crisis to Recovery
5. The bust of the real estate bubble, together with the Great Recession, had a striking
impact on Ireland’s economy. The consequences for the labor market were rapid and deep,
particularly for younger generations. Total unemployment soared to almost 15 percent in 2011–12
from less than 5 percent in 2007, while youth joblessness peaked at 30 percent from less than 10
percent over the same period.3 Per-capita market income declined by about 17 percent on average,
with the burden disproportionally borne by those in lower-income deciles, reflecting in part the
heavy toll of the construction bust (OECD, 2015). Moreover, the wage entry of new hires collapsed
by 20–25 percent compared to existing workers or job changers (Lydon, 2017). Consequently, the
worsening of market-income distribution, as measured by the Gini coefficient, was among the
steepest in EU countries. This was also associated with an increase in the dispersion of per-capita
market income across regions, with the Border, Midland, and the South-East regions falling further
from the national average.
Total Unemployment Youth Unemployment
(in percent of active population) (in percent of active population)
30 30 70 70
25 25 60 60
EU max. EU max.
50 50
20 Other crisis countries 1/
20 Other crisis countries 1/
40 40
15 IRL 15 IRL
Mean
30 30
Mean
10 10
GBR 20 20
GBR
5 5 10 10
EU min. EU min.
0 0 0 0
2004 2006 2008 2010 2012 2014 2016 2004 2006 2008 2010 2012 2014 2016
Sources: Eurostat; and IMF staff.
1/ Simple average of Italy, Spain, and Portugal.
3Ireland also experienced a reversal in net migration, with outflows exceeding inflows. Without this, the increase in
unemployment would have been worse. In addition, youth may have reacted to the employment collapse by
delaying their labor market entry.
INTERNATIONAL MONETARY FUND 5
IRELAND
Gini Coefficient; 2007-20121/ Per-Capita Income - Coefficient of Regional Variation
(market income, before taxes and transfers) (standard deviation over average)
70 70 18 18
Market income
2007 2012 16 16
60 60 Disposable income
14 14
50 50
12 12
40 40 10 10
30 30 8 8
6 6
20 20
4 4
10 10 2 2
0 0 0 0
2007 2008 2009 2010 2011 2012 2013 2014
EST
ESP
PRT
GBR
SVK
LUX
SVN
IRL
BEL
GRC
CZE
FIN
POL
LVA
LTU
ITA
AUT
Sources: Central Statistics Office; OECD; and IMF staff.
1/ The Gini coefficient assumes values comprised between 0 (perfect equality) and 100 (perfect inequality).
6. The crisis period also saw significant reforms of the tax-benefit system. Mainly
reflecting the increase in unemployment, the number of recipients of welfare social payments
peaked in 2012 at 1.47 million, or 32 percent of the total population, compared to 24 percent in
2007. This put the welfare system under pressure, while fiscal consolidation also became necessary
to bring public finances and debt on a sustainable path.4 Consequently, with a view to protect the
most disadvantaged while keeping adequate
Recipients of Social Benefits; 2006-15
incentives to work, the system of social benefits
2.0 45
social insu rance - excl. pensions (% population; rhs)
social insu rance - pen sions (% population, rhs)
was significantly recalibrated: eligibility criteria
40
1.8 social assistance - excl. pensions (% population; rhs)
social assistance - pensions (% population, rhs)
were tightened, means-testing was
35
1.6
number of people (millions, lhs) strengthened, the duration of some benefits was
30
shortened, and allowances were reduced in
1.4 25
some cases.5 At the same time, incentives for
1.2 20
education and training were strengthened to
15
1.0 facilitate the return to work of the unemployed,
10
0.8 especially young people with low skills who,
5
0.6 0
before the crisis, were able to find jobs in the
2006 2008 2010 2012 2014 booming construction sector. On the revenue
sides, the introduction of the Universal Social
Sources: Department of Social Protection; Eurostat; and IMF staff.
Charge (USC), which replaced two flat
contribution-rate levies (the health and income levies), increased the progressivity of the income tax
system (Kennedy and others, 2015).
4 Dukelow and Considine (2014) emphasize that in the early stages of the crisis, debate on social welfare reforms
focused on the generosity of the social system that had developed during the boom period and hence on the need
to reduce work disincentives and keep the unemployed as “close to the labor market as possible.”
5 In particular, the universally paid Child Benefits, as well as unemployment payments and welfare payments to one-
parent families, were reduced. Callan and others (2015) estimates that “policy-induced losses” over 2009–16 were just
over 14 percent for the top income group and almost 13 percent for the lowest income group. Proportionate losses
for single unemployed people without children were highest at close to 20 percent.
6 INTERNATIONAL MONETARY FUNDIRELAND
7. Overall, social transfers performed strongly throughout the crisis in reducing the at-
risk-of-poverty rate. At the apex of the crisis (2010–12), social transfers (including pensions)
reduced the share of total population at risk of poverty to around 15 percent, broadly in line with
the EU (simple) average, from over 50 percent. In 2010–11, the improvement due to social transfers
was about 25 percentage points in absolute terms, the largest in EU countries, which corresponded
to poverty reduction of about 50 percent. This is a particularly striking result compared to the
experience of other EU countries that experienced sharp debt and/or property-driven corrections
(e.g. Italy, Spain, and Portugal).6 A similar picture emerges when income-distribution indicators, such
as the Gini coefficient, are considered. The Irish tax-benefit system has performed strongly, reducing
relatively high market-income inequality (i.e. before taxes and transfers) to the EU average in terms
Share of Population at Risk of Poverty - Before Transfers Share of Population at Risk of Poverty - After Transfers
(cut-off point 60 percentof median equivalized income) (cut-off point 60 percent of median equvalized income)
60 60 30 30
EU max.
55 EU max. 55
25 25
50 50
IRL Other Crisis Countries Other Crisis Countries
20 20
45 GBR 45
GBR
EU avg.
40 EU avg. 40 15 IRL
15
35 35
10 10
30 EU min. 30 EU min.
25 25 5 5
2004 2006 2008 2010 2012 2014 2004 2006 2008 2010 2012 2014
Market Income Distribution - Gini Coefficient1/ Disposable Income Distribution - Gini Coefficient1/
(before taxes and transfers) (after taxes and transfers)
60 60 45 45
IRL
55 EU max. GBR 55 40 EU max.
40
Other crisis countries GBR
50 50 35 35
EU avg. Other crisis countries IRL
45 45 30 EU avg. 30
EU min.
40 40 25 25
EU min.
35 35 20 20
2004 2006 2008 2010 2012 2014 2004 2006 2008 2010 2012 2014
Sources: Eurostat; OECD; and IMF staff.
1/ The Gini coefficient assumes values comprised between 0 (perfect equality) and 100 (perfect inequality).
6Spain experienced a similar real estate boom-bust cycle; Portugal entered into a EU-IMF supported program a few
months after Ireland; Italy has a high debt burden, like Ireland during the crisis. The UK was also included as
comparator, given the close ties between the two countries and the UK influence on the Irish welfare system.
INTERNATIONAL MONETARY FUND 7IRELAND
of disposable income (i.e. after taxes and transfers). Bargain and others (2015) note that disposable-
income inequality remained relatively unchanged during the first part of the crisis (2008–10),
increasing in the subsequent period, (2010–13). Notwithstanding this increase, Ireland also
compares favorably to other crisis-hit countries in this dimension. In addition, the welfare system
mitigated the impact of the crisis on regional disposable-income dispersion.
8. As in other EU countries,
intergenerational differences worsened At Risk of Poverty After Social Transfers
(percent of population, cut-off 60% median equivalized income)
during the crisis period.7 The welfare system in 40 40
IRL
Ireland protected the elderly more than the 35 18-24y 35
young from the consequences of the crisis. 30
65y and over
30
Pensioners were mainly affected by reductions
25 25
in supplementary entitlements, as pension
20 20
benefits were increased in the 2009 and 2016
15 15
budgets. Nonetheless, the scale of rate
10 10
reductions (including child benefits) and
5 5
reductions in supplementary payments (where
0 0
entitled) experienced by working-age
2004 2006 2008 2010 2012 2014
individuals were larger. Sources: Eurostat; and IMF staff.
9. Traditional metrics based on income may not fully capture the severity of the crisis,
which was amplified by household over-indebtedness. Many households were caught between the
rock of servicing their mortgages in face of declining incomes and the hard place of negative wealth,
reflecting the collapse of real-estate prices, which resulted in a sharp surge in wealth inequality
(Lydon, 2017). Whelan and others (2015, 2016), focusing on measures of economic stress, find that
the gap between the elderly and remaining age groups widened significantly during the crisis.8
Material deprivation and financial stress for young and working-age groups, although starting below
the EU average, deteriorated substantially until 2012–13. 9 10 The trend for the elderly, albeit still
adverse, was smoother. This also reflects the fact that debt distribution by group ages is skewed
towards the young.11
7 Chen and others (2017).
8The measure of economic stress is based on a set of indicators that are intended to capture debt problems but also
capacity to cope with financial demands, such as structural arrears, burden of housing costs, inability to meet
unexpected expenses, and difficulty in making ends meet.
9The simple average of the share of households that were unable to cope with unexpected expenses; to avoid
arrears on mortgage or rent payments, utility bills, instalment loans or other loan payments (in the past 12 months);
and could not make ends meet.
10The material deprivation rate measures the share of population unable to afford some items considered desirable
or even necessary to have an adequate life.
11 See also, N. Klein (2017).
8 INTERNATIONAL MONETARY FUNDIRELAND
Material Deprivation Rate 1/ - 18-64 years Material Deprivation Rate 1/ - 65 years or over
(percent of population) (percent of population)
12 12 12 12
EU 27 avg.
10 10 10 EU 27 avg. 10
8 8 8 8
Other Crisis Countries
GBR
6 6 6 Other Crisis Countries 6
IRL
IRL
4 4 4 4
2 2 2 2
GBR
0 0 0 0
2004 2006 2008 2010 2012 2014 2004 2006 2008 2010 2012 2014
Sources: Eurostat; and IMF staff.
1/ Material deprivation rate for the 'Economic strain' and 'Durables' dimensions; 4 items or more.
Households Experiencing Financial Stress Households Experiencing Financial Stress
(one adult younger than 65 years; percent of population) (one adult 65 years or over; percent of population)
25 25 16 16
IRL 14 14
Other Crisis Countries
IRL
20 20 12 12
GBR 10 EU 27 avg. 10
15 15 8 8
EU 27 avg.
6 GBR 6
10 Other Crisis Countries 10 4 4
2 2
5 5 0 0
2004 2006 2008 2010 2012 2014 2004 2006 2008 2010 2012 2014
Sources: Eurostat; and IMF staff.
10. With the economic recovery firmly underway, social conditions have improved, but
the young and long-term unemployed are still facing a challenging environment. Reflecting
the steady implementation of sound macroeconomic policies and reforms, the Irish economy has
returned rapidly to a sustained growth path. Unemployment and youth joblessness have declined
steadily since 2012, to about 6½ percent and
Ireland: Employment Growth (15-24) by Contract; 2004-16
14½ percent in early 2017, respectively, both (contribution to growth; percent)
well below EU averages and projected to 20
Part time (lhs) Permanent (lhs)
60
15 Shr. Part-time (rhs)
continue to decline. Nonetheless, labor market 50
10
participation has not recovered to pre-crisis 5
40
levels and part-time employment has increased, 0
particularly for workers aged 15–24 years. Long- -5 30
-10
term unemployment has also declined from 20
-15
9 percent in 2012 to 4.2 percent in 2016, broadly -20
10
in line with the EU average. In terms of material -25
deprivation and financial stress, the relative -30 0
2005 2008 2011 2014
position of younger groups, while showing signs
of improvement, remained, as of 2015, Sources: Eurostat; and IMF staff.
disadvantaged compared to the EU average.
INTERNATIONAL MONETARY FUND 9IRELAND
B. Why is Ireland’s Market-Income Inequality High?
11. High market-income inequality in Ireland is mainly driven by the lower end of income
distribution. Earnings dispersion in Ireland has widened over time and is among the largest in the
EU.
Earnings Dispersion Ratios; 2014 1/
The share of market income accruing to the (units)
5 5
top decile is high (about 37 percent), partly D9/D1
Median/D1
driven by the growing role of multinational 4 D9/M edian 4
enterprises (MNEs) in Ireland, which offer
3 3
high-paid jobs to those with high skills.
However, the high-end share is not 2 2
excessive by international comparison.
1 1
On the other hand, the income share of the
0 0
bottom 20 percent of households is the
DNK
SWE
EST
ESP
ROM
PRT
SVK
MLT
BGR
GBR
LUX
SVN
CYP
IRL
CZE
BEL
FIN
HUN
POL
LVA
FRA
DEU
LTU
ITA
NLD
AUS
lowest in the OECD (OECD, 2015), with the
share of low-wage earners in Ireland (about Sources: Eurostat; and IMF staff.
22 percent of total employees) higher than 1/ D1 = first decile; D9 = ninth decile.
the EU average (about 17 percent).12
12. High, albeit improving, long-term unemployment and low labor market participation
add to inequality. Unemployment is rapidly declining but long-term unemployment remains
relatively high. As of end-2016, the long-term unemployed stood at just over 83 thousand
(3.8 percent of the labor force); almost three times higher than in 2007 (for the EU, the increase was
1½ times over the same period). Long spells of unemployment deplete labor skills, thus making
return to work harder. In addition, the labor market participation rate is low compared to EU peers,
especially for women. In this regard, the availability and cost of childcare remain a crucial barrier,
forcing parents into labor market inactivity or part-time work.13 The combination of these factors
translate into a relatively high portion of Irish people living in households with low work intensity:
18.8 percent in 2015—the highest in Europe.14 Moreover, the share of children living in jobless
households is second only to that of Bulgaria. The Irish authorities have taken steps to address the
12In Ireland, the low-wage threshold is just above 55 percent of average gross earnings and 66 percent of median
gross earnings, which are broadly in line with the simple average for EU countries (54.8 percent and 67 percent,
respectively). Nonetheless, Ireland’s low pay threshold (10.99 in purchasing power terms) is about 25 percent higher
than the EU average (8.80 in purchasing power terms).
13 Around 27.4 percent of inactive women aged 20–64 do not work because they must look after children or
incapacitated adults (4.5 percent of men) and 26 percent of women who work part-time cite the same reason
(3.6 percent of men). Single parents, mostly women, suffer from the lack and high cost of childcare support
(European Commission, 2017).
14The work intensity of a household is the ratio of the total number of months that all working-age household
members (i.e. all members aged 18–59 years) have worked during the income reference year and the total number of
months the same household members theoretically could have worked in the same period. A ratio between 0.20 and
0.45 indicated low work intensity.
10 INTERNATIONAL MONETARY FUNDIRELAND
Long-Term Unemployment Participation rate
(thousands of people) (age 15-64 years; percent)
250 14,000 85 85
IRL (lhs) IRL (Total) IRL (Female)
EU28 (rhs) 12,000 80 EU28 (Total) EU28 (Female) 80
200
10,000
75 75
150 8,000
70 70
100 6,000
65 65
4,000
50 60 60
2,000
0 0 55 55
2004 2006 2008 2010 2012 2014 2016 2007 2008 2009 2010 2011 2012 2013 2014 2015 2016
Sources: Eurostat; and IMF staff.
issue of access and affordability of childcare. In this context, the 2017 budget introduced a new
Single Affordable Childcare Scheme, replacing all existing schemes with mostly means-tested
subsidies focused on low-income, disadvantaged families. Steps are also underway to improve the
quality of childcare provision.
Population Structure; 2015
(percent)
13. High market-income inequality is 22 22
People living in households with very low work intensity
20 20
associated with low intergenerational 18
Children aged 0-17 living in jobless households
18
mobility in Ireland. The two phenomena are 16 16
14 14
closely intertwined. Higher income inequality
12 12
skews opportunity and lowers intergenerational 10 10
mobility, thus perpetuating disparities. Low 8 8
6 6
mobility in turn perpetuates inequality. Empirical 4 4
evidence indicates that income mobility in 2 2
0 0
Ireland has indeed been low at both ends of
DNK
ESP
EST
SWE
ROM
BGR
GBR
MLT
SVK
PRT
LUX
SVN
CYP
GRE
IRL
BEL
HUN
CZE
FIN
FRA
HRV
LVA
POL
LTU
DEU
ITA
NLD
AUS
income distribution. However, the distribution
moved towards the low end once the crisis Sources: Eurostat; and IMF staff.
began, reflecting the sharp deterioration of the
labor market (Kennedy and others, 2015). Ireland does not compare favorably with peers in cross-
country analyses of intergenerational earnings and education mobility as well as broad measures of
inequality of opportunity (Hertz and others, 2007, Checchi and others, 2016, Brzezinski, 2015).15
15Inequality of opportunities emphasizes the impact of circumstances for which individuals cannot be held
responsible, such as socio-economic background, on individual outcomes in terms of income earnings. Parents’
educational attainment and occupation are usually used as proxies.
INTERNATIONAL MONETARY FUND 11IRELAND
Intergenerational Education Elasticity Absolute Inequality of Opportunities in Europe
(Higher values indicate lower intergenerational mobility in education) (Higher values indicate higher inequality)
New Zealand Sweden
Norway Finland
Denmark
Belgiu m
Netherlands
Czech Republic Norway
Un ited States Germany
Poland United Kingdom
Sloven ia
Finland
Slovakia
Den mark France
Switzerland Austria
Slovenia Czech Rep.
Estonia Portugal
Italy
Sweden
Lit huania
Netherlan ds Poland
Slovakia Belgium
Hungary Ireland
Latvia
It aly
Est onia
Ireland Spain
United Kingdom Greece
0 0.2 0.4 0.6 0.8 0 0.01 0.02 0.03
Sources: Hertz, Jayasundera, and Piraino (2007). Sources: Brzezinski (2015).
14. Educational attainment also has a bearing. Ireland performs generally well in terms of
educational attainment, and the share of students leaving school early is relatively low. However,
Ireland continues to lag EU peers in terms of young adults who are not in education, employment,
or training (NEET). Unemployment among those with low educational achievement remains elevated
(13½ percent as of 2016Q3). Although the
Young People Not in Employment, Education, or Training; 2015
provision of basic skills has improved, skill (in percent of all young people, 15-29 years)
shortages in sectors such as information and 30 30
Un employed
communication technology (ICT)—which has an 25 In active 25
impact on ICT occupations across all sectors— EU avg.
20 20
have emerged, and there is a need to further
upskill and reskill the adult population through 15 15
increased participation in further education and 10 10
training (European Commission, 2017). To guide
5 5
investment in education over the 2016–2019
period, the government launched a 0 0
DNK
ESP
EST
SWE
SVK
GBR
PRT
SVN
GRC
IRL
BEL
HUN
CZE
FIN
FRA
LVA
POL
DEU
ITA
NLD
AUT
comprehensive Action Plan for Education (2016),
which focuses on disadvantaged students and Source: OECD.
continuous improvement within the education sector.16 In addition, the National Skills Strategy aims
to provide skill development opportunities and foster lifelong learning. Prioritization of skills needs
will be overseen by the new National Skills Council. New Regional Skills Fora will facilitate ongoing
employer-educator dialogue to match identified needs with sustainable provision in each region,
with a view to optimize the return on investment in education and training (see also next Section).
16The 2017 budget envisages higher spending on education and the recruitment of more teachers in the future,
reflecting also demographic-driven needs.
12 INTERNATIONAL MONETARY FUNDIRELAND
15. Despite these reforms, some aspects of the tax-benefit system may create
disincentives to transition from welfare to work. Although Ireland provides relatively generous
social family-income support by international standards, the tax and welfare system maintains a
strong incentive to shift from welfare to work. However, some groups, particularly those with a non-
working partner and children, had high replacement rates or face steep increases in marginal tax
rates that might reduce the incentives to enter the job market (Savage and others, 2015, Callan and
other 2016). To address work disincentives, the 2015 budget introduced the “Back to Work Family
Dividend” (BTWFD), which allows families who move from welfare into work to retain 100 percent of
the Qualified Child Increase for one year, and 50 percent of the payment for an additional year. The
rollout of the “Housing Assistance Payment,” designed to enable people to take up full-time
employment and keep their housing support, is also continuing. However, concerns regarding loss
of eligibility for the medical card, which entitles the bearer to a range of free health services and to
important additional benefits for the family, is reportedly a powerful disincentive.17
C. Can Ireland’s Social Protection System Be More Effective?
16. Compared to EU peers, Ireland’s tax-benefit system is one of the most effective in
redistributing income, with variations in the contribution of the system’s components. About
60 percent of the average 25-percentage point difference in Ireland’s market- and disposable-
income Gini coefficient during the 2007–15 period was driven by social benefits, one of the highest
among EU countries and largely means-tested. Another one-fourth of the improvement was due to
direct taxes (broadly in line with the EU average), and 12 percent through pensions, the lowest in the
EU (Box 2).
Income Redistribution; 2007-15 Contributions to Income Redistribution; 2007-15
(average difference between market and disposable income Gini) (average; percent)
35 35 120 NMT social benefits MT social benefits 120
NMT social bnefits MT social benefits Pension
Pension Social insurance
Social insurance Direct taxes
30 30 Direct taxes
100 100
25 25
80 80
20 20
60 60
15 15
40 40
10 10
5 5 20 20
0 0 0 0
DNK
SWE
ESP
EST
ROM
GBR
MLT
BGR
LUX
PRT
SVK
SVN
IRL EU (avg.)
GRE
CYP
IRL
BEL
CZE
FIN
HUN
FRA
HRV
LVA
POL
DEU
LTU
ITA
NLD
AUS
Sources: Euromod; and IMF staff.
NMT = non means-tested; MT = means-tested.
17People receiving means-tested Social Welfare Allowances or with their income (and their spouse/partner’s income)
below specified thresholds qualify for a Medical Card. Any income, savings, investments and property (except for own
home) are considered in the means test (http://www.hse.ie/eng/services/list/1/schemes/mc/about/Amieligible/).
Additional benefits provided to medical-card holders comprise exemption from payment of the health portion of
social insurance (PRSI); free transportation to school for children who live 3 miles or more from the nearest school;
exemption from state examination fees in public second-level schools; and financial help with buying school books.
INTERNATIONAL MONETARY FUND 13IRELAND
Box 2. Ireland: Pensions and Social Insurance
Pensions
The Irish pension system consists of:1/ a pay-as-you-go public pension pillar supplemented by a voluntary
second pillar scheme and private pension plans. The public pension pillar comprises both contributory and
non-contributory elements. The latter is means-tested and paid to individuals without adequate means at
the age of 66. The old-age contributory pension system is financed on a pay-as-you-go basis and provides
flat-rate benefits depending on the contribution period without reference to pre-retirement earnings. The
Irish system, like in the UK, puts more emphasis on occupational pension schemes, managed by (private)
pension funds, and therefore do not affect income redistribution.2/
Social Insurance
The structure of social insurance charges is not progressive. Contributions to the Pay Related Social
Insurance (PRSI) fund pensions and a variety of other benefit payments, including disability, maternity, and
illness. The PRSI is levied at a single rate of 4 percent on gross wage income.
Important revenue-enhancing and expenditure-reducing measures have been introduced in recent
years to safeguard the financial viability of the social security system (Tax Strategy Group, 2016b). The
main revenue measures comprise increases in rates of contribution, the broadening of the base,3/ the
abolition of the employee ceiling for charging PRSI, the abolition of the PRSI relief for employee pension
contributions, and the abolition of the employee PRSI-free allowance. Expenditure savings were achieved
mainly through stricter conditions for entitlement and reductions in the level and duration of entitlement,
most notably for jobseeker and illness benefits, as well as by increasing the pension age to 66 years.4/
1/ For more details, see OECD (2014).
2/ In the Euromod model, the payment of pensions from private plans is included in market income.
3/
Since 2014, the PRSI is payable also on unearned income, such as income from investments (including bank
deposits) and rents.
4/ The state pension age will further increase to 67 years in 2021 and 68 years from 2028.
17. To better understand the social protection system in Ireland, three policy areas are
analyzed: direct taxation, active labor market policies, and social transfers.
Income Taxation
18. Personal income taxation is progressive. Those at the top decile of income earners pay
about 59 percent of total income tax, although their share of market income is about 37 percent
(Kennedy and others, 2015). The personal income tax (PIT) operates using a two-rate structure with
different thresholds depending on family type.18 While the system of tax credits supports disposable
income for low-earning households, a large share of tax allowances is enjoyed by top income
groups, notwithstanding cuts in recent years (Kennedy and others, 2015). The USC, which was
introduced in 2011, applied on a broad base, with limited relief and no credits.
18 The income tax rates are 20 percent on income within the standard band, which depends on the family type
(single, single parent, married with one earner, married with two earners) and 40 percent on income above the
standard band.
14 INTERNATIONAL MONETARY FUNDIRELAND
Average Tax by Income Decile; 2012-20151/ Tax Expenditure Cost2/
(in percent of gross income) 40 25
35 35
35 in percent of GDP (rhs)
2015
30 2014
30 20
30 in billions of euro (lhs)
2013
25 25
2012 25 15
20 20
20
15 15 10
15
10 10
10
5 5 5
5
0 0
0 0
1 2 3 4 5 6 7 8 9 10
2004 2006 2008 2010 2012 2014
Deciles
Sources: Central Statistics Office; Irish Tax and Customs Commission; Eurostat; and IMF staff.
1/ Includes tax on income and social security contributions.
2/ The 2011 increase was due to MNEs' one-off transactions.
19. However, the current structure of direct taxation suffers some shortcomings. Despite
measures to broadened it, the PIT base remains narrower and more complex than the USC base,
which the government plans to gradually phase out, as conditions allow.19 Given different but, in
both cases, relatively high entry points, some 36 percent of income earners are currently exempted
from income tax and about 29 percent from the USC. In addition, the entry to the second bracket of
the PIT occurs at a relatively low level (Tax Strategy Group, 2016a).20 This places a large tax burden
on middle-income households, undermines female labor force participation, and creates inactivity
traps for low-skilled workers.
20. A broadening of the tax base would protect public finances against adverse risks and
support priority expenditures in a sustainable manner. To this end, consideration could be given
to merging the USC into a more comprehensive PIT, with a review of the income brackets, including
the possible introduction of a third bracket to spread the burden among income earners (OECD,
2015). Potential revenue losses could be compensated by decreasing the number of products with
reduced and zero VAT rates and by aligning self-assessed property values, from which the local
property tax is calculated, to market values. Regressivity from these changes could be addressed by
means-tested transfers to low-income households.21 A thorough review of the system of tax
expenditure would also support revenue enhancement.
Labor Market Policies
21. With long-term unemployment still higher than pre-crisis levels and the need to bring
more people to better paying jobs, labor market policies (LMPs) are key. To reduce joblessness
and get the long-term unemployed back to work, Ireland has introduced several labor market
19
With the 2017 budget, the government reduced of the three lowest USC rates by 0.5 percent (from 1 percent to 0.5
percent; from 3 percent to 2.5 percent; from 5.5 percent to 5 percent).
20 The standard rate band threshold for a single individual, €33,800, is now below the national average wage, €36,815.
21 Lydon (2017) notes high low-income home-ownership in Ireland means local property tax tend to be regressive.
INTERNATIONAL MONETARY FUND 15IRELAND
training and activation measures. Pathways to Work is the overarching strategy to increase the
engagement of mainly long-term and young jobseekers. There have been changes in the
organization of programs, particularly regarding the interaction among income support for the
unemployed, education and training options, and employment support programs (OECD, 2016):
Intreo, a Department of Social Protection “one-stop-shop” service, provides an integrated
system of social welfare income benefits, community welfare services, and employment supports
through its local offices.
Sixteen Education and Training Boards resulted from consolidation of 33 Vocational Education
Committees, with responsibility for education and training, youth work, and other functions.
A Local Development Committee has been established in each of the 31 local authority areas,
with a view to improving the efficiency and integration in the delivery of local services.
22. Although Ireland devotes significant resources to LMPs, the results have been mixed.
Reflecting the crisis-driven surge in unemployment, Ireland’s spending for LMPs rapidly increased to
over 3 percent of GDP. With the start of the recovery, LMP expenditure scaled back but remains
above the EU average. Nonetheless, the share of jobseekers (registered with Public Employment
Services) participating in activation programs is low compared to the best performers in terms of
LMPs (Denmark, Sweden, the Netherlands). Also in terms of spending per LMP participant, Ireland
does not compare favorably. The number of jobseekers for each caseworker in the Public
Employment Services, although declining from 800 in 2013 to 500 in 2015, remains relatively high
and above what is considered best practices (OECD, 2015).
Labor Market Policy Expenditure Participants to LMPs (Categories 2-7)
(percent of GDP) (in percent of registered jobseekers)
4.0 4.0
Labour market services
80 80
3.5 3.5
Active measu res 2-7 70 70
3.0 Passive measures 8-9 3.0
60 60
2.5 2.5 50 50
IRL
2.0 EU 2.0 40 40
avg.
1.5 1.5 30 30
1.0 1.0 20 20
IRL
0.5 0.5 10 10
Avg. DNK, NLD, SWE
0.0 0.0 0 0
2004 2007 2010 2013 2004 2006 2008 2010 2012 2014
Sources: Eurostat; and IMF staff.
23. Existing schemes continue to be evaluated to ensure that scarce resources are
channeled to the most effective programs. As part of the Pathways to Work program, the
Department of Social Protection is reviewing the current range of labor market programs. A first
review of the Back to Education Allowance raised concerns about its effectiveness in assisting
jobseekers to return to work (Lawless and Reilly, 2016). An evaluation of the Intreo “one-stop-shop”
services for jobseekers is currently underway. A comprehensive assessment would also be useful to
16 INTERNATIONAL MONETARY FUNDIRELAND
streamline the numerous initiatives with a view to using scarce resources more effectively. Reducing
the number of jobseekers per caseworker may also help improve service effectiveness.
Social transfers
24. Ireland’s total spending on social protection benefits is in line with the EU average but
still sizeable for public finances. Measured in purchasing powers standards, Ireland’s cash social
benefit spending in per-capita terms is broadly in line with the simple average of EU countries.22
However, it absorbs a larger share of general government’s total revenue.23 If spending for pensions
is excluded, Ireland’s per-capita spending results somewhat higher than the EU average.
Social Portection Benefits - Cash Social Protection Benefits - Cash (excl. Pensions)
(in purchasing power standards per head) (in purchasing power standards per head)
12,000 12,000 4,500 4,500
4,000 EU max. 4,000
10,000 EU max. 10,000
3,500 3,500
8,000 8,000 3,000 3,000
2,500 IRL 2,500
6,000 6,000
2,000 2,000
GBR GBR
4,000 4,000 1,500 1,500
EU avg.
IRL 1,000 EU avg. 1,000
2,000 2,000
500 500
EU min. EU min.
0 0 0 0
2004 2006 2008 2010 2012 2014 2004 2006 2008 2010 2012 2014
Sources: Eurostat; and IMF staff.
Social Protection Benefits - Cash Social Protection Benefits - Cash
(in percent of general government primary expenditure) (in percent of general government revenue)
50 50 55 80
50 70
EU max. EU max.
45
40 GBR 40 60
IRL
40
EU avg. 50
35 GBR
30 IRL 30 40
30
EU min. EU avg.
25 30
EU min.
20 20 20 20
2004 2006 2008 2010 2012 2014 2004 2006 2008 2010 2012 2014
Sources: Eurostat; and IMF staff.
22 Social benefits in cash account for about 60 percent of total social protection spending; lower than the EU average.
23A similar picture emerges if also in-kind social benefits are considered. In this case, Ireland’s social spending
accounts for a slightly larger share of general government primary expenditure than the EU simple average.
INTERNATIONAL MONETARY FUND 17IRELAND
25. Ireland stands out relative to
Social Transfers Incidence by Decile; 2015
comparators in targeting social spending on (in percent of gross income)
90 90
poor households. Almost a third of the social Other tran sfers
80 80
transfers in Ireland is means-tested, the second Occupational pen sion s
70 70
largest share in the EU. For the bottom two 60 60
deciles, social transfers make up about three- 50 50
quarters of total income, with more than half of 40 40
these transfers related to unemployment 30 30
benefits and family-children allowances. If all 20 20
10 10
social benefits are considered, including
0 0
pensions, Ireland’s welfare system is more 1 2 3 4 5 6 7 8 9 10
focused on poverty reduction (as measured by Deciles
the difference between the share of population Sources: Central Statistics Office; and IMF staff.
at risk of poverty before and after transfers) than on income redistribution (as measured by the
difference between market and disposable income). However, if pensions are excluded, Ireland’s
efficiency in redistributing income and fighting poverty is well-above EU peers. This result suggests
that the degree of income redistribution that other EU countries achieve through pension spending,
Ireland realizes through social benefits.
Income Redistribution and Social Benefits At-Risk-of-Poverty and Social Benefits
(averages) (averages)
20 20 40 40
2/
1/
2007-14 CZE FIN DEU 2007-14
Improv. At-Risk-of Poverty du to SB (p.p.)
Improvement Gini coeff. du to SB (p.p.)
18 BEL 18 35 IRL 35
IRL AUS FRA
lower income inequality
FRA
lower at-risk of poverty
SWE
CZE FIN AUS
16 DNK 16 30 30
SWE DEU
ESP GBR
14 14 25 DNK 25
ITA
PRT
PRT GBR NLD
ITA BEL
12 12 20 20
NLD ESP
10 10 15 15
8 8 10 10
0 2,000 4,000 6,000 8,000 10,000 0 2,000 4,000 6,000 8,000 10,000
Social benefits per head (in purchasing power standard) Social benefits per head (in purchasing power standard)
Sources: Euromod; Eurostat; and IMF staff.
1/ Changes in the Gini coefficient due to pensions and social benefits. Changes have an inverted sign, in other words larger positive values
indicate a lower Gini coefficient after social transfers (including pensions) and hence a more equitable income distribution.
2/ Risk-of-poverty treshold set at 60 percent of the national median equivalized disposable income. Changes have an inverted sign, in other
words larger positive value indicate a larger decline in the at-risk-of-poverty ratio due to social transfers (including pensions).
18 INTERNATIONAL MONETARY FUNDIRELAND
Income Redistribution and Social Benefits (excl. Pensions) At-Risk-of-Poverty and Social Benefits (excl. Pensions)
(averages) (averages)
16 16 25 25
2/
1/
2007-14 2007-14
Improv. At-Risk-of Poverty du to SB (p.p.)
Improvement Gini coeff. du to SB (p.p.)
14 IRL 14 IRL
20 20
lower income inequality
lower at-risk of poverty
12 12
GBR FIN
SWE DNK
10 10 15 15
DNK AUS
FIN NLD
8 FRA 8 CZE GBR BEL
SWE
6 DEU 6 10 10
FRA NLD
ESP
4
CZE
BEL 4 PRT ESP DEU
AUS 5 5
2 PRT ITA 2 ITA
0 0 0 0
0 1,000 2,000 3,000 4,000 0 1,000 2,000 3,000 4,000
Social benefits per head (in purchasing power standard) Social benefits per head (in purchasing power standard)
Sources: Euromod; Eurostat; and IMF staff.
1/ Changes in the Gini coefficient due to social benefits (excluding pensions). Changes have an inverted sign, in other words larger positive
values indicate a lower Gini coefficient after social transfers (excluding pensions) and hence a more equitable income distribution.
2/ Risk-of-poverty treshold set at 60 percent of the national median equivalized disposable income. Changes have an inverted sign, in other
words larger positive value indicate a larger decline in the at-risk-of-poverty ratio due to social transfers (excluding pensions).
D. Conclusions
26. Ireland’s tax-benefit system is effective in redistributing income and alleviating
poverty. Despite the severe financial crisis and substantial budget cuts, the government succeeded
in preserving most of welfare expenditure, which provided an important cushion for people against
the worst effects of the crisis. A relatively progressive tax system funds a robust system of social
transfers, a significant share of which is means-tested. The system of social transfers is particularly
efficient in redistributing income and reducing the share of population at risk of poverty. During the
crisis, the elderly were shielded more than younger generations, which are also facing more
precarious job opportunities than before the crisis, although it remains unclear whether this
represents a structural change. Despite the ongoing economic recovery, important structural
challenges persist, particularly regarding intergenerational (and regional) disparities.
27. A multi-pronged approach is called for to reinforce more inclusive growth. To get more
people into better paying jobs, unemployed workers need support to upskill and reskill through
continued and more effective active labor market policies. More broadly, education paths need to
be better aligned with market needs, while providing equal opportunities for disadvantaged
children. Revising personal income taxation, supporting transition to work through additional
(temporary) in-work benefits, and improving childcare availability and affordability will also support
incentives for transition to work. These measures might contribute to mitigating market-income
inequality thus reducing the pressure on the welfare system.
INTERNATIONAL MONETARY FUND 19IRELAND
References
Bargain O., T. Callan, K. Doorley, and C. Keane, 2015, “Changes in Income Distributions and the Role
of Tax-benefit Policy During the Great Recession: An International Perspective”, Fiscal
Studies, Accepted Author Manuscript. http://onlinelibrary.wiley.com/doi/10.1111/1475-
5890.12113/full.
Callan T., B. Colgan, C. Logue, M. Savage, and J.R. Walsh, 2015, “Distributional Impact of Tax, Welfare
and Public Service Pay Policies: Budget 2016 and Budgets 2009–16, The Economic and Social
Research Institute, Dublin, Special Article. http://www.esri.ie/publications/distributional-
impact-of-tax-welfare-and-public-service-pay-policies-budget-2016-and-budgets-2009-
2016/.
Callan T., C. O’Dea, B. Roantree, and M. Savage, 2016, “Financial Incentives to Work: Comparing
Ireland and the UK”, The Economic and Social Research Institute, Dublin, Budget
Perspectives 2017, Paper 2, June. https://www.esri.ie/pubs/BP201702.pdf.
Chen, T., A. Giustiniani, J.J. Hallaert, A. Pitt, H. Qu, M. Queyranne, A. Rhee, A. Shabunina, J.
Vandenbussche, and I. Yackovlev, 2017, “Intergenerational Inequality and Poverty in Europe,”
mimeo.
Dukelow, F. and M. Considine, 2014, “Between Retrenchment and Recalibration: The Impact of
Austerity on the Irish Social Protection System”, The Journal of Sociology & Social Welfare,
Vol. 41, Issue 2, June.
European Commission, 2017, “Country Report Ireland - Including an In-Depth Review on the
prevention and correction of macroeconomic imbalances”, Brussels, 22.2.2017, SWD(2017)
73 final. https://ec.europa.eu/info/publications/2017-european-semester-country-
reports_en.
Esping-Andersen, G., 1990, The Three Worlds of Welfare Capitalism, Cambridge: Polity Press.
Esping-Andersen G., and J. Myles, 2007, “The Welfare State and Redistribution”, mimeo.
https://www.researchgate.net/publication/255583959_The_Welfare_State_and_Redistribution
Farrel, C.J., 2016, “A Survey of Social benefits in Ireland”, Public Policy.ie.
http://www.publicpolicy.ie/wp-content/uploads/A-Survey-of-the-Benefit-System-in-Ireland-
2016.pdf.
Hardiman, N., 2006, “Politics and Social partnership – Flexible network Governance” Economic and
Social review, Vol. 37, issue 3, pp. 343–374.
http://econpapers.repec.org/article/esojournl/v_3a37_3ay_3a2006_3ai_3a3_3ap_3a343-
374.htm.
20 INTERNATIONAL MONETARY FUNDIRELAND
International Monetary Fund, 2016, “Ireland—Selected Issues”, Washington D.C.
http://www.imf.org/~/media/websites/imf/imported-full-text-
pdf/external/pubs/ft/scr/2016/_cr16257.ashx.
Kennedy S., Y. Jin, D. Haugh, and P. Lenain, 2015, “Taxes, income and economic mobility in Ireland:
New evidence from tax records data”, OECD Economics Department Working Papers No.
1269, OECD Publishing, Paris. http://dx.doi.org/10.1787/5jrqc6zlgq31-en.
Klein, N., 2017, “Household Deleveraging in Ireland”, Selected Issues Paper, Ireland—2017 Article IV
Consultation.
Lawless J., and D. Reilly, 2016, “Social Impact Assessment Framework”, Irish Government Economic &
Evaluation Service, Staff Paper 2016, April, Department of Public Expenditure and Reform,
Dublin. http://igees.gov.ie/wp-content/uploads/2016/10/SIA-Framework-Final-101016.pdf.
Lydon, R., 2017, “Income Inequality and Welfare System in Ireland—Discussion”, Central Bank of
Ireland Seminar May 8, 2017, mimeo.
McLaughlin, E., 1993, “Ireland: Catholic Corporatism”, in: A. Cochrane and J. Clarke (eds.) Comparing
Welfare States: Britain in International Context,” Sage, London.
OECD, 2015, “Economic Surveys: Ireland 2015”, OECD Publishing, Paris.
http://dx.doi.org/10.1787/eco_surveys-irl-2015-en.
OECD, 2016, “Weaving Together Policies for Social Inclusion in Ireland”, OECD Publishing, Paris.
http://dx.doi.org/10.1787/9789264252677-en.
OECD, 2016, “Skills Matter: Further Results from the Survey of Adult Skills”, OECD Skills Studies,
OECD Publishing, Paris. http://dx.doi.org/10.1787/9789264258051-en.
Podpiera, J., 2017, “Ireland: The Role of Foreign-Owned Multinational Enterprises,” Selected Issues
Paper, Ireland—2017 Article IV Consultation.
Savage M., T. Callan, B. Nolan, and B. Colgan, 2015, “The Great Recession, Austerity and Inequality:
Evidence from Ireland”, The Economic & Social Research Institute, Dublin, Working paper
No. 499, April. http://www.esri.ie/pubs/WP499.pdf.
TASC, 2015, “Cherishing All Equally: Economic Inequality in Ireland”, TASC – Think-thank for Action
and Social Change, Dublin.
http://www.tasc.ie/download/pdf/tasc_cherishing_all_equally_web.pdf.
Tax Strategy Group, 2016a, “Income Tax & Universal Social Charge”, Department of Finance
http://www.finance.gov.ie/sites/default/files/160714-TSG%2016-05%20-
Income%20Tax%20and%20USC%20paper.pdf.
INTERNATIONAL MONETARY FUND 21You can also read