IRELAND VOCATIONAL EDUCATION AND TRAINING IN EUROPE - VET IN EUROPE REPORTS I 2018 - Refernet
←
→
Page content transcription
If your browser does not render page correctly, please read the page content below
VOCATIONAL EDUCATION
AND TRAINING IN EUROPE

IRELAND

           VET IN EUROPE REPORTS I 2018
Please cite this publication as:
 Burke N.; Condon, N.; Hogan A.; (2019). Vocational education and training in Europe
 – Ireland. Cedefop ReferNet VET in Europe reports 2018.
 http://libserver.cedefop.europa.eu/vetelib/2019/Vocational_Education_Training_Europ
 e_Ireland_2018_Cedefop_ReferNet.pdf

Authors: Nina Burke, Nora Condon and Annemarie Hogan
Contributors: Caroline Shally
Validated by: John McGrath, Ireland national representative for ReferNet
Peer-reviewed by Zdenka Simova and Martina Kaňáková, NÚV - National Institute for
Education, Education Counselling Centre, and Centre for Continuing Education of
Teachers (Cedefop ReferNet Czechia)

Reviewed by Nikolaos Georgiadis, Cedefop
© SOLAS – Further Education and Training Authority (Cedefop ReferNet Ireland), 2018
Reproduction is authorised, provided the source is acknowledged.

This VET in Europe report is part of a series prepared by Cedefop’s ReferNet network.

VET in Europe reports provide an overview of national vocational education and training
(VET) systems of the EU Member States, Iceland and Norway. The reports help to
understand VET’s main features and role within countries’ overall education and training
systems from a lifelong learning perspective, and VET’s relevance to and interaction with
the labour market.
VET in Europe reports follow a common Cedefop format. They are available at
http://libserver.cedefop.europa.eu/vetelib/2019/Vocational_Education_Training_Europe_Ir
eland_2018_Cedefop_ReferNet.pdf

The opinions expressed here do not necessarily reflect those of Cedefop.

VET in Europe reports are co-financed by the European Union and ReferNet national
partners.

ReferNet is a network of institutions across Europe representing the 28 Member States,
plus Iceland and Norway. The network provides Cedefop with information and analysis on
national vocational education and training. ReferNet also disseminates information on
European VET and Cedefop’s work to stakeholders in the EU Member States, Iceland
and Norway.
http://www.cedefop.europa.eu/en/events-and-projects/networks/refernet

      /Cedefop                              @cedefop                           refernet

                                           1
Table of contents

CHAPTER 1. External factors influencing VET .....................................................5

  1.1 Introduction ................................................................................................ 5
  1.2 Population .................................................................................................. 6
  1.3 The labour market ...................................................................................... 8
      1.3.1 Labour market status of the population.............................................. 8
      1.3.2 Labour force by education attainment levels.................................... 11
      1.3.3 Participation in the labour force by education attainment ................. 11
  1.4 The economy ........................................................................................... 13
      1.4.1 Performance of the Irish economy: longitudinal trends in GDP and
             GNP.............................................................................................. 13
      1.4.2 Employment by economic sector ..................................................... 14
  1.5 Regulation of the labour market ............................................................... 15
       1.5.1 Introduction ..................................................................................... 15
       1.5.2 Welfare and employment policies relating to VET............................ 16
             1.5.2.1 Pathways to work ................................................................ 16
             1.5.2.2 Action plan for jobs .............................................................. 17
             1.5.2.3 Employment support scheme (ESS) .................................... 18
             1.5.2.4 Springboard+....................................................................... 18
             1.5.2.5 FET Professional development strategy 2017/19 ................ 19

CHAPTER 2. Provision of VET ...........................................................................20

  2.1 Ireland’s education and training system ................................................... 20
      2.1.1 Primary education ......................................................................... 20
      2.1.2 Secondary education .................................................................... 20
      2.1.3 Further Education and Training (FET) ........................................... 21
      2.1.4 Tertiary education ......................................................................... 22
  2.2 Government regulated VET ...................................................................... 25
       2.2.1 Apprenticeship ................................................................................ 25
             2.2.1.1 Pre-2016 craft apprenticeship.............................................. 27
             2.2.1.2 Post 2016 apprenticeship .................................................... 27
       2.2.2 Traineeships.................................................................................... 28
       2.2.3 Specific skills training ...................................................................... 29
       2.2.4 Post Leaving Certificate................................................................... 30
       2.2.5 Vocational training opportunities scheme courses ........................... 30
       2.2.6 Access/Routes to VET..................................................................... 31

                                                         2
2.2.7 Progression from VET ..................................................................... 32
      2.2.8 The SOLAS follow-up survey 2016 .................................................. 33
      2.2.9 Post leaving certificate (PLC) completers research ......................... 34
      2.2.10 QQI (FET) learners ........................................................................ 35
  2.3 Other forms of training.............................................................................. 35
  2.4 VET funding ............................................................................................. 36
  2.5 VET governance ...................................................................................... 37
  2.6 VET teachers, trainers and tutors ............................................................. 37

CHAPTER 3. Shaping VET Qualifications ..........................................................40

  3.1 Anticipating Skills Needs .......................................................................... 40
      3.1.2 The National Skills Council .............................................................. 40
      3.1.2. The expert group on future skills needs .......................................... 42
      3.1.3. The Skills and Labour Market Research Unit .................................. 42
      3.1.4. The regional skills fora.................................................................... 44
      3.1.5. The Skills Planning and Enterprise Engagement Unit ..................... 45
      3.1.6 Identified skills shortages in Ireland ................................................. 45
      3.1.7 Award standards ............................................................................. 47
  3.2 Quality assurance .................................................................................... 48
      3.2.1 Employability statements ................................................................. 49
  3.3 Recognition of Prior Learning ................................................................... 49

CHAPTER 4. Promoting participation in VET .....................................................51

  4.1 Incentives for VET learners ...................................................................... 51
      4.1.1 Financial Incentives to learners ....................................................... 51
      4.1.2 Positive employability outcomes ...................................................... 52
  4.2 Incentives for enterprises ......................................................................... 52
  4.3 VET guidance and counselling ................................................................. 53

List of acronyms and abbreviations ....................................................................58

Annex 1 ..............................................................................................................60

  1.1 Demand indicators ................................................................................... 60
  1.2 Supply indicators: ..................................................................................... 60

                                                          3
List of figures and tables
Figures
Figure 1 Population (000s) by age group, 2012 and 2017 ................................... 7
Figure 2 Net migration estimates (000s) by age group (0-64), 2011-2017 ........... 8
Figure 3 Irish population by age & economic status, quarter 4, 2017 .................. 9
Figure 4 Labour force, employment & unemployment (000s), annual averages 10
Figure 5 Ireland’s labour force (000s) by highest level of education(), Q4 2017. 11
Figure 6 Labour force participation rate (%) by education attainment, Q4 2017. 12
Figure 7 Labour force participation rate (%) by gender & education
attainment, Q4 2017 ........................................................................... 13
Figure 8 Employment by sector (000s), quarter 4 2017 .................................... 15
Figure 9 VET in Ireland’s education and training system .................................. 24
Figure 10 Composition of Ireland’s National Skills Council ................................ 41
Figure 11 Bodies supporting the work of the National Skills Council .................. 42
Figure 12 Demand and supply indicator data held in the National Skills
Database .......................................................................................... 43
Tables
Table 1 Estimated Population (‘000s) classified by sex & age group, April 2017 . 6
Table 2 Labour force, Unemployed, Unemployment rates, participation rates ... 11
Table 3 Gross Domestic Product (GDP) Gross National Product (GNP)
Gross National Income (GNI)................................................................ 14
Table 4 Real minimum wages – hourly (in 2017 US dollars).............................. 16
Table 5 Full-time enrolments in Irish education and training system .................. 20
Table 6 Characteristics of main VET programmes (current) in Ireland ............... 25
Table 7 Summary of access to VET .................................................................. 32
Table 8 Current economic status of training course completers ........................ 34
Table 9 PLC Students classified by destination in 2011 ................................... 34
Table 10 Destination of QQI (FET) certificate holders in 2010 ........................... 35
Table 11 Summary VET teacher/trainer categories ........................................... 39
Table 12. List of shortages identified in Ireland 2018 ......................................... 45
4CHAPTER 1. External factors influencing VET
1.1 Introduction
The Republic of Ireland comprises twenty-six of the thirty-two counties of the
island of Ireland. The remaining six counties make up Northern Ireland which is
part of the United Kingdom. The total area of the Republic of Ireland is 84 421
km2. The major centre of population is Dublin (city and county) and the other
major cities are Cork, Galway and Limerick.
Overall responsibility for education and training lies with the Department
(Ministry) of Education and Skills (DES): a number of bodies, operating under the
aegis of the DES, have responsibilities for different aspects of the education and
training system; these include, among others:
(a) the Higher Education Authority (HEA), which is responsible for the
effective governance and regulation of tertiary education institutions
and the tertiary education system;
(b) SOLAS, which is Irelands Further Education and Training (FET)
authority, responsible for planning, co-ordinating and funding FET in
Ireland
(c) Quality and Qualifications Ireland (QQI), which has a range of
responsibilities including:
• maintaining the ten-level National Framework of Qualifications
(NFQ)
• making awards and setting standards for FET programmes and
some tertiary level education programmes (outside the university
sector)
• reviewing the effectiveness of quality assurance in FET and higher
education providers in Ireland;
(d) the National Skills Council (NSC) was set up in 2017 by the
Department of Education and Skills to assist Ireland in anticipating
and responding to skills needs across economic sectors;
(e) the expert group on future skills needs, which is based in the
Department of Business, Enterprise and Innovation, advises the Irish
government on current and future skills needs of the economy and on
other labour market issues that impact on Ireland’s enterprise and
employment growth.
51.2 Population
Table 1 shows the estimated Irish population classified by sex and age group in
April 2017. All percentage figures refer to the total population. The table indicates
that 21% of the population are less than 15 years old, while 13% are aged 65
years or older. This gives a total dependency ratio of 52%, and an old age
dependency ratio of 13/66 = 20%. The Irish old age dependency ratio ( 1) has
been projected to rise sharply over the coming decades and reach almost 45%
by 2050 ( 2).
Table 1. Estimated population (‘000s) classified by sex & age group, April 2017
Persons Total Males Females
years 000s % 000s % 000s %
0–4 324.6 6.8 166.1 3.5 158.5 3.3
5–9 359.1 7.5 183.1 3.8 176.0 3.7
10–14 323.3 6.8 165.6 3.5 157.8 3.3
15–19 308.5 6.4 157.6 3.3 151.0 3.1
20–24 276.3 5.8 140.4 2.9 135.9 2.8
25–29 292.4 6.1 144.3 3.0 148.2 3.1
30–34 347.9 7.3 166.3 3.5 181.6 3.8
35–39 394.6 8.2 192.7 4 201.9 4.2
40–44 363.1 7.6 180.1 3.8 183.0 3.8
45–49 333.1 7.0 166.2 3.5 166.9 3.5
50–54 303.3 6.3 150.1 3.1 153.2 3.2
55–59 274.0 5.7 135.9 2.8 138.2 2.9
60–64 242.3 5 120.5 2.5 121.8 2.5
65–69 211.3 4.4 104.8 2.2 106.4 2.2
70–74 169.2 3.5 82.9 1.7 86.3 1.8
75–79 116.8 2.4 55.1 1.1 61.7 1.3
80–84 82.9 1.7 36.2 0.7 46.6 1
85+ 69.0 1.4 24.3 0.5 45.3 0.9
Total 4 791.7 100% 2 372.2 2 420.3
Source: Central Statistics Office (CSO) statistical release, Population and Migration Estimates, 2017
1
( ) The ratio between the number of persons aged 65 and more over the number of
persons of working age (15-64).
2
( ) Eurostat, proj_15ndbims [extracted on 24.01.2019]
6Ireland’s population is 4 838 259 (2018) ( 3). Figure 1 compares the
population aged 0-74 years in 2012 and 2017. The overall population in Ireland
has increased over this time period. Individuals in the cohorts aged between 20
to 34 years declined, a reflection of both a decreased number of births in earlier
years (from the mid-1980s onwards) as well as high outward migration observed
among young people during the recession. Those aged 5 to 19 years observed
an increase in population over this time period, due mainly to an increase in the
number of births in earlier years. As many learners enter the VET system from
the age of 18 onwards, it is likely this increase in the young population will impact
on the number of upper secondary school completers entering the VET system
and increase the demand for places across all sectors of the education and
training system, including VET. Those aged 0-4 have observed a decrease in
population.
Figure 1. Population (000s) by age group, 2012 and 2017
450
400
350
300
250
2012
200
2017
150
100
50
0
0–4
65-69
70-74
10–14
15–19
20–24
25–29
30–34
35–39
40–44
45–49
50–54
55–59
60–64
5–9
Source: CSO Population and Migration Estimates 2017
Figure 2 shows net migration estimates by age group (0-64 years). While
total migration over the period 2011-15 remained negative, in 2016, those aged
25-44 and 45 - 64 saw the first positive change in migration. Outward migration is
shown to have negatively affected those aged 15-24 and 25-44 far more than any
other age group. According to figures produced by the Central Statistics Office
(CSO), over the period of 2012-17, net outward migration among Irish Nationals
3
( ) Eurostat, tps00001 and proj_15ndbims; provisional data as of 1 January [Extracted on
28.01.2019 and 24.01.2019].
7observed a decrease of 88.5%. Net inward migration of Irish nationals was
estimated to be +23 200 in 2017.
Figure 2. Net migration estimates (000s) by age group (0-64), 2011-2017
15
10
5
0 - 14 years
15 - 24 years
0
25 - 44 years
-5 45 - 64 years
-10
-15
2012 2013 2014 2015 2016 2017
Source: CSO Population and Migration Estimates April 2017
Estimated Migration (Persons in April) by Age Group, Sex, Inward or Outward Flow
1.3 The labour market
The Labour Force Survey (LFS) is a large-scale, nationwide survey of
households in Ireland. It is designed to produce quarterly labour force estimates
that include the official measure of employment and unemployment in the state
(ILO basis). This survey is conducted by the Central Statistics Office (CSO). The
LFS replaced the Quarterly National Household Survey (QNHS) from quarter 3
2017.
1.3.1 Labour market status of the population
Figure 3 shows the labour market status of persons living in Ireland. In quarter 4
2017, the working age population (persons aged 15-64) was 3 million. Of these,
1.98 million persons of working age were in employment. Approximately 1 million
persons of working age were not in employment. Of the working age population
not in employment, just over 146 600 were unemployed and 891 600 were
economically inactive (4).
(4)
Economically inactive are defined as persons who are not in employment or
unemployed (actively seeking work).
8Figure 3. Irish population by age & economic status, quarter 4, 2017
Population
4 700 100
Children (Unemployment levels in Ireland increased sharply at the beginning of the
economic crisis, going from approximately 100 000 persons in 2007 to almost
317 000 in 2011; since then, however, unemployment levels have been
decreasing. In quarter 4, 2017, there were 144 100 unemployed persons in
Ireland. Ireland’s unemployment rate (15-74) currently stands at 6.7% ( 5), a slight
decline from the same quarter in 2016 (7.2%). This is a considerable change
from quarter 4 2011 where Ireland’s unemployment rate stood at 15.3%.
Figure 4. Labour force, employment & unemployment (000s), annual averages
2400 350
2200 300
Labour Force and Employment
2000 250
Unemployment
1800 200
1600 150
1400 100
1200 50
1000 0
2012
2013
2014
2015
2016
2017f
2018f
Labour force Employment Unemployment
Source: SLMRU analysis of CSO (QNHS data)
Table 2 shows the number participation and unemployment rates along
with the numbers of unemployed persons and those in the labour force over a 4
year period. Participation rates have steadily increased over each quarter.
Unemployment rates and the number of unemployed persons observed a sharp
decrease between quarter 4 2014 and quarter 4, 2016. Unemployment continued
to decrease to quarter 4, 2017, however with a less pronounced change.
Numbers in the labour force have steadily risen over the time period.
5
( ) Eurostat, tps00203 [Extracted on 25.01.2019]
10Table 2. Labour force, Unemployed, Unemployment rates, participation rates
2014Q4 2015Q4 2016Q4 2017Q4
ILO Participation Rates (15 years and
over) (%) 61.6 61.8 61.9 62.2
ILO Unemployment Rates (15 - 74
years) (%) 10.5 9.1 7.2 6.1
Unemployed 235.3 206.8 167.6 144
In labour force 2260.5 2292.2 2331.1 2374.8
Source: SLMRU analysis of CSO (QNHS data)
1.3.2 Labour force by education attainment levels
Figure 5 shows the breakdown of Ireland’s labour force by highest education
level attained. In quarter 4, 2017, 47% of Ireland’s labour force held third level
qualifications; 14% held post-secondary non-tertiary level education, and 36%
held higher secondary or below.
Figure 5. Ireland’s labour force (000s) by highest level of education( 6), Q4 2017
3% 3%
Primary or below
9% Lower secondary
Upper secondary
36%
24%
Post secondary non-tertiary
3rd level non-honours* degree
11% 14%
3rd level honours* degree or above
Other/not stated
Source: CSO (QNHS) supplementary tables
*In Ireland, there are two types of bachelor degree: an honours bachelor degree (NFQ 8) or an ordinary
bachelor degree (NFQ 7). Both honours and ordinary bachelor degrees have been referenced to the European
Qualifications Framework at EQF level 6.
1.3.3 Participation in the labour force by education attainment
Figure 6 shows the labour force participation rate by education attainment. In
general, labour force participation rates increase with greater educational
attainment: individuals with third level qualifications are more than twice as likely
(6)
Education data is presented according to ISCED (2011) levels of education attainment;
rd
3 level non-honours degree programmes typically lead to qualifications spanning
rd
national framework of qualifications 6-7 (EQF level 5-6); 3 level honours degree
programmes typically lead to qualifications at national framework of qualifications 8-10
(EQF levels 6-8).
11to be in the labour force compared to those with, at most, primary level
qualifications. In addition, those with post-secondary non-tertiary education
(where most VET graduates are classified) have a higher than average
participation rate.
Figure 6. Labour force participation rate (%) by education attainment, Q4 2017
100 89.2
90 84.8
80.2
80 70.1 70.5
70
60
46.3
50
40 33.1
30
20
10
0
Primary or Lower Upper Post 3rd level 3rd level Other/not
below secondary secondary secondary non-hons hons stated
non-tertiary degree degree or
above
Source: CSO (QNHS) supplementary tables
Figure 7 shows the labour force participation rate by gender and
education attainment in quarter 4, 2017. Participation rates for females with a low
level of educational attainment are almost half that of males with the same level
of education. While participation rates for males and females increase with the
level of education, labour force participation of females remains less than their
male counterparts.
12Figure 7. Labour force participation rate (%) by gender & education attainment,
Q4 2017
100 90 93
88 86
90 80
78 76
80 73
70 66
58 62
60
50 42
40 31
30 23
20
10
0
Male Female
Source: CSO (QNHS) supplementary tables
1.4 The economy
1.4.1 Performance of the Irish economy: longitudinal trends in GDP and
GNP
Economic growth in Ireland in 2017 observed an increase in both Gross
Domestic Product (GDP) and Gross National Product (GNP) (see Table 2
above). GDP increased by 7.2% in constant prices while GNP rose by 4.4% in
2017, all sectors in the Irish economy observed growth with construction and ICT
observing the highest increases at 15.2% and 16.0% respectively.
According to the Irish Central Bank ( 7), the Irish economy has continued
to grow solidly and this is supported by the strength of activity on the domestic
side of the economy.
The outlook for the Irish economy remains positive according to the
central bank ( 8) analysis in quarter 3, 2018. GDP growth for 2017 was 7.2% with
7
( )Central Bank of Ireland (2018). 2017 Central bank annual report.
https://www.centralbank.ie/docs/default-source/publications/corporate-reports/annual-
reports/2017-central-bank-annual-report.pdf?sfvrsn=4
13a forecast of growth in 2018 at 4.7% and moderating to 4.2% in 2019. GNP is
also expected to expand, with projected growth of 4.2% in 2018 and 4.0% in
2019. The modified Gross National Income in 2017 observed growth at 3.0% in
2017.
Employment is expected to grow by 1.8% in 2017 according to the central bank
forecasts.
Table 3. Gross Domestic Product (GDP) Gross National Product (GNP) Gross
National Income (GNI)
(% change)
2016 2017 2018f 2019f
Real Economic Activity
Gross Domestic Product GDP 5.1 7.8 4.8 4.2
Gross National Product GNP 9.6 6.6 4.4 3.9
Source: Central Bank quarterly bulletin Q2 2018
1.4.2 Employment by economic sector
Figure 8 shows national employment by broad economic sector in Ireland in
quarter 4 2017. The highest numbers of persons were employed in wholesale &
retail, human health and industry, making up 13.8%, 12.8% and 12.6% of
national employment respectively. The vast majority of those employed in
industry are employed in the manufacturing sector; the remainder are employed
in utilities and extraction and mining. In quarter 4, 2017, 89.3% of industrial
employment was in manufacturing (250 600) with utilities and extraction / mining
accounting for 9% and 2% respectively. When manufacturing employment is
further broken down by technological intensity, low technology manufacturing
accounted for 39% of total manufacturing employment, followed by high
technology (26%), medium-high (19%) and medium-low (16%) ( 9).
8
( ) Central Bank of Ireland (2018). Quarterly bulleting Q3 2018.
https://www.centralbank.ie/docs/default-source/publications/quarterly-bulletins/qb-
archive/2018/quarterly-bulletin---q3-2018.pdf?sfvrsn=10
(9)
High technology: pharmaceuticals, computers, etc. (NACE 21,26); Medium-high:
chemicals, electrical equipment, machinery, medical instruments, etc. (NACE 20,27-30);
Medium-low: petroleum products, rubber and plastic, other non-metallic mineral products,
fabricated metal products etc. (NACE 19,22-25,33); Low technology: food, beverages,
textiles, leather, wood, paper, printing, etc. (NACE 10-18,31,32).
14Figure 8. Employment by sector (000s), quarter 4 2017
Wholesale & retail 308.1
Human health 281.0
Industry 282.7
Education 167.6
Accommodation & food 168.7
Professional activities etc. 135.2
Construction 133.4
Agriculture etc. 111.7
Financial etc. 106.2
Other NACE activities 120.1
Public admin & defence 101.7
Transportation 95.1
ICT 116.1
Administrative activities 94.7
0 100 200 300
Source: SLMRU (SOLAS) analysis of CSO data
1.5 Regulation of the labour market
1.5.1 Introduction
In terms of labour market regulation, Ireland’s regulatory framework compares
more with other flexible labour markets such as that of the United Kingdom or
Denmark than with labour markets such as France and Germany. Based on a set
of labour regulation indicators (e.g. hiring, working hours, redundancy rules, and
costs), Ireland was ranked in 2018 by the LFMI’s ( 10) Employment Flexibility
Index as one of the most flexible labour markets in the EU. This is illustrated in a
number of indicators, including among others the fact that in Ireland there:
• are no restrictions on the duration of fixed-term contracts, except for minimum
wage;
• is no restriction on overtime, night work and work on a weekly holiday;
• there are no restrictions on redundancy rules; while redundancy dismissals
are allowed by law, although there is a requirement to notify and consult a
third part before dismissing a group of nine redundant employees.
(10)
Lithuanian Free Market Institute. Employment Flexibility Index 2018 EU and OECD
countries. Available at https://en.llri.lt/wp-content/uploads/2017/12/Employment-
Flexibility-Index-2018_-LFMI.pdf
15Ireland, however, has a statutory minimum wage. From January 2018, the
statutory minimum wage is EUR 9.55 per hour. This is an increase on the EUR
9.25 observed in 2017. When the cost of living and purchasing power parity
(PPP) are considered, Ireland’s minimum wage (expressed in US dollars) was
fifth highest amongst EU countries in 2017 (latest data available), as ranked by
the OECD and outlined in Table 4.
Table 4. Real minimum wages – hourly (in 2017 US dollars)
Country Hourly Wage
Luxembourg 11.5
France 11.3
Germany 10.6
Belgium 10.1
Netherlands 10.0
Ireland 9.3
United Kingdom 8.7
Slovenia 6.8
Spain 6.5
Poland 6.1
Portugal 5.5
Greece 4.9
Hungary 4.8
Czech Republic 4.6
Estonia 4.3
Lithuania 4.3
Latvia 3.8
Slovak Republic 3.4
Source: OECD Employment database. Labour market policies and institutions (statutory minimum wages at
2017 USD PPP); data extracted on 27 Aug 2018
1.5.2 Welfare and employment policies relating to VET
1.5.2.1 Pathways to work
Pathways to work ( 11) is a government strategy designed to reverse the dramatic
rise in the numbers of unemployed jobseekers on the live register (12) that
occurred during the recession. It is designed to complement the action plan for
11
( ) Government of Ireland (2012). Pathways to work- Government policy statement on
labour market activation. http://www.welfare.ie/en/downloads/pathwaystowork.pdf
(12)
Unemployed persons registering for unemployment benefits or allowances (and some
other statutory entitlements) must be registered at local public employment services
offices. This register is known as the live register.
16jobs (13) as part of a twin-pronged approach to tackling the jobs crisis that
emerged in the final years of the last decade. In January 2016, the second
phase of the strategy, Pathways to work 2016–20 ( 14), was launched, laying out
actions for this government priority over the next five years. Pathways to work
2016–20 contains six key strands involving 86 dedicated actions to build on the
employment progress to date under previous Pathways strategies.
While the Action plan for jobs ( 15) prioritises stimulating employment
growth, pathways to work is focused on making sure that as many as possible of
these new jobs, and other vacancies that arise in the economy are filled by
people from the Live Register. Pathways to work is coordinated by the
Department (Ministry) of Social Protection, working together with a number of
other government departments and agencies.
Pathways to work 2016-20 aims to enhance employment, education and
training services for jobseekers, and to increase engagement with employers to
provide greater opportunities for those seeking work. There are six strands
outlined in the pathways to work 2016-20 initiative:
(a) strand 1: enhanced engagement with unemployed people of working age;
(b) strand 2: increase the employment focus of activation programmes and
opportunities;
(c) strand 3: making work pay – incentivise the take-up of opportunities
(d) strand 4: incentivising employers to offer jobs and opportunities to
unemployed people;
(e) strand 5: build organisation capability to deliver enhanced services to
people who are unemployed;
(f) strand 6: building workforce skills.
1.5.2.2 Action plan for jobs
The Action plan for jobs is the government’s plan to improve the conditions for
creating new jobs. It is a whole-of-government initiative under which all
government departments and 60 agencies work together to support job creation
and protection. In 2018, the action plan for jobs ( 16) set out four key aims, one of
(13)
The Action plan for jobs is the government’s plan to improve the conditions for
creating new jobs. It is a whole-of-government initiative under which all government
departments and 60 agencies work together to support job creation and protection.
14
( )Government of Ireland (2016). Pathways to work 2016-2020.
http://www.welfare.ie/en/downloads/PathwaysToWork2016-2020.pdf
15
( )Department of Business, Enterprise and Innovation (2017). Action plan for jobs 2017.
Dublin: Department of Business, Enterprise and Innovation
https://dbei.gov.ie/en/Publications/Action-Plan-for-Jobs-2017.html
16
( ) Department of Business, Enterprise and Innovation (2018). Action plan for jobs 2018.
https://dbei.gov.ie/en/Publications/Publication-files/Action-Plan-for-Jobs-2018.pdf
17which was to ensure that those entering, re-entering or already in the workforce
have the required incentives and skills to prosper. In addition to the action plan
for jobs, there also exist nine regional action plans.
1.5.2.3 Employment support scheme (ESS)
The Employment support scheme (ESS) ( 17) is a programme offered to
jobseekers aged between 18 and 24 years. It is co-ordinated by Ireland’s
defence forces, the department of employment affairs and social protection, the
department of defence and Kildare Wicklow Education and Training Board (ETB)
(further education and training provider). This programme, which began in the
second quarter of 2018, lasts 10 weeks and aims to equip the jobseeker with
enhanced social and team work skills, an increased sense of confidence and
discipline, as well as practical skills and qualifications (including word processing,
first aid, manual handling). Participants also receive a certificate of participation
and a reference from the defence forces and the department of employment
affairs and social protection. Participants must be registered job seekers on the
live register; they are selected, through interview, by the department of
employment affairs and social protection in conjunction with the defence forces.
The programme is co-funded by the Irish government and the European Union.
1.5.2.4 Springboard+
The Springboard+ ( 18) programmes offers learners the possibility to enrol on third
level courses (at certificate (NFQ level 6; EQF 5), degree (NFQ levels 7/8; EQF
6) and masters (NFQ level 9; EQF level 8) in order to gain a qualification in key
growth sectors of the economy; initially Springboard+ was known as Springboard
and was designed to provide unemployed persons with the opportunity to upskill
or re-skill in an area of identified skills shortage; however, with the economic
recovery, the Springboard programme was opened up to those who were
economically inactive in 2011 and subsequently selected groups of the employed
and homemakers in 2017 who wished to upskill or reskill to meet emerging skills
needs in a number of sectors including ICT and Biopharma/Med Tech. Examples
of third level courses that are funded under the Springboard+ programme include
cloud computing, data science & analytics (CIT). All springboard courses include
a certain amount of work-based learning or work experience.
17
( ) http://www.welfare.ie/en/Pages/Employment-Support-Scheme-(ESS).aspx
18
( ) https://springboardcourses.ie/
181.5.2.5 FET Professional development strategy 2017/19
The FET Professional development strategy 2017/19 ( 19) stems from a
commitment set out in the Further education and training strategy 2014/19 ( 20).
This reflects the strong link between professional development within the sector
and the quality of the education and training provided. This coincides with the
international practice of FET professional development.
19
( ) SOLAS. Further education and training professional development strategy 2017-
2019. http://www.solas.ie/pages/pdstrategy.aspx
20
( ) SOLAS (2014). Further Education and Training Strategy 2014-2019.
https://www.education.ie/en/Publications/Policy-Reports/Further-Education-and-Training-
Strategy-2014-2019.pdf
19CHAPTER 2. Provision of VET
2.1 Ireland’s education and training system
In Ireland, education is compulsory between the ages of 6-16 years. Ireland’s
education system is divided into four sectors, primary, secondary, further
education and training (FET), and tertiary education (See Figure 9). As
summarised in Table 5, there were approximately 563 500 children enrolled in
primary education, 357 400 in secondary education (lower and upper), 85 000 in
FET and 218 000 in third level in the academic year 2017/18 (2016/17 for
tertiary).
Table 5. Full-time enrolments in Irish education and training system
Level Number of enrolments
Primary* 563 500
Secondary*
Lower secondary 194 300
Upper secondary 118 200
Further education & training** 85 000
Tertiary education*** 181 000
Source: *DES (2017/18); **SOLAS (2017 Jan-September only); *** HEA (2016/17)
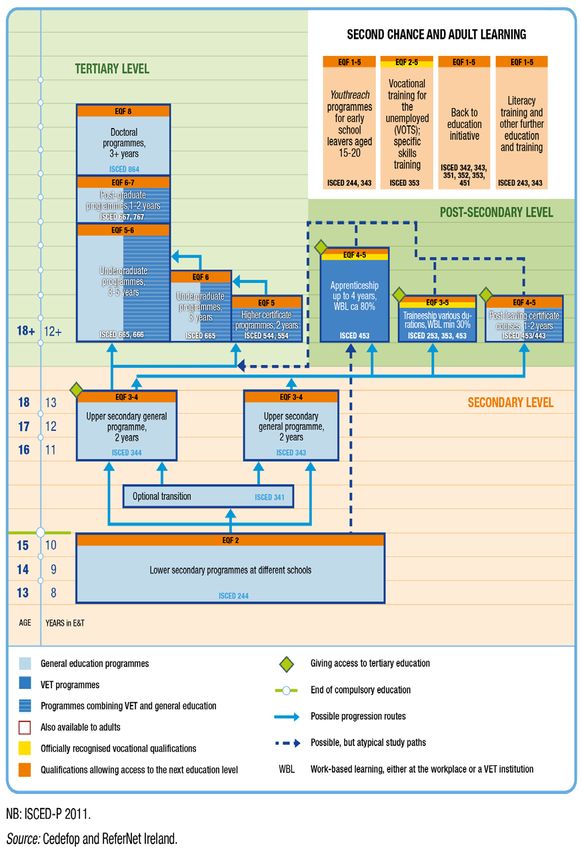
Figure 9 shows how three of the four main sectors (primary, secondary and
tertiary) of Ireland’s education and training system interact. The FET sector
incorporates post-secondary non-tertiary education, and second chance/adult
learning.
2.1.1 Primary education
Primary education is compulsory from the age of 6 years, although the vast
majority of pupils enrol between the ages of 4 and 5 years; for example, in
2017/18, 98% of all children enrolled in the first year of primary education were
aged 5 years or under. Primary education in Ireland is eight years in duration.
2.1.2 Secondary education
Secondary education usually lasts five to six years and is divided into lower
secondary education (3 years) and upper secondary (2 years). Some pupils may
also undertake the transition year programme – a one year programme that acts
as a bridge between lower and upper secondary education.
(a) lower secondary: the junior cycle (i.e. lower secondary education) is a
generally oriented programme of approximately three years’ duration and
leads to the junior certificate examination, which students usually take at the
20age of 15 or 16. The junior certificate award has been placed at level 3 on the
national framework of qualifications, which corresponds to EQF level 2
(ISCED 244). The vast majority (almost 97%) of second level pupils sit the
junior certificate examination;
(b) upper secondary: the senior cycle (i.e. upper secondary education) takes
two years and leads to the leaving certificate examination which students
usually sit at the age of 17 or 18. Approximately 92% of all those who entered
lower secondary education in September 2009 sat the leaving certificate
examination in either June 2014 or June 2015. There are three types of
leaving certificate programme: a broadly balanced Leaving Certificate
Established (LCE), a Leaving Certificate Vocational Programme (LCVP) (21)
and a Leaving Certificate Applied (LCA) for learners not catered for in the first
two. Only learners who achieve the LCE and LCVP may proceed directly to
third level education. The LCA, in contrast, is designed to prepare learners for
either entry to the labour market or progression to further education and
training. While the vocational dimension is stronger in the LCA than the other
two types, it is nonetheless regarded as general education. In 2017, 71% of
all leaving certificate candidates took the LCE programme, 24% took the
LCVP and 5%, the LCA. The leaving certificate award (regardless of type)
has been placed at levels 4-5 on Irelands NFQ, corresponding to levels 3-4
on the EQF (ISCED 343,344).
2.1.3 Further Education and Training (FET)
Since FET in Ireland comprises post-secondary non-tertiary education ( 22) as
well as second chance education/training, the FET sector is characterised by
a high degree of diversity in terms of the type, level and learner:
(a) FET programmes can be general, vocational or mixed;
(b) they lead to awards across several levels on the EQF (levels 1-5 on
the European qualifications framework (EQF), or levels 1-6 on
Ireland’s national framework of qualifications(NFQ));
(c) target groups include young people who have recently completed
upper secondary education, adult learners, early school leavers, the
(21)
Contrary to what the programme title may indicate, the LCVP is not considered to be
vocational education and training. Rather, the programme aims to lend a vocational
dimension to the leaving certificate established programme by allowing pupils to select
subjects that complement one another and develop vocational skills. For example,
students may choose to study construction studies and engineering, or home economics
and business.
(22)
28% of all those who complete upper secondary progressed to FET courses (DES
2016)
21employed, the unemployed, asylum seekers, learners with special
needs, among others;
(d) VET programmes within the FET sector are mostly related to
apprenticeship and traineeship programmes. Learners on
apprenticeship programmes must first obtain employment, and hold
an employment contract. traineeships are open to all learners
(including the employed, the unemployed and those who have
recently completed upper secondary education);
(e) Post Leaving Certificate (PLC) programmes are aimed primarily at
those completing upper secondary education, but are also open to
older learners; programmes are often general in nature, but also
include VET programmes such as motor technology;
(f) second chance learning opportunities within the FET sector include
VET opportunities for the unemployed (specific skills training and
VTOS programmes).
FET is funded, co-ordinated and planned centrally by SOLAS. FET is
delivered in training centres and schools/colleges by ETBs; there are 16 ETBs
nationwide. Most vocational education and training (VET) in Ireland occurs within
the FET sector, although since 2016, a number of apprenticeship programmes
have been proposed, developed and rolled out within the tertiary education
system.
2.1.4 Tertiary education
Over a half of those who complete upper secondary school transfer directly to
third level education on completing upper secondary education (DES 2016).
Students can opt for third level education in a university, institute of technology,
or college of education. There are also a small number of private, independent
providers of third level education (mostly business and related disciplines).
Undergraduate third level courses are of various durations, ranging from two
years for a higher certificate (NFQ 6; EQF 5, ISCED 665) to three/four years for
an honours bachelor degree (NFQ 8; EQF 6; ISCED 666). Some programmes,
such as medicine or architecture require up to five years. Postgraduate
programmes range from one year (e.g. taught masters (NFQ 9; EQF 7; ISCED
667)) to three years or more for doctoral programmes (NFQ 10; EQF 8; ISCED
864).
Traditionally, programmes at tertiary level are not officially designated as
being VET or general, although, many programmes at third level are designed to
qualify learners for work in specific occupations (e.g. teacher, architect, doctor,
engineer). In this regard, tertiary education in Ireland does lead to VET related
22qualifications. However, in 2016, for the first time in Ireland, an apprenticeship
programme became available at third level (insurance studies). Learners must
hold upper secondary education and be in employment. Nonetheless, currently
apprenticeship training at tertiary level is not a typical feature of the sector.
23Figure 9. VET in Ireland’s education and training system
242.2 Government regulated VET
Vocational education and training (VET) is provided primarily within the FET
sector (comprising post-secondary non-tertiary and second chance education).
However, since 2016, the apprenticeship system has been expanded and
includes new programmes which are delivered not only within the FET sector, but
also in tertiary level institutions. (Graduates, however, have yet to emerge from
these programmes). Most VET takes the form of apprenticeship training, and to
a lesser extent traineeship and specific skills training (for the unemployed); an
increasing number of PLC courses are also considered to be VET oriented as
some prepare learners for work in specific occupations (e.g. secretarial,
childcare), although the work-based learning component tends to be much
smaller than that in the apprenticeship and traineeship programmes. Table 6
shows the characteristics of the main VET programmes in Ireland.
Table 6. Characteristics of main VET programmes (current) in Ireland
No of Provider
Main VET Typical Typical fields of
Awards enrolme
Programmes duration learning
nts
ETB &
Pre-2016 Craft- NFQ 6 Engineering &
4 years 7 000 institutes of
Apprenticeship EQF 5 construction
technology
ETBs,
Post 2016
2-4 years NFQ 5-10 100 institutes of
apprenticeship
technology
6 moths - NFQ 4-6 Health/welfare;
Traineeship 4 500 ETB
2 years EQF services
Traineeship for
NFQ 4-6 ETB
the employed
6 weeks
Specific Skills NFQ 4-5 Engineering &
– 24 15 400 ETB
Training EQF construction
weeks
1-2 NFQ 5-6 Health/welfare;
PLC courses 32 000 ETB
years EQF services; business
Varies;
NFQ 4-6
VTOS typically Business; services 8 900 ETB
EQF
1-2 years
Source: SOLAS
2.2.1 Apprenticeship
Until 2016, formal apprenticeship training was restricted to 27 trades, mostly
concentrated in the construction and engineering sectors. However, following a
25review of the apprenticeship system by the Department (Ministry) of Education
and Skills in 2013 ( 23), a decision was made to expand the apprenticeship system
to other sectors of the economy. The qualifications, durations and economic
sectors of the new apprenticeships differ somewhat to the earlier
apprenticeships, and as a result, formal apprenticeship training falls into two
programme types:
(a) pre-2016 craft apprenticeship and
(b) post 2016 apprenticeship.
In both apprenticeship programme types, apprentices are considered to
be part of the employed population and pay the appropriate level of employment
insurance. They sign an employment contract with the employer and therefore
have the legal status (and associated rights and responsibilities) of employees.
A national apprenticeship council oversees apprenticeship in Ireland.
SOLAS (Ireland’s further education and training (FET) authority) is the lead
agency responsible for apprenticeship on behalf of the government. It
collaborates with the Higher Education Authority (responsible for tertiary
education), Quality and Qualifications Ireland (QQI), industry and education and
training providers across both the FET and third level education system. It is the
responsibility of SOLAS to maintain a national register of employers approved to
take on apprentices and a national register of apprentices.
The national apprenticeship system is funded through the National
Training Fund (NTF) ( 24) and from the Exchequer.
In 2016, Ireland’s National skills strategy 2025 ( 25) set a target to
significantly expand the apprenticeship system, both in terms of the numbers of
learners and the occupations and sectors in which apprenticeships would be
available. The action plan to expand apprenticeship ( 26) outlines the plan to
increase the number of apprenticeship places over the period 2016-20 to 31 000
23
( ) Department of Education and Skills (2013). Review of the apprenticeship training in
Ireland.https://www.education.ie/en/Publications/Policy-Reports/Review-of-
Apprenticeship-Training-in-Ireland.pdf
24
( ) The National Training Fund (NTF) was established with the National training fund Act
2000. The NTF is funded mainly by the imposition of a levy on employers. The levy is
0.7% of reckonable earnings. The levy is collected through the PAYE/PRSI system and
funds are transferred monthly to my Department by the Department of Social Protection.
It’s income also includes European Social Fund refunds and European Globalisation
Funds.
http://www.irishstatutebook.ie/eli/2000/act/41/enacted/en/html
25
( ) Department of Education and Skills (2016). National skills strategy 2025-Ireland’s
future.
https://www.education.ie/en/Publications/PolicyReports/pub_national_skills_strategy_202
5.pdf
26
( ) http://www.solas.ie/SolasPdfLibrary/ActionPlanDec16.pdf
26(up from approximately 12 000) and to increase the number of apprenticeship
programmes to more than 70 (up from 27). These increases are expected to be
rolled out incrementally to 2020.
2.2.1.1 Pre-2016 craft apprenticeship
The apprenticeship system in Ireland is governed by the 1967 industrial training
Act ( 27) and is organised by SOLAS (FET funding and planning authority) in co-
operation with the Department (Ministry) of Education and Skills, employers and
unions. The pre-2016 craft-based apprenticeship programmes normally consist of
seven phases: three off-the-job and four on-the-job. Phases 1, 3, 5 and 7 take
place with the employer, while Phases 2, 4 and 6 take place at an ETB (phase 2)
or an institute of technology (phases 4 and 6)(28). The total duration of off-the-job
phases is approximately 40 weeks. The employer pays the apprentice for the on-
the-job phases, while the State pays a training allowance to apprentices during
the off-the job phases. On completion of apprenticeship training, a qualified
apprentice receives a craft certificate (NFQ 6 or EQF 5, ISCED 544,554).
For pre-2106 craft apprenticeship training, the formal minimum entry
requirement for in Ireland is the junior certificate or equivalent (NFQ 3 or EQF 2
qualification). In practice, however, the vast majority (three quarters) of new
apprentices hold higher levels of education, typically a leaving certificate (NFQ
level 4/5 or EQF level 3/4). Learners who do not meet the minimum education
entry requirements may be registered as apprentices by an employer if they have
either successfully completed an approved pre-apprenticeship course or if they
are over 16 years and have at least three years’ approved work experience.
Some apprenticeships also require applicants to pass a SOLAS-approved colour
vision test (e.g. electrical apprenticeship, painter and decorator apprenticeship).
In order to register as an apprentice, a learner must first secure
employment in the trade s/he wishes to undertake.
2.2.1.2 Post 2016 apprenticeship
Since the expansion of the apprenticeship system in 2016, several new
apprenticeship programmes have become available. As of August 2018 , there
were 23 additional formal apprenticeship programmes being run, many of which
are delivered at tertiary level institutions; they span a range of sectors, including
hospitality (e.g. chef de partie), finance (e.g. insurance practice), and engineering
27
( ) Industrial training Act 1967.
http://www.irishstatutebook.ie/eli/1967/act/5/enacted/en/html
28
( ) Despite the fact that training occurs in an institute of technology (i.e. at tertiary level),
the qualifications obtained on completion of an apprenticeship is not classified as a third
level qualification; instead, it is considered to be a FET qualification.
27(e.g. polymer processing technology). These new apprenticeships must be a
minimum of two years in duration; they lead to awards spanning levels 5-8 on the
national framework for qualifications (EQF levels 4-6).
In addition, there are a number of apprenticeships at various stages of
development; the proposed national framework for qualifications levels for these
apprenticeships range from national framework for qualifications levels 5-10
(EQF levels 4-8), and have proposed durations of two to four years. They
include, among others, retail practice, arboriculture, and HGV driver.
The employer pays the apprentice for the duration of the apprenticeship.
For post 2016 apprenticeships, the entry requirements vary, depending on
the specific apprenticeship programme, although a leaving certificate is generally
the minimum. Furthermore, for entry to apprenticeship programmes at third level,
learners often need to meet certain academic requirements (e.g. for the
insurance practice apprenticeship, learners must hold minimum grades in at least
six subjects (including mathematics and English or Irish)).
Generally an apprentice does not pay fees. However, a student
contribution is levied on all students (including apprentices) attending institutes of
technology (i.e. phases 4 and 6 of apprenticeship training). The maximum rate of
the student contribution for the academic year 2016-17 is EUR 3 000, although in
practice the amount is typically lower than this. (Student contributions only apply
to learners on apprenticeship programmes delivered at an institute of technology;
some apprenticeships, such as accounting technician or commis chef are not
delivered at an institute of technology, and so are not subject to the student
contribution).
In order to register as an apprentice, a learner must first secure
employment in the trade s/he wishes to undertake. Apprentices are not eligible
for a student grant.
2.2.2 Traineeships
Like the apprenticeship system, the traineeship system has undergone
substantial change in the last number of years in Ireland. Most of the
development of the traineeship system has been the result of recognition of the
need to develop the skills of the employed, as outlined in the National skills
strategy 2025 ( 29). Consequently, while most traineeships programmes had
previously been available only to unemployed persons, they have, since 2017
29
( ) Department of Education and Skills (2016). National skills strategy 2025-Ireland’s
future.
https://www.education.ie/en/Publications/PolicyReports/pub_national_skills_strategy_202
5.pdf
28also been open to school leavers and the employed. There are no age
restrictions for trainees, and they free of charge to participants. Some
unemployed trainees may also receive a training allowance.
Traineeships combine workplace training with formal off-the-job tuition in
an ETB training centre. Traineeships vary in duration from six to twenty-four
months, depending on the scope of the curriculum, the skill requirement of the
occupation and the entry level of the trainees. At least 30% of learning takes
place on-the-job. Traineeships lead to awards at national framework of
qualifications levels 4-6 (EQF levels 3-5; ISCED 253, 353, 453)
Traineeships involve employers and ETBs working together in a dual
system of occupational training leading to a qualification. The training content
and occupational standards are based on employer consultation and
development of a traineeship programme is triggered by the identification of job
opportunities within a sector.
In 2018, the traineeship ( 30) was expanded to include any learner
interested in participating in the programme. Until then, traineeships had mostly
been aimed at the unemployed and as such learners had to be officially
unemployed. The minimum education entry requirement for traineeships in
Ireland varies according to the type of traineeship; while a qualification at NFQ
level 3 (EQF level 2) is usually the minimum, most entrants hold at least a
Leaving Certificate (NFQ level 4/5 or EQF level 3/4). In addition, for traineeships
(e.g. childcare, healthcare) where the learner may be in contact with vulnerable
people (e.g. children, adults with disabilities) Garda (Police) vetting is also
required ( 31). Courses are free to the unemployed.
2.2.3 Specific skills training
Specific skills training ( 32) courses allow people who have lost their job to learn
new job-related skills. The courses on offer vary from year to year with different
levels of certification. The training content and occupational standards are based
on the consultation process involving employers. Certification achieved on
course completion ranges from levels 3-5 on the NFQ (or levels 2-4 on the EQF).
The courses differ from traineeship in that they tend to be shorter (four to five
months), with a shorter on-the-job phase; in addition, the employer does not play
a role in recruitment.
30
( ) http://www.traineeship.ie/
(31)
Garda vetting is conducted in respect of personnel working in a full-time, part-time,
voluntary or student placement capacity in a position where they have unsupervised
access to children and/or vulnerable adults.
32
( ) http://learningandskills.ie/specific-skills-training/
29Like traineeships, specific skills training courses are aimed at the
unemployed and learners are therefore officially classified as unemployed prior to
beginning training. The minimum education entry requirement is a qualification at
NFQ 3 (EQF 2). All courses are free to the unemployed.
2.2.4 Post Leaving Certificate
Post Leaving Certificate (PLC) courses are aimed at learners who have
completed the leaving certificate examination at the end of upper secondary
education. They are full-time courses which last between one and two years.
PLC courses provide integrated general education, vocational training and work
experience for young people; however, PLC courses are also an option for
mature learners (in 2015, 47% of those enrolled on PLC programmes in 2015
were aged 21 or over). As such, PLC courses provide important lifelong learning
opportunities for adult learners.
While some PLC courses are vocational in nature (e.g. training in beauty
therapy, healthcare, security studies), others are general (e.g. general studies,
art, design, etc.). Most PLC courses have a work experience component. The
work based component varies, and while it can be up to a quarter of the course,
there is no statutory minimum requirement. Completion of a PLC course leads to
awards at EQF 4 or 5 (ISCED 453/443; NFQ 5 or 6). PLC courses aim to
prepare learners to enter the labour market or to progress to tertiary education,
although in practice, the numbers progressing to tertiary education via the PLC
qualifications is comparatively small.
Entry to PLC courses usually requires the applicant to hold a Leaving
Certificate qualification or equivalent (i.e. a qualification at levels 4/5 on the NFQ
or 3/4 on the EQF). Adult learners (i.e. those aged 23 or over) without Leaving
Certificate qualifications may also access PLC courses if they have sufficient
work experience. Garda Vetting may also be required, depending on the course.
A participant contribution of EUR 200 per year is also required, although this fee
may be waived under certain circumstances (e.g. those in receipt of a means-
tested student grant, those in receipt of social welfare payments, etc.).
2.2.5 Vocational training opportunities scheme courses
Vocational Training Opportunities Scheme (VTOS) ( 33) consists of a range of full-
time courses(EQF 2-5, ISCED 353) designed to meet the education and training
33
( ) The Vocational Training Opportunities Scheme (VTOS), is run by the Department of
Education and Skills. Sometimes courses can take as long as two years. They can lead
30You can also read