Irish Water Revenue Control 3 (2020-2024) - Network Capital Expenditure Look Back
←
→
Page content transcription
If your browser does not render page correctly, please read the page content below

November 2018

                 Irish Water

                 Revenue Control 3 (2020-2024)

                 Network Capital Expenditure Look Back
IW/FF/LDB/0115

                  1 | Irish Water | [Type Document Title]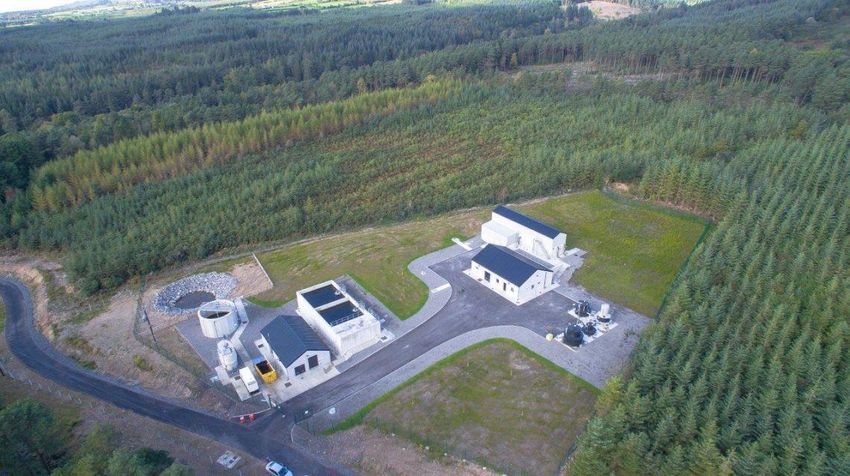
Contents

   1.     Executive Summary                                                               3
   2.     2017-2019 Network Capex                                                         9
        2.1    Introduction                                                               9
        2.2    IRC2 CRU allowance and IW outturn/forecast                                 10
        2.3    2017-2019 Portfolio Review                                                 14
        2.4    Capital efficiencies                                                       16
        2.5    Capex monitoring during IRC2                                               17
   3.     Conclusion                                                                      19
   Appendix A – 2016 network capex                                                        21
   Appendix B – Case Studies of Projects Delivered from 2016 to date                      24
   Appendix C – IP2 outcomes to end 2019                                                  33

1 | Irish Water | Revenue Control 3 (2020-2024) | Network Capital Expenditure Look Back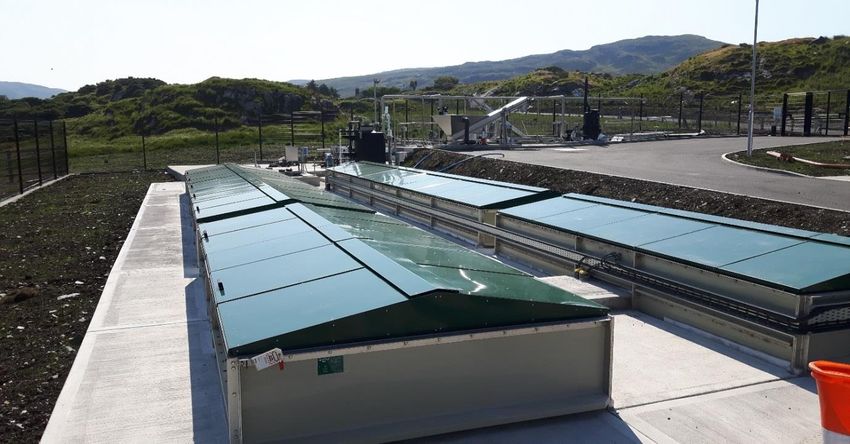
1                                       Executive
                                        Summary

2 | Irish Water | Revenue Control 3 (2020-2024) | Network Capital Expenditure Look Back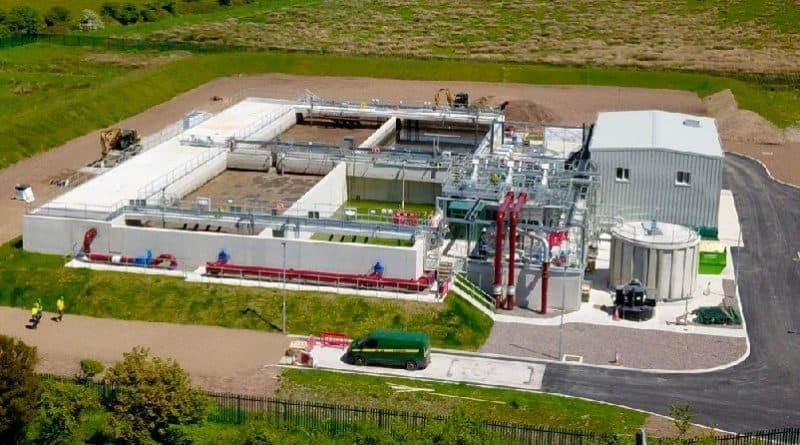
1. Executive Summary
Irish Water (IW) was established in 2014 to provide safe, clean, affordable and
environmentally compliant water and wastewater services to households and
businesses connected to the public networks.
IW supplies drinking water to approximately 80% of the general public (3.3m people),
with the remainder supplied by group water schemes and private wells. This is
delivered through some 1,000 separate water supply areas and involves the
abstraction, treatment and delivery of c.1,700 million litres of drinking water each day.
IW also collects wastewater from over 1,000 separate communities connected to the
wastewater network (wastewater zones known as “agglomerations”). We treat c.1,200
million litres of wastewater daily, before we discharge it back into our rivers and coastal
areas.
IW’s operations include several thousand water extraction points, treatment plants,
pumping stations and wastewater discharge points, c.63,000kms of mapped water
pipelines and an estimated c.25,000kms of wastewater pipelines.
The Commission for Regulation of Utilities (CRU) has decided to implement a five year
revenue control (RC3) to cover the period 2020-2024. RC3 will be the first long-term
revenue control in the water services sector since the establishment of IW in 2014. As
such, it is an important milestone in the water services regulatory framework.
This review paper forms part of IW’s submission to the CRU for RC3. It covers network
capital expenditure (network capex) in the second Interim Price Control period (IRC2)
(2017-2019).
Investment in network capex since 2014 has delivered major improvements in
service and environmental performance.
IW has delivered two investment cycles to date. The first Investment Plan for the period
2014-2016 largely involved the completion of projects which the Local Authorities (LAs)
had committed to under the Water Services Investment Programme. The second
Investment Plan, covering the period 2017-2021, involved closing out legacy LA
committed projects. This was combined with a transition to the development of IW’s
own projects and programmes at a national strategic level. This second Investment
Plan set outcome targets for both 2018 and 2021.
We have made considerable progress to date through consistently prioritising
investment to deliver the most urgently needed improvements in drinking water quality,
water availability, wastewater compliance, efficiency, leakage reduction and customer
service. At the same time, we have reacted effectively to high impact national weather
events, such as Storms Ophelia and Emma, and national water supply issues due to
the recent drought.
Since 2014, network investment has delivered substantial benefits to our customers,
including:
Removal of Boil Water Notices for over 20,000 people that had been in place in
2014 for greater than 200 days;
3 | Irish Water | Revenue Control 3 (2020-2024) | Network Capital Expenditure Look Back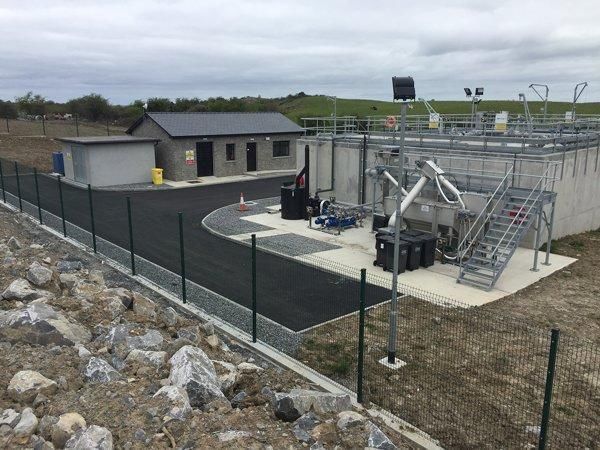
Removal of over 60,000 population from a Boil Water Notice that had been in
place for over 30 days;
Leakage reduction (gross) of 163 megalitres per day at the end of September
2018;
Completion of work at 144 supplies on the EPA’s Remedial Action List (RAL) for
water at the end of September 2018;
Removal of 105 schemes from the Priority Areas List (PAL) for wastewater
since 20151;
Commissioning of 39 new/upgraded water treatment plants;
Provision of wastewater treatment at 12 agglomerations previously discharging
raw sewage;
Commissioning of 90 new/upgraded wastewater treatment plants; and
Delivery of nearly 1,400kms of new or rehabilitated watermains.
Network capex performance in the 2017-2019 period is expected to largely meet
the CRU’s requirements.
All capex incurred by IW in IRC2 is both necessary and efficient. Projects and
programmes are delivered through IW’s Gate process which is an internal governance
procedure to ensure that investment is appropriately prioritised and delivers the best
possible value for money.
The CRU allowance and IW’s forecasted outturn for the 2017-2019 period is detailed in
the table below.2 We expect a small variance of €70m (c.3.8%) above the CRU
allowance. In the context of the scale of the investment programme, and the inflationary
pressures which are now clearly impacting the construction sector, IW considers this a
very strong performance.
The Society of Chartered Surveyors Ireland (SCSI) indicated that construction tender
prices increased by 6.2% in 2017, with a further rise of 7% projected for 2018.3 This
level of inflation is being driven by a significant uplift in construction activity and
constraints on the availability of construction labour.
Similar to any other entity managing a significant investment programme, IW is subject
to these market pressures. Given the national scale and scope of our investment
programme, these pressures have a significant impact on our costs. The elevated rate
of inflation represents a challenge to the delivery of IW’s investment programme for the
remainder of IRC2 and is expected to continue into the next RC3 investment period.
1
PAL is only in place with the EPA since 2015.
2
All expenditure figures in this paper are in 2017 monies unless otherwise stated. 2016 and 2017 numbers are outturn
figures. As IW’s RC3 submission has been made in Q3 2018, 2018 and 2019 are forecasted budgets.
3
Please refer to the following link here.
4 | Irish Water | Revenue Control 3 (2020-2024) | Network Capital Expenditure Look Back
2017-2019 CRU 2017-2019 IW     Diff (b) – (a)
IP2 Network Capex                                       allowed (a) outturn/forecast
                                                                          (b)
Water Projects                                              499           486             -13
Wastewater Projects                                           709                     551                       -158
Water Capital Maintenance                                     175                      61                       -114
Wastewater Capital Maintenance                                 46                      66                       20
Water National Programmes                                     243                     516                       273
Wastewater National Programmes                                130                     116                       -14
Other National Programmes                                      30                     152                       122
Total pre 2019 efficiency                                    1832                    1949                       117
Projected 2019 efficiency4                                                             47
Total post 2019 efficiency                                   1832                    1902                       70
Table E.1 Network Capex 2017-2019, CRU Allowed vs IW Outturn in € millions (rounded).

IW’s Capital Investment Plan for IRC2 included service level targets to end 2018 and
end 2021.5 These targets, developed during 2016, drew on our 25 year Water Services
Strategic Plan (WSSP), IW Business Plan, and the outcomes of our customer and
stakeholder engagement process. The targets covered a range of metrics, including
Boil Water Notices, the number of untreated agglomerations, and the number of Water
Treatment Plants on the EPA’s RAL, among others.6

We are still on track to deliver the majority of these critical investment targets by the
end of 2018, including the removal of the last remaining legacy long-term Boil Water
Notices. However, the timelines for some targets, such as untreated agglomerations,
have been extended, primarily due to complexities associated with legislative, legal,
environmental and planning matters. We have also needed to take account of
emerging needs, portfolio rebalancing and revised scope, schedules and costings as
each programme and project moves from conceptual design to detailed planning and
construction.

Refinements of this nature over time are expected across all utility investment
programmes. For example, unexpected asset failures, new or changing policies, and
severe weather events all have a cost impact and must be accommodated within
overall funding limits. IW’s investment planning process is now sufficiently flexible to
adjust the overall portfolio and adapt to necessary change while protecting the overall
strategic intent.

We have continued to deliver capital efficiencies through our investment
activities.

As a national utility, IW takes a strategic, countrywide approach to asset planning and
investment. This national focus enables us to take advantage of economies of scale
and scope. Our 2014-2021 Business Plan included a challenging objective to deliver
€500m in cumulative capital efficiencies and cost savings by end 2021. We recognised
c.€290m by the end of 2017 and expect to deliver the remaining c. €210m by the end of

4
    IW is projecting €47m in capex efficiency in 2019 but we have not yet determined the category allocation.
5
    Investment Plan covering the period 2017 to 2021
6
    Please refer to the following link here on the CRU website – CRU/16/345.

5 | Irish Water | Revenue Control 3 (2020-2024) | Network Capital Expenditure Look Back
2021, meeting the original target. This has been achieved through a number of
initiatives including:
Using Asset Management techniques to optimise existing assets;
Standardisation of asset technical standards;
Centralisation of procurement activities;
Contract management, including IW bulk purchasing power; and
Value Engineering through implementing innovative solutions that maximise
effectiveness of current assets or allow for lower cost alternatives.
IW has engaged with, and contributed to, the monitoring structures implemented
by our stakeholders.
The CRU has, to date, published two reports on IW’s capital investment activities. The
first report, Irish Water’s Capital Investment Outputs 2016, sets out the key outputs and
outcomes confirmed by IW as delivered during the period from its establishment to the
end of 2016. The second report covers key outputs and outcomes delivered by IW in
the first six months of 2017.7
IW is also a member of the Outputs Monitoring Group (OMG), which monitors capital
expenditure and output delivery. This group was established in early 2018 by the
Department Housing Planning and Local Government (Department) to ensure that
there is a common understanding of the outputs expected from investment by IW, while
respecting the particular statutory roles of the OMG participants - IW, the CRU, the
EPA and NewERA.
A long term investment perspective is required in order to strategically address
the many deficiencies in IW’s asset base.
While IW has made significant progress to date, the full repair and upgrading of our
water treatment plants, wastewater treatment plants, and water and sewerage
networks requires a multi-billion euro investment programme. This will be needed over
several investment cycles. There are a number of key challenges facing the water
services sector in the years ahead. These are:
Enhancing compliance with regulatory standards (both drinking water and
wastewater);
Addressing the network loss rate, and reduce leakage;
Increasing network and treatment capacity to support growth, both social and
economic; and
Developing the resilience required to cater for greater frequency of extreme
weather events.
To meet these challenges, increased investment will be required in the coming years.
IW is now moving into the RC3 period (2020-2024) and has prepared an Investment
7
Both CRU reports can be found on the CRU website at the following link here.
6 | Irish Water | Revenue Control 3 (2020-2024) | Network Capital Expenditure Look BackPlan which accompanies this submission.8 This Investment Plan is significant in that it
represents the first five-year portfolio that contains projects and programmes wholly
developed by IW.
We have projected a network capex investment requirement of €4.8bn for RC3. IW’s
service level targets to the end of the period are set within our policy and legislative
framework, our funding constraints, and feedback from our two-stage stakeholder
engagement process.
IW’s Investment Plan for the RC3 period builds on our achievements to date. It has
been optimised to allow us to utilise scarce capital by making investments that deliver
the best possible service improvements for customers, while maximising value-for-
money.
8
In accordance with section 34 of the Water Services (No.2) Act 2013.
7 | Irish Water | Revenue Control 3 (2020-2024) | Network Capital Expenditure Look Back2 2017-2019
Network
Capex
8 | Irish Water | Revenue Control 3 (2020-2024) | Network Capital Expenditure Look Back2. 2017-2019 Network Capex
2.1 Introduction
IW submitted its second Investment Plan (IP2) to the CRU in 2016, as part of the IRC2
review. IP2 covers the period 2017-2021. The CRU, as part of its IRC2 revenue
determination, decided to approve the first two years of the plan, 2017 and 2018. This
approval was subsequently extended to the end of 2019.
Although IP2 did contain projects and programmes developed by IW, it also included a
significant element of LA project commitments (Carryover projects). In developing IP2,
IW looked to ensure that the overall investment portfolio was financeable, deliverable,
operable and met the needs of our stakeholders and customers. In order to balance the
above requirements, we used an Investment Planning Framework to assess each
investment option based on its cost, benefits, and contribution to specific targets and
needs.
This framework enabled an appropriate combination of investment solutions to be
identified based on legislative, business and financial constraints. The investment
portfolio of IP2 is broken down into the following areas:
Water Projects
Wastewater Projects
Water Capital Maintenance
Wastewater Capital Maintenance
Water Programmes
Wastewater Programmes
Other National Programmes
Within the current investment period, IW has continued to review and rebalance the
overall portfolio to reflect emerging needs and revisions to scope, schedules and
costings as each programme and project moved from conceptual design to detailed
planning and construction. Refinements of this nature over time are expected across all
utility investment programmes. For example, unexpected asset failures, new or
changing policies, and severe weather events all have a cost impact and must be
accommodated within overall funding limits.
IW’s investment planning process is now sufficiently flexible to adjust the overall
portfolio and adapt to necessary change, while protecting the overall strategic intent. In
the following section, we set out the forecast outturn for each investment category in
comparison to the IRC2 CRU allowance. Variances are explained and we highlight
examples of how we have reallocated available funding across the overall portfolio,
where necessary
9 | Irish Water | Revenue Control 3 (2020-2024) | Network Capital Expenditure Look Back2.2 IRC2 CRU allowance and IW outturn/forecast
The CRU allowed network capex for 2017-2019 and outturn/forecast capex are detailed
in the table below. At an aggregate level, IW’s network capex investment over 2017 to
2019 meets the overall CRU allowance, with a variance of only 3.8%.
2017-2019 CRU 2017-2019 IW Diff (b) – (a)
IP2 Network Capex allowed (a) outturn/forecast
(b)
Water Projects 499 486 -13
Wastewater Projects 709 551 -158
Water Capital Maintenance 175 61 -114
Wastewater Capital Maintenance 46 66 20
Water National Programmes 243 516 273
Wastewater National Programmes 130 116 -14
Other National Programmes 30 152 122
Total pre 2019 efficiency 1832 1949 117
9
Projected 2019 efficiency 47
Total post 2019 efficiency 1832 1902 70
Table 2: Network Capex 2017-2019, CRU Allowed vs IW outturn & forecast outturn in € millions (rounded).
Each of the above investment categories is discussed in turn below.10 Appendix B
provides additional detail through case study examples of water and wastewater
projects delivered since the start of IRC2. Full details of all IW investment in the period
(both financial and outputs/outcomes) are included in the accompanying Business
Planning Questionnaire excel file.
2.2.1. Water Projects
The category ‘Water Projects’ covers capital expenditure at specific locations that
deliver drinking water service improvements. Capex in this category generally covers a
new, or upgraded, Water Treatment Plant (WTP) and associated trunk mains. Water
projects have a range of associated outputs and outcomes, including improved drinking
water quality, the facilitation of growth and the remediation of water supply
interruptions.
One of the most significant projects in this category is the Vartry Regional Water
Supply Scheme (c.€60m in the 2017-2019 period). Works include the construction of
the Vartry to Callowhill Pipeline link, the upgrade of the Vartry Reservoir and WTP, and
the construction of a new covered storage reservoir at Stillorgan. It will ensure a safe
and sustainable water supply for c.200k customers in the north Wicklow and south
Dublin areas. It will also remove 10 schemes from the EPA’s RAL. We expect this
project to complete in 2021.
9
IW is projecting €47m in capex efficiency in 2019 but we have not yet determined the category allocation.
10
All forecast outturn figures are pre-2019 efficiency.
10 | Irish Water | Revenue Control 3 (2020-2024) | Network Capital Expenditure Look BackAnother notable project is the Central Kerry Regional Water Supply Scheme (c.€25m in the 2017-2019 period). This project, recently commissioned, involved the construction of a new 51,000 mᵌ/day water treatment plant for central Kerry, including Tralee, Killarney, Castleisland, Castlemaine and the surrounding rural area. It provides a reliable drinking water supply for 62,000 customers and 1.1 million tourists in the central Kerry region, covering nine water supply zones. It also removes six drinking water supplies from the EPA’s RAL. The success of this project is signified by its recent award from Engineers Ireland as ‘Engineering Project of the Year’. Overall, there is a forecasted IRC2 outturn of €486m for Water Projects, €13m below the 2017-2019 CRU allowance of €499m. In the upcoming RC3 period, we will continue to focus on necessary investment to improve drinking water capacity and quality for the current and future needs of our customers. 2.2.2 Wastewater Projects The category ‘Wastewater Projects’ covers capital expenditure at specific locations that deliver wastewater service improvements. Capex in this category generally covers a new, or upgraded, Wastewater Treatment Plant (WWTP) and associated sewers. Wastewater projects have a range of associated outputs and outcomes, including improved wastewater compliance issues and the facilitation of growth. One of the most significant projects in this category is the Ringsend WWTP Upgrade (c. €94m in the 2017-2019 period). Proposed works at Ringsend include the use of innovative Aerobic Granular Sludge (AGS) technology in the existing secondary treatment tanks and increasing the capacity of the plan to 2.4 million population equivalent. We forecast that all upgrade works on the Ringsend site will be complete by 2025. Another significant wastewater project is the Blanchardstown Sewerage Scheme (c. €23m in the 2017-2019 period). This project will facilitate existing and future development in the greater Blanchardstown region and surrounding areas, including Meath and Kildare. It will also reduce the frequency and volume of untreated wastewater overflows from the wastewater network to the River Tolka. Overall, there is a forecasted IRC2 outturn of €551m across Wastewater Projects, which is a variance of c. €158m below the CRU allowance of €709m. This is primarily due to project delivery schedules which have not progressed at the pace originally envisaged in the IP2 profile. We have re-allocated the available investment into National Programmes, which is discussed further below. IW recognises that the delivery of wastewater projects is critical to increase wastewater treatment capacity across the country, to improve environmental protection and to meet our obligations under EU and Irish law. Since 2014, we have upgraded or built new WWTP in 90 locations across the country, including 12 towns where raw sewage was being released untreated directly into the receiving water. IW expects to double the average annual expenditure on wastewater projects from IRC2 to RC3 – rising from c. €184m to c. €414m. Projects such as Ringsend, Arklow Sewerage Scheme, and the Greater Dublin Drainage (GDD) project will drive a significant amount of this RC3 expenditure. These investments are key to improving wastewater services for our customers and delivering on our RC3 outcome targets. 11 | Irish Water | Revenue Control 3 (2020-2024) | Network Capital Expenditure Look Back
2.2.3 Capital Maintenance

Capital Maintenance is ‘like for like’ replacement or refurbishment of worn out assets.
The objective of Capital Maintenance is to find the most cost-effective way of
maintaining services, making the best use of existing assets. Prior to the establishment
of IW, capital expenditure was predominantly focused on individual projects, building
new assets on a county by county basis. In general, very limited funding was allocated
to the maintenance of existing asset performance and ‘run to failure’ was common.

Insufficient Capital Maintenance results in an increasing number of asset failures which
has a knock on impact on both costs and service to customers. This simply defers
necessary investment, leading to further asset degradation and greater ultimate costs
of remediation. The CRU recognised the importance of increasing Capital Maintenance
expenditure during the IRC2 review.11

Drinking water quality, leakage, and internal and external flooding were all addressed
under IP2’s Capital Maintenance Programme across water and wastewater.

There is a forecasted IRC2 outturn of €127m in Capital Maintenance versus the CRU
allowance of €221m (water and wastewater combined). However, since submission of
IRC2, we have re-categorised a significant number of the IP2 Capital Maintenance
items as IP2 National Programmes. As a result, this projected outturn does not reflect
an underspend, but rather a reallocation to other IP2 categories.

The €127m projected investment in Capital Maintenance has also been reallocated
within sub-categories, reflecting the prioritisation of needs within the period. For
example, IW’s 2017-2019 estimate for Capital Maintenance on above ground water
assets such as abstraction works, treatment plants, pumping stations and storage
reservoirs was €30.5m. We are now expecting to invest nearly double that amount
within the period, at €58.5m. Similarly, our estimate for Capital Maintenance on below
ground wastewater assets such as sewers, sewage rising mains and outfall pipelines
was €21.5m. We are now forecasting IRC2 investment of €30.4m.

Failing assets impact on service provision to customers and on the surrounding
environment. IW recognises the importance of Capital Maintenance in avoiding asset
failure and sustaining asset performance. Within IRC2, we have allocated available
resources to address the most urgent requirements. We expect to maintain a strong
level of Capital Maintenance activity into the RC3 period and this is reflected in our
accompanying RC3 Investment Plan.

2.2.4 National Programmes

A key focus of investment in IRC2 is the new National Programmes. These
programmes improve our asset information, performance, and service levels across the
country, ensuring an appropriate geographic spread of investment. They are designed
to deliver a wide range of improvements in both drinking water and wastewater
schemes.

11
     Please see section 3.5.2.2 Capital Maintenance in CRU IRC2 consultation paper here.

12 | Irish Water | Revenue Control 3 (2020-2024) | Network Capital Expenditure Look Back
Key programmes to address customer and stakeholder concerns include those to
tackle risks to drinking water quality (Water Treatment Programme), lead in water
(National Lead Programmes: Lead Service Pipe Replacement and Orthophosphate
Dosing) and leakage (First Fix). In wastewater, the progression of Drainage Area
Plans, which identify network performance and flooding issues, have also been
included. The category “Other” covers National Programmes that stretch across both
water and wastewater services, such as energy efficiency programmes.
Since the submission of IRC2, we have refined the project and programme portfolio,
including merging some programmes where appropriate. One of the most important
merged National Programmes (water) is Mains Rehabilitation. High burst rates on
certain sections of the water network result in constant interruption of supply to
customers and deterioration of water quality. Reduced bursts and leakage levels
deliver improved service provision to customers, conserve our precious water supplies,
and reduce ongoing operational costs. IW’s original 2017-2019 estimate for merged
watermain rehabilitation works was €62m. We now expect to invest double that, at
€123m. This strong level of activity is evidenced by the delivery of c.1,400kms of new
or rehabilitated watermains from 2014 to date, including c.550kms since the start of
2017.
Another important water initiative is the Coagulation/Filtration/Clarification (CFC)
programme. This involves the upgrading and installation of new CFC processes to
remove contaminants (e.g. THM precursors, turbidity, colour, iron, manganese, etc.)
from raw water prior to disinfection. This is a key activity in improving drinking water
quality for our customers. IW’s original 2017-2019 estimate for CFC works was c.€14m.
We now expect to nearly triple that investment to €37m. This has allowed 15 plants to
be upgraded in 2017, maintained Microbiological compliance in the 99.9% range, and
improved THM compliance from 91.38% in 2014 to 94.06% in 2017.
On the wastewater side, Drainage Area Plans (DAPs) identify the current performance
level of our wastewater collection network. This includes level of infiltration/exfiltration,
structural deficiencies, hydraulic performance, and significance of individual storm
water overflows. All of these factors have a direct impact on the environment and the
potential for flooding of homes and businesses.
IRC2 represented the start of a national approach to the development of DAPs. Each
DAP involves a significant amount of development work, including CCTV mapping. As
a result, they can take a number of years to complete. IW’s original 2017-2019 estimate
for DAP works was €28.5m and we now expect to invest €24.4m. The deliverables
associated with this investment are considerable. Since January 2017 we have
developed four DAPs, with an additional 46 underway. Combined, these represent
c.38% of the wastewater collection network.
For National Programmes overall, there is a forecasted IRC2 outturn of €785m versus
the original CRU allowance of €403m (water, wastewater and other combined). This
variance reflects a combination of three factors:
reallocation within the IP2 portfolio from Wastewater Projects and Capital
Maintenance,
increased investment in key areas such as Mains Rehabilitation reflecting
urgent requirements to address leakage; and
13 | Irish Water | Revenue Control 3 (2020-2024) | Network Capital Expenditure Look Back the initiation of new works to accommodate emerging needs.
2.3 2017-2019 Portfolio Review
In accordance with best utility practice, IW reviews and refines its Investment Plan on
an ongoing basis to ensure that it:
continues to reflect the most urgent investment needs. This includes responding
to severe weather events or unforeseen asset failures, e.g. such as those in
Staleen in July 2017 and June 2018;
captures any required scope changes to projects or programmes;
responds to any emerging policy requirements; and
takes account of any scheduling changes and revised scope and costings, as
each programme and project moves from conceptual design to detailed
planning and construction.
The portfolio of projects and programmes in IRC2, and the prioritisation of each,
continue to change, in response to these drivers.
In August 2016, when submitted to the CRU, IW’s Investment Plan contained over 360
individual projects, at various stages of development, together with over 150
programmes. The plan targeted to deliver improvements in drinking water quality and
wastewater compliance and to enable economic growth in the wider economy. Less
than 10% of the projects were at construction stage in August 2016. Approximately
50% of the projects were still at conceptual design stage, with an indicative scope, and
hence their forecasted costs and delivery dates were subject to refinement as the
project matured.
The overall balance of the investment portfolio between projects and programmes is
continuously managed by IW to optimise delivery as detailed designs, costs and
schedules are confirmed. Outturn projections (both financial and outputs/outcomes)
vary from original estimates for many reasons, including the following:
Revised estimates and delivery schedules were prepared for legacy projects
which pre-date IW’s establishment. These are now estimated on the same basis
as the projects which have originated in IW;
Original expenditure and schedule estimates from August 2016 continue to be
refined and updated with the latest information as projects and programmes
move into detailed design, statutory processes, and procurement;
The overall investment portfolio has been rebalanced. In particular, National
Programme expenditure has been accelerated to address critical issues. This
acceleration was enabled by the extension of some project timelines
(particularly Wastewater Projects) and hence lower project expenditure in the
early years of the investment period;
There has been some re-categorisation of investment, for example from Capital
Maintenance to National Programmes; and some additional reallocation within
Capital Maintenance.
14 | Irish Water | Revenue Control 3 (2020-2024) | Network Capital Expenditure Look Back Emerging needs have been incorporated e.g. critical asset failures and housing
infrastructure acceleration;
Inflation in the construction sector is exerting significant cost pressure. The
Society of Chartered Surveyors Ireland (SCSI) indicated that construction
tender prices increased by 6.2% in 2017, with a further rise of 7% projected for
2018.
The scope of some projects has increased as the delivery solutions became
more defined; and
During IRC2, IW had to respond to major unforeseen events, including the July
2017 and June 2018 bursts in Staleen;12 Storm Ophelia in October 2017; Storm
Eleanor in January 2018; Storm Emma in March 2018;13 and the severe drought
of summer 2018.14 IW responded effectively to each of these unpredicted
events but, in order to do so, we needed to re-allocate resources (financial,
planning, and capital delivery) while maintaining service provision to the
greatest possible extent.
It is clear that the factors set out above, and their complex interplay, inevitably result in
performance variances versus point-in-time estimates. However, at an aggregate
portfolio level, IW’s forecasted network capex variance is only 3.8% above the CRU
allowance across all network capex line-items. Given the multiple pressures
experienced within the period, this represents a very strong performance.
IW’s Investment Plan for IRC2 included service level targets to end 2018 and end
2021.15 These targets, developed during 2016, drew on our WSSP, Business Plan, and
the outcomes of our customer and stakeholder engagement process. The targets
covered a range of metrics, including Boil Water Notices, the number of untreated
agglomerations, and the number of Water Treatment Plants on the EPA’s RAL, among
others.16
We are still on track to deliver the majority of these critical investment targets by the
end of 2018, including the removal of the last remaining legacy long-term Boil Water
Notices. However, the timelines for some other targets, such as untreated
agglomerations, have been extended, primarily due to complexities associated with
legislative, legal, environmental and planning matters. We have also needed to take
account of emerging needs, portfolio rebalancing and revised scope, schedules and
costings as each programme and project moves from conceptual design to detailed
planning and construction, as described above.
Expected progress on IW’s targets to the end of IRC2 is set out in Appendix C.
The refinement of investment plans over time is normal practice across all utilities. For
example, Scottish Water produces an annual update to its 2015-2021 investment
programme. IW’s outturn forecasts (both financial and outputs/outcomes) are similarly
12
We estimate that the new Staleen trunk main will be in operation by the end of 2018.
13
All storms required investment in electricity generators to keep treatment plants in operation.
14
Since summer 2018 we have brought forward capital works on the identification and drilling of groundwater boreholes
to increase drinking water capacity.
15
Investment Plan 2 covering the period 2017 to 2021.
16
Please refer to the following link here on the CRU website – CRU/16/345.
15 | Irish Water | Revenue Control 3 (2020-2024) | Network Capital Expenditure Look Backsubject to further amendment as IRC2 completes and we move into the next
investment cycle.
2.4 Capital efficiencies
From establishment, IW recognised the importance of delivering efficiencies for our
customers. Our 2014 - 2021 Business Plan committed IW to delivering €500 million of
capital efficiencies by the end of 2021. We recognised c.€290m by the end of 2017 and
expect to deliver the remaining c.€210m17 by the end of 2021. We have developed
categories for these capital efficiencies, which are discussed below.
Innovative technology options: IW leverages its national utility expertise to
develop innovative investment solutions for issues such as increased demand
on wastewater treatment plants (WWTPs). We have rolled-out innovative
technology and processes in WWTPs since 2014, in plants such as Ringsend
and Youghal. These initiatives will result in a smaller plant footprint for
equivalent, or an improved, treatment standard. We have identified €131m in
savings through such initiatives to the end of 2017.
Procurement activities: Frameworks are in place for Engineering Services,
Minor Civil works, Water Main Rehabilitation and other services, to drive
efficiencies in procurement of frequently purchased services and works. Further
procurement savings have been achieved by designing more appropriate
contracts, reflecting better risk allocation. We have identified €65m in savings
through such initiatives to the end of 2017.
Value engineering: There are two elements to Value Engineering that enable
capital efficiencies – (i) the development of projects and (ii) construction
delivery.
i. In the first instance, IW examines project options to meet the required
outcome at least cost. This is different to the use of alternative / innovative
technologies. For example, 20MLD of water treatment needed across five
adjacent towns could be delivered through one large scheme of 10MLD and
four small schemes of 2.5MLD. However, it could be more cost effective
over the operational lifespan to build one larger 20MLD WTP and increase
the surrounding network. This is the case in the design of the Thurles
Regional Water Supply Scheme.
ii. Value Engineering in construction is largely contractor led and delivers the
same outcomes but at lower cost. For example a project which was
tendered on the basis of a pipe being installed in a road, may accept a
proposal from a Contractor to install that pipe in a verge, which would
deliver shared benefits to the contractor and IW.
We have identified €77m through both value engineering initiatives to the end of
2017.
Standardisation of Design: Prior to IW establishment, professional and
construction services were delivered by various suppliers on an ad-hoc basis.
17
Includes €47m of projected 2019 efficiencies.
16 | Irish Water | Revenue Control 3 (2020-2024) | Network Capital Expenditure Look BackThis resulted in bespoke design solutions for capital investments and this
variability in capital delivery was reflected in higher project costs. By
standardising designs, specifications, project management, construction
methods, health and safety measures and supervision, IW now drives better
value for money. In addition, our implementation of National Programmes, such
as drinking water disinfection, allows for economies of scale in design,
engineering and project management of nationwide service improvement. We
have identified €17m through such initiatives to the end of 2017.
2.5 Capex monitoring during IRC2
It is crucial that the delivery of our Investment Plan is tracked robustly to demonstrate
to our customers, the CRU, and other stakeholders that (a) we are making the best
possible investment decisions in the drinking water and wastewater services assets; (b)
we are steadily improving service delivery; and (c) we are working towards meeting our
target outcomes.
The CRU has, to date, published two reports on IW’s capital investment progress. The
first report, Irish Water’s Capital Investment Outputs 2016, sets out the key outputs and
outcomes confirmed by IW as delivered during the period from its establishment to the
end of 2016. The second report covers key outputs and outcomes delivered by IW in
the first six months of 2017.18
In addition, the Outputs Monitoring Group (OMG) established by DHPLG in 2018 also
contributes to the monitoring of IW’s capital expenditure and output delivery. The OMG
ensures that there is a common understanding of the outputs expected from investment
by IW, while respecting the particular statutory roles of the participants in the group -
IW, the CRU, the EPA and NewERA. Among other functions, it also provides a forum to
discuss any policy issues and change management issues arising with particular
regard to the Government’s Water Services Policy Statement and the River Basin
Management Plan.
IW will continue to engage with, and contribute to, all capex monitoring frameworks
during the remainder of IRC2 and into the next investment cycle, RC3.
18
Both CRU reports can be found on the CRU website at the following link here.
17 | Irish Water | Revenue Control 3 (2020-2024) | Network Capital Expenditure Look Back3 Conclusion 18 | Irish Water | Revenue Control 3 (2020-2024) | Network Capital Expenditure Look Back
3.       Conclusion
IW was established in 2014 to take on the challenge of reforming how Ireland’s water
and wastewater services are delivered. Over the course of IRC1 and IRC2 much
progress has been made. Our investment to date has delivered real benefits to our
customers, including the removal of long-term Boil Water Notices for over 20,000
people and the completion of work at 144 supplies on the EPA’s Remedial Action List.

Given funding limits and supply chain capacity, we have prioritised investment to
deliver the most urgently needed improvements in drinking water quality, water
availability, wastewater compliance, efficiency, leakage reduction and customer
service. At the same time, we have reacted effectively to high impact national weather
events, such as Storms Ophelia and Emma, and the recent drought.

Such emerging needs and unforeseen events have a cost impact and must be
accommodated within overall funding limits. These additional demands, inflationary
pressures, and other drivers, have resulted in outturn projections (both financial and
outputs/outcomes) varying from original estimates. However, IW’s investment planning
process is now sufficiently flexible to adjust the overall portfolio and adapt to necessary
change while protecting the overall strategic intent.

During IRC2, we have rebalanced the portfolio and made necessary revisions to scope,
schedules, and costings as each programme and project moved from conceptual
design to detailed planning and construction. At an aggregate level, we have performed
strongly in the period, and we are projecting a variance of only 3.8% above the CRU
allowance while making clear, quantifiable progress in improving water and wastewater
services.

While IW has made significant progress to date, the full repair and upgrading of our
water treatment plants, wastewater treatment plants, and water and sewerage
networks requires a multi-billion euro investment programme. This will be needed over
several investment cycles. We are now moving into the first full five year regulatory
cycle. In developing the RC3 Investment Plan we have refined our approach, building
on lessons learned in IRC1 and IRC2. We are confident that our RC3 Investment
proposals are once again optimised across our entire portfolio to ensure that we deliver
the best possible service improvements, while maximising value-for-money.

19 | Irish Water | Revenue Control 3 (2020-2024) | Network Capital Expenditure Look Back
4                                       Appendices

20 | Irish Water | Revenue Control 3 (2020-2024) | Network Capital Expenditure Look Back
Appendix A – 2016 network capex
Introduction
Network capex in IW’s first investment plan (IP1, 2014-2016) was presented broadly in
the following categories:
Drinking Water;
Wastewater;
Capital Maintenance;
Infrastructure Support; and
Metering.
2016 outturn capex versus the CRU allowance is detailed in the table below. In total,
there is a variance of €157m below the CRU allowance, which is discussed further
below. Network capex since 2016 has been steadily increasing, with 2017 outturn at
€489m and ramping up to a 2018 forecast of €630m.
2016 CRU 2016 Diff
IP1 Network Capex allowed (a)
IW outturn (b) (b) – (a)
Drinking Water 84 70 -14
Wastewater 185 128 -57
Capital Maintenance 182 140 -42
Infrastructure Support 72 53 -19
Metering 85 61 -25
Total 609 452 -157
Table A.1 Network Capex 2016, CRU Allowed vs IW Outturn in € millions (rounded) .
IP1 categories and spend
Water & Wastewater Projects
Drinking water capex was comprised of investment in Drinking Water Quality and
Drinking Water Capacity. Expenditure on quality included much needed investment to
address chronic failures in water quality, e.g. non-compliant water supplies on the
EPA’s RAL. Expenditure on capacity included the replacement and rehabilitation of
mains and upgrades to existing water treatment plants.
There was investment of €70m against the CRU allowance of €84m. One of the main
IW drinking water projects in 2016 was the Northeast Roscommon & Ballyleague
Regional Water Supply Scheme (€4.9m). This project, delivered in Q3 2017, serves a
population of c. 5,400 people in Co. Roscommon. Since 2014, households and
21 | Irish Water | Revenue Control 3 (2020-2024) | Network Capital Expenditure Look Backbusinesses served by the scheme had been on a Boil Water Notice due to the
detection of cryptosporidium in the water. This notice was lifted after project
completion.
Wastewater capex was comprised of Wastewater Compliance and Wastewater
Capacity investment. Compliance projects were those aimed at achieving compliance
with statutory standards, e.g. the Urban Wastewater Treatment Directive or EPA
licence standards. Capacity projects were those aimed at providing treatment or
network capacity to deal with deficiencies in capacity and/or to accommodate growth.
IW delivered investment of €128m in this category against the CRU allowance of
€185m. Almost €50m of the investment was in two of IW’s major projects, the upgrade
to Ringsend WWTP and Cork Lower Harbour. Another project that had significant
investment (€8.7m) in 2016 was the Youghal Wastewater Treatment Plant / Sewerage
Scheme. This project was delivered in Q1 2018. As a result of this investment, there is
now no untreated wastewater discharging directly into the sea in Youghal. The works
also ensure that wastewater is treated and discharged in compliance with the Urban
Wastewater Treatment Regulations and with the conditions of the Wastewater
Discharge Licence issued by the EPA.
Capital Maintenance
Capital Maintenance covered investment in four areas.
Water Conservation was a programme focused on renewing or rehabilitating
water mains to actively reduce leakage.
Minor Capital Works provided for the quick delivery and resolution of customer,
compliance and safety issues in partnership with the LAs, for example the
fencing of potentially hazardous locations.
Minor Capital Programmes was aimed at developing and delivering low capital
cost solutions to address quality, statutory and operational efficiency deficits,
e.g. disinfection of drinking water supplies.
Suppressed Capital Maintenance addressed assets at most risk of failure due to
a legacy of under-investment.
There was investment of €140m in Capital Maintenance against the CRU allowance of
€182m. The largest area of investment in this category in 2016 was watermains rehab
(€44m). This was instrumental to the delivery of the c.850kms of watermains replaced
over 2014-2016.
Infrastructure Support
Infrastructure support was comprised of eight expenditure categories19. There was
investment of €53m versus the CRU allowance of €72m. This variance was mainly due
to the lower than expected uptake in Customer Side Leakage (i.e. First Fix) and the
reduction in Legacy Final accounts achieved by IW negotiation.
19
The eight expenditure categories are legacy final account, developer driven reinforcement, HSQE, metering, key
studies, capital project office staff, telemetry and Customer Side Leakage.
22 | Irish Water | Revenue Control 3 (2020-2024) | Network Capital Expenditure Look BackDomestic Metering The IW Domestic Water Metering Programme was mandated by Government to provide a national infrastructure of domestic water meters. This metering infrastructure is an enabler for demand management, leakage reduction, and network control. There was investment of €61m against the CRU allowance of €85m in 2016. This contributed to the programme’s overall delivery of c.894k domestic meters. 2016 summary commentary There is a combined variance across the 2016 network capex activities of €157m below the CRU allowance, primarily attributable to Wastewater Projects and Capital Maintenance. IW assumed responsibility for providing drinking water and wastewater services in 2014 against a backdrop of historic under-investment. The 2014-2016 period encompassed a transitional phase involving the novation of projects from the LAs to IW (‘Carryover’ projects). IW faced significant challenges during this transitional phase in rectifying water leakage issues and imminent risks to public health from poor drinking water quality and wastewater compliance in some areas. IW also had to operate with a significant data deficit. For example, our 2014 estimate of the water network length, based on existing records at the time, was c.58,000kms. By 2016, through better asset data, we had revised this figure up by 10% to c.63,000kms. The data challenges on wastewater were even more significant, with little information available on the length or locations of the sewer network. Rather than progress all originally proposed investments to meet the CRU allowances, IW took a prudent approach to first gather sufficient robust data to assess the relative merits of each project and programme. This approach is reflective of the strategic, national focus which IW has brought to water services investment in Ireland. . 23 | Irish Water | Revenue Control 3 (2020-2024) | Network Capital Expenditure Look Back
Appendix B – Case Studies of Projects Delivered from 2016
to date
This appendix details a number of projects delivered since 2016 and how they have
provided service and environmental improvements.
Water Supply Projects
B1. Kingscourt Water Supply Scheme (Co. Cavan)
Investment
Project Name Region Completion
(€m)
Number Date
Kingscourt Water Region 1 -
10001740 €3.5 Million
Supply Scheme Dublin/Leinster Autumn 2018
Table B1: Kingscourt Water Supply Scheme
Scope:
Decommissioning and demolition of 580 mᵌ/day failing water treatment plant
(original works commissioned in 1948).
Construction of a new 1,040 mᵌ/day water treatment plant.
Construction of a new 1,042 mᵌ storage reservoir at the existing Kingscourt site.
Construction of an off-site well at Descart, Co. Monaghan.
Benefits:
3,200 customers removed from the EPA’s RAL for both the Kingscourt Water
Supply Scheme and Ballinaclose Water Supply for THM exceedances.
Increase in water supply, eliminated need and associated costs for tankered
water supply during high demand periods.
24 | Irish Water | Revenue Control 3 (2020-2024) | Network Capital Expenditure Look BackB2. Burncourt & Fethard Regional Water Supply Scheme / Water
Treatment Plants (Co. Tipperary)
Project Investment Completion
Name Region
Number (€m) Date
Burncourt & Fethard
Regional Water Supply Region 2
10001107 €15.9 million Spring 2017
Scheme / Water - Munster
Treatment Plants
Table B2: Burncourt and Fethard Water Supply Scheme / Water Treatment Plants
Scope:
Construction of new 2,600 mᵌ/day water treatment plant at Burncourt and 6,500
mᵌ/day water treatment plant at Fethard.
Construction of new 2,600mᵌ water reservoir at Burncourt and 6,500mᵌ water
reservoir at Fethard.
Construction of new sludge dewatering building, tanks, new river intake works
on the Anner River and pumping station for the Fethard Regional Water Supply
Scheme.
Rehabilitation of 18.3km of water mains in the area.
Construction of 1.7km of new access roads.
Benefits:
Reliable and safe drinking water supply to over 7,000 customers.
Removal of boil water notices for over 90 properties in the area.
Removal of the Burncourt, Cloran and Gortnapisha supply zones from the
EPA’s RAL for inadequate treatment for Cryptosporidium.
Improved water pressure in the area.
Eliminated water shortages in summer months
25 | Irish Water | Revenue Control 3 (2020-2024) | Network Capital Expenditure Look BackFigure B2: Fethard WTP, Co. Tipperary
B3. Central Kerry Regional Water Supply Scheme / Water
Treatment Plant (Co. Kerry)
Investment Completion
Project (€m) Date
Name Region
Number
Kerry Central Regional Summer
Water Supply Scheme Region 2 - 2018
10001446 €33.5 million
/ Water Treatment Munster
Plant
Table B3: Kerry Central Regional Water Supply Scheme / Water Treatment Plant
Scope:
Construction of a new 51,000 mᵌ/day water treatment plant for central Kerry
(Tralee, Killarney, Castleisland, Castlemaine and surrounding rural area).
New state-of-the-art water treatment facility includes:
o Dissolved air flotation clarification, rapid gravity sand filtration, chemical
conditioning and disinfection facilities (pH correction, chlorination and
fluoridation);
26 | Irish Water | Revenue Control 3 (2020-2024) | Network Capital Expenditure Look Backo UV pathogen inactivation, incorporating a cryptosporidium barrier and
sludge handling facilities;
o Treated water pumping facilities to deliver drinking water via the
Glenflesk and Sheheree reservoirs; and
o Hydroelectric power turbine to generate electricity for the site.
Upgrade of water intakes from Lough Guitane, upgrading of raw water
abstraction and screening works at River Owgarriff and Lough Guitane.
15,000 mᵌ of water storage.
Benefits:
Removal of 6 water supplies from the EPA’s RAL (absence of a
Cryptosporidium barrier).
Reliable and certainty of supply of drinking water for 62,000 customers and 1.1
million tourists in the central Kerry region covering 9 water supply zones.
Note: Received Engineers Ireland award for Engineering Project of the Year,
2018.
Figure B3: Kerry Central Regional WTP, Co. Kerry
27 | Irish Water | Revenue Control 3 (2020-2024) | Network Capital Expenditure Look BackWastewater Projects
B4. Kinvara Sewerage Scheme / Waste Water Treatment Plant (Co.
Galway)
Completion
Project Investment Date
Name Region
Number (€m)
Kinvara Sewerage
Region 3 -
Scheme / Waste
10001280 Connacht €5.1 Million Spring 2017
Water Treatment
Ulster
Plant
Table B4: Kinvara Sewerage Scheme / Waste Water Treatment Plant
Scope:
Construction of a new 1,300PE20 WWTP. This plant has an additional capacity
of 2,050PE to cater for peaks during the tourist season and provisions for future
modular expansion. Project scope also includes construction of a marine outfall
pipe and upgrading of access road.
Upgrades to the Kinvara wastewater collection network.
The construction of new gravity combined sewers (length approximately 900m)
from the Gort Road, along part of Main Street (East) and the Quay Road,
ending at the wastewater treatment plant.
New connections for all customers along the route of the sewerage scheme.
The change of use of some of the existing combined sewers to surface water
sewers.
Benefits:
Removal from list of locations highlighted by the EPA in their Urban Wastewater
Treatment (UWWT) Report as having no wastewater treatment.
The works ensure that wastewater is treated and discharged in compliance with
the Urban Wastewater Treatment Regulations and with the conditions of the
Wastewater Discharge Licence issued by the EPA. It will also improve the water
quality of nearby coastal areas, protecting bathing areas and the aquatic
environment from pollution.
Elimination of periodic bacterial sewage pollution to commercial/licensed
shellfisheries (oysters and shellfish production) located 2km to 3km into the
Galway bay.
Increased capacity of the drainage network in the town.
20
Population Equivalent
28 | Irish Water | Revenue Control 3 (2020-2024) | Network Capital Expenditure Look Back Accommodation of future population growth or development in the Kinvara area.
Figure B4: Kinvara WWTP, Co. Galway
B5. Bundoran, Killybegs, Glencolumbkille and Convoy Waste
Water Treatment Plants (Co. Donegal)
Completion
Project Investment Date
Name Region
Number (€m)
Bundoran, Killybegs,
Region 3 -
Glencolumbkille and €24.4
10001760 Connacht Spring 2018
Convoy Waste Water million
Ulster
Treatment Plants
Table B5: Bundoran, Killybegs, Glencolmbkille and Convoy Waste Water Treatment Plants
Scope:
Bundoran: construction of a new 12,000PE wastewater treatment plant, a new
west end pumping station and rising main, 2.2km of gravity foul sewers,
29 | Irish Water | Revenue Control 3 (2020-2024) | Network Capital Expenditure Look Backrefurbishment of the existing main pumping station and construction of a storm
water storage tank.
Killybegs: construction of a new 4,200PE wastewater treatment plant and a new
wastewater collection network.
Glencolumbkille: construction of a new 1,000PE wastewater treatment plant and
a new wastewater collection network.
Convoy: upgraded 3,500PE wastewater treatment plant and upgrade works to
the existing sewerage collection network.
Benefits:
Removal from list of locations highlighted by the EPA in their UWWT Report as
having no wastewater treatment
No untreated wastewater discharging directly into the sea in the areas of
Bundoran, Killybegs and Glencolumbkille. The works in Bundoran have ended
the discharge of the equivalent of 9,600 wheelie bins of raw sewage per day
into the sea. The equivalent number in Killybegs is 3,300 wheelie bins of raw
sewage, and 800 wheelie bins at Glencolumbkille.
The works ensure that wastewater is treated and discharged in compliance with
the Urban Wastewater Treatment Regulations and with the conditions of the
Wastewater Discharge Licence (WWDL) issued by the EPA. It will also improve
the water quality of nearby coastal areas, protecting bathing areas and the
aquatic environment from pollution.
These works and upgrades increase the treatment capacity to meet the current
needs of the towns and to allow for future growth.
Figure B5: Glencolumbkille WWTP, Co. Donegal.
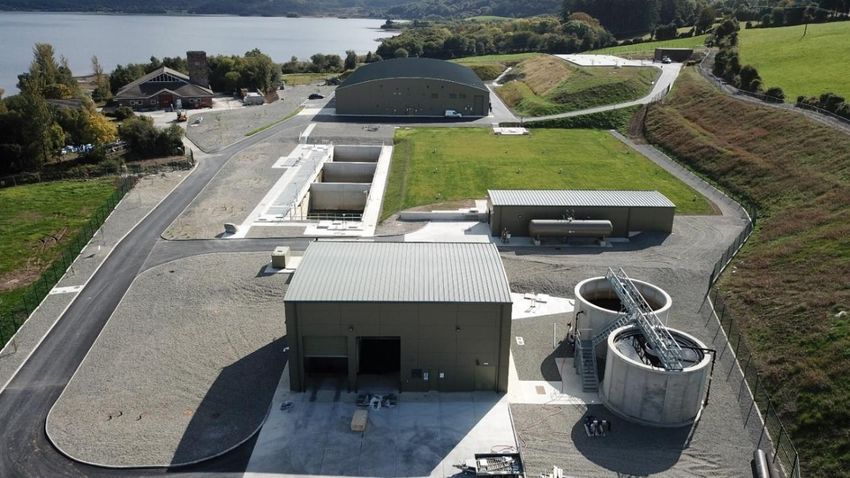
30 | Irish Water | Revenue Control 3 (2020-2024) | Network Capital Expenditure Look BackB6. Youghal Waste Water Treatment Plant / Sewerage Scheme (Co.
Cork)
Completion
Project Investment Date
Name Region
Number (€m)
10001156 Youghal Waste Water
Region 2 -
Treatment Plant / €28 million
10001157 Munster Spring 2018
Sewerage Scheme
Table B6: Youghal Wastewater Treatment Plant / Sewerage Scheme
Scope:
Construction of a new 16,000PE wastewater treatment plant (expandable to
24,000PE).
Upgrade of the existing pumping stations.
Constructing a new pumping station at Green Park.
Installing c. 9kms of new or upgraded sewers and pumping mains.
Constructing new rising mains to connect catchments.
Benefits:
Removal from list of locations highlighted by the EPA in their UWWT Report as
having no wastewater treatment.
No untreated wastewater discharging directly into the sea in Youghal.
The works ensure that wastewater is treated and discharged in compliance with
the Urban Wastewater Treatment Regulations and with the conditions of the
WWDL issued by the EPA. It will also improve the water quality of nearby
coastal areas, protecting bathing areas and the aquatic environment from
pollution.
Facilitate growth in local population, tourism and economic development
31 | Irish Water | Revenue Control 3 (2020-2024) | Network Capital Expenditure Look BackYou can also read