IS THE CORONAVIRUS ROCKING THE FOUNDATIONS OF CAPITAL MARKETS? - How the economic crisis induced by the coronavirus is impacting capital markets ...
←
→
Page content transcription
If your browser does not render page correctly, please read the page content below
IS THE CORONAVIRUS
ROCKING THE FOUNDATIONS
OF CAPITAL MARKETS?
How the economic crisis induced by the coronavirus is
impacting capital markets, investment management and the
authorities’ response
June 2020
IS THE CORONAVIRUS
ROCKING THE
FOUNDATIONS OF
CAPITAL MARKETS?
How the economic crisis induced by the coronavirus
is impacting capital markets, investment management
and the authorities’ response
Results of a membership survey conducted
by CFA Institute

June 2020
DISCLAIMER: In the mainland of China, CFA Institute accepts CFA®
charterholders only.

The mission of CFA Institute is to lead the investment profession globally by
promoting the highest standards of ethics, education, and professional
excellence for the ultimate benefit of society.

CFA Institute, with more than 170,000 members worldwide, is the not-for-profit
organization that awards the Chartered Financial Analyst® (CFA) and Certifi-
cate in Investment Performance Measurement® (CIPM) designations. CFA®,
Chartered Financial Analyst®, AIMR-PPS®, and GIPS® are just a few of the
trademarks owned by CFA Institute. To view a list of CFA Institute trademarks
and the Guide for the Use of CFA Institute Marks, please visit our website at
www.cfainstitute.org.

© 2020 CFA Institute. All rights reserved. No part of this publication may be
reproduced, stored in a retrieval system, or transmitted, in any form or by
any means, electronic, mechanical, photocopying, recording, or otherwise,
without the prior written permission of the copyright holder. This publication
is designed to provide accurate and authoritative information in regard to the
subject matter covered. It is sold with the understanding that the publisher
is not engaged in rendering legal, accounting, or other professional service. If
legal advice or other expert assistance is required, the services of a
competent professional should be sought.
Contents
 1. Executive Summary                                                            1
 2. Introduction                                                                 3
    2.1   Background to the Study and Why CFA Institute
          Surveyed its Members                                                   3
    2.2 Survey Details and Methodology                                           7
    2.3 Highlights                                                               7
 3. Details of Results                                                          11
    3.1   A Conservative Economic Recovery—Which Alphabet
          Letter will it Be?                                                    11
    3.2 Finance Professionals Circumspect in the Face of Volatility
        and Liquidity—Could Mispricing be an Issue?                             15
    3.3 Public Authorities have Rolled out Heavy Support
        Artillery—Was this Warranted, Should it Stop,
        or Will We Need Life Support for Eternity?                              27
    3.4 A Regulatory Conundrum—To Relax or not to Relax,
        to Ban or not to Ban?                                                   31
    3.5 Ethics in Times of Crisis—Are Morals Stronger than Greed?               38
    3.6 Free Markets and the Economy—Do we even need Markets,
        and will there Still be Private Companies Left?                         42
    3.7 Active Investing—The Return?                                            46
    3.8 Finance Jobs—Should we be Worried, or is Employment
        more Resilient than Feared?                                             49
 4. Appendix 1. Survey Demographics                                             54

                                    © 2020 CFA INSTITUTE. ALL RIGHTS RESERVED.    iii
This page intentionally left blank
1. Executive Summary
  CFA Institute has conducted a survey of its global membership to analyse the effects of the
  current economic crisis caused by the coronavirus epidemic on financial markets and the
  investment management industry. The survey was run worldwide from 14 to 24 April 2020.

  The uniqueness of the current situation has its roots in the nature of the economic crisis. It
  was de facto self-inflicted at a time when the economy was in relatively stable conditions and
  markets were not displaying specific or urgent signs of stress and imbalance. Public authori-
  ties, regulators, central banks, and market operators have therefore struggled to tap into old
  playbooks to find the appropriate response. Essentially, the actions of public authorities have
  focused on a clear endeavour to ensure that the widespread economic stoppage does not
  morph into a full-blown crisis of trust and a dislocation of financial markets. These actions
  could be likened to a massive bridge or airlift between the before and after crisis, not too
  dissimilar, conceptually, to the 1948–49 Berlin airlift aimed at sustaining the population of
  West Berlin while awaiting a structural resolution to the political crisis.

  Naturally, in such circumstances it is difficult to find meaningful commentaries on the
  possible outcomes, as the situation changes almost daily. CFA Institute is trying to bring
  clarification and stabilisation to the wide array of public commentary currently raging.
  The risks are not insignificant, as the very nature of financial markets and the role of the
  financial industry as an allocator and distributor of capital to the economy could change.
  Through its global expert membership, CFA Institute is in a unique position to separate
  the wheat from the chaff by dissecting the true trends at play right now. Perhaps the
  truth, as often, lies somewhere in the middle.

  These are the themes that have been explored in the study:

  ■   The shape of a potential economic recovery

      CFA charterholders appear more conservative than the current often optimistic tone
      seen in banking and industrial corners, by largely favouring a medium-term (hockey
      stick–shaped) or slow-paced economic recovery (U-shaped).

  ■   The market impact on volatility, liquidity and price formation

      Responses indicate investment firms are not panicking in the face of heightened vola-
      tility and lower liquidity, as they are still observing in large part if and how strategic
      asset allocation should be altered. However, there is a real risk that the current stress
      could result in specific asset mispricing imbalances.

                                          © 2020 CFA INSTITUTE. ALL RIGHTS RESERVED.            1
Is the Coronavirus Rocking the Foundations of Capital Markets?
■ The interventionism of public authorities
The decision to intervene by supporting the economy and markets appears to be vin-
dicated by respondents. Yet, they are divided on whether this aid should be continued
to support the recovery or stopped as soon as possible to allow fiscal rigour and free
markets to take over.
■ The regulatory response
A similar dichotomy is observed in the response provided by market conduct and
security regulators. In general, finance professionals seem to agree conduct rules
should not be relaxed in times of crisis, yet they also think regulators have a role to
play in holding the market’s hands through consulting with industry on appropriate
measures. A certain degree of corporate responsibility is also supported as respon-
dents believe companies that have received public support should not pay dividends or
pay executive bonuses. However, professionals reject a ban on short selling.
■ Ethics in times of crisis
There is a risk that the current stressed conditions will generate unethical behaviour in the
investment management industry, according to professionals. This should be monitored.
■ The role of finance and its business model
There appears to be a recognition that markets are an important part of how the
economy operates and that it is important to show these markets continue to func-
tion appropriately. The crisis will also have a structural impact on the industry as
large-scale bankruptcies are expected, but also an accelerated effort to use operational
automation to reduce fixed costs.
■ The active versus passive debate
The jury is still out to determine if a crisis situation could signal a return in good
graces of active strategies. A significant proportion of respondents believe this is
unlikely, which could indicate deeper foundational shifts in the industry and public
perception that the crisis is not altering.
■ The impact on employment in the financial space
It looks too early to tell if the current crisis will have a significant impact on finance
jobs. Most firms appear to be in waiting mode or have resorted to hiring freezes while
waiting for a clearer landscape. Yet, a not insignificant proportion of professionals are
worried about job security in the short term.
2 WWW.CFAINSTITUTE.ORG2. Introduction
2.1 Background to the Study and Why CFA Institute
Surveyed its Members
CFA Institute is the global association of investment professionals that sets the standard
for professional excellence and credentials. The organisation is a champion of ethical
behaviour in investment markets and a respected source of knowledge in the global finan-
cial community. Our aim is to create an environment where investors’ interests come first,
markets function at their best, and economies grow. There are more than 170,000 CFA
charterholders worldwide in 162 markets. CFA Institute has nine offices worldwide, and
there are 158 local member societies. For more information, visit www.cfainstitute.org or
follow us on Twitter at @CFAInstitute and on Facebook.com/CFAInstitute.
A Historical Perspective
The economic crisis we are currently going through is unprecedented in that it is self-
inflicted as a common societal response to the medical emergency caused by the coronavirus.
It is special from a historical perspective because contrary to preceding crises, this one did
not have as trigger a real economic shock or imbalance of some sort and neither was it the
result of high-flying financiers fiddling with markets, insider trading, interest rates, debt,
currencies, or derivatives. The economic recession in the 1980s and the ensuing stagfla-
tion had been caused by the two preceding oil shocks in 1973 and 1979. Black Monday in
1987 is believed to have been triggered by a sudden realisation that indebtedness was maybe
becoming a problem. The Great Bond Massacre of 1994 was caused by a hawkish mon-
etary policy twist by the US Federal Reserve that forced overly leveraged bond portfolios to
liquidate positions. The 1997 and 1998 crises in Asia and Russia had to do with currency
imbalances and untenable pegs to the US dollar. The 2007–08 subprime crisis started in
the United States as a collapse of the housing bubble, which got compounded by excesses in
structured finance and created worldwide ramifications thanks to the globalisation of finan-
cial markets—a global financial and liquidity crisis ensued. In 2010–2012, the Euro area
suffered its most severe currency and monetary crisis, starting with fears of a Greek default.
This time, with the current crisis that started around February 2020, there was no
liquidity dislocation, equity markets were performing well, and the global economy was
© 2020 CFA INSTITUTE. ALL RIGHTS RESERVED. 3Is the Coronavirus Rocking the Foundations of Capital Markets?
still on a positive growth path. We could argue these relatively good times were perhaps
single-handedly supported by a seemingly never-ending expansionary monetary policy,
as well as rising indebtedness of governments, households, and corporates, but there was
no sign of an imminent collapse so long as consumption kept going.
This crisis was simply created by a sudden voluntary stoppage in economic activity, a
coordinated demand and supply shock. By 29 March 2020, some form of lockdown had
been instated in 47 countries, and this figure had risen to 80 countries by the end of April.1
The Economic and Market Impact Was Real and Severe
Naturally, the impact on the global economy and markets was immediate and severe. It
was like a mathematically logical and engineered chain reaction that should actually have
come as no surprise. Economist Paul Krugman referred to this situation as a “medically
induced coma” that would require a massive dose of fiscal aid, more akin to “disaster relief ”
than to a stimulus package.2 In terms of observable impact, by the end of March through
the early days of April 2020—that is, before the government packages took effect—the
global economy had taken a nose dive:
■ Global stock markets dropped by 20% to 30% as compared to January.
■ The implied S&P500 volatility index (CBOE VIX), at 82, reached levels last seen in
2008.
■ Credit spreads were sharply on the rise for financials and corporates.
■ Unemployment made an almost instantaneous and historically unprecedent jump
after steadily falling in the United States since 2010. By end-April 2020, the total
number of unemployed in the United States had reached 30 million. According to the
US Treasury, the US unemployment rate could reach 20%, a level unseen since the
1930s Great Depression.
■ Oil prices saw an 18-year low at USD23.00 per barrel (Brent crude).
■ Of course, OECD shattered global growth forecasts.
1 See Aura Vision, “Global Covid-19 Lockdown Tracker,” regularly updated, accessed 21 May 2020, https://covid19-
lockdown-tracker.netlify.app/image.png.
2 Paul Krugman, Twitter, @paulkrugman, 31 March 2020.
4 WWW.CFAINSTITUTE.ORG2. Introduction
How Governments and Authorities Reacted
Governments and central banks then decided to enact record-breaking economic relief
programs through fiscal policy, government spending, and monetary policy. Central
banks also sought to lift some pressure off markets by giving clear signals they would act
as buyer and market maker of last resort.
On 27 March, the US Congress passed the CARES Act, which includes both spending
and loan guarantee programs, worth overall between USD2.0 trillion and USD6.0 tril-
lion, which compared to a 2019 total federal spending amount of USD4.45 trillion.3
In the EU, the European Central Bank (ECB) announced an economic stimulus program
worth EUR750 billion on 19 March 2020. The central bank said in a statement the gov-
erning council had decided to launch a temporary asset purchase program to navigate the
economic downturn across the eurozone linked to the coronavirus outbreak. The program
should last until the end of 2020. Under the new program, called the Pandemic Emergency
Purchase Programme (PEPP), the central bank would buy both public and private securi-
ties in a “flexible manner.” According to the ECB, “The governing council will terminate
net asset purchases under PEPP once it judges that the coronavirus COVID-19 crisis
phase is over, but in any case not before the end of the year.” The central bank indicated it
could still go further. Judging by what has happened since and early May announcements,
the ECB did indeed decide to implement further market support measures.
So what was CFA Institute’s Intention with this Survey?
Through its global membership, CFA Institute is uniquely positioned to participate in the
ongoing debate about the potential effects of the crisis on capital markets and investment
management.
Yet, prudence was of the essence as, by definition, we could not analyse current events
from the prism of historical situations of stress or with the benefit of hindsight.
This survey and the accompanying study are just one example of how CFA Institute has
endeavoured to be a source of stabilisation and clarification as markets and commentators
continue to grapple with tremendous difficulties in analysing the unfolding underlying
trends:
3 H.R. 748, CARES Act, Public Law 116-136, Congressional Budget Office, 27 March 2020, https://www.cbo.gov/
publication/56334.
© 2020 CFA INSTITUTE. ALL RIGHTS RESERVED. 5Is the Coronavirus Rocking the Foundations of Capital Markets?
■ The Systemic Risk Council (sponsored by CFA Institute) made a series of recommen-
dations for ways the financial and economic authorities can respond to the economic
elements of the current pandemic health crisis.4
■ CFA Institute Research resources – Coronavirus and Market Volatility section. As we
continue to gauge the long-term impact of the novel coronavirus, CFA Institute is work-
ing to provide resources and to support the development of policy measures that address
the functioning of markets and the financial system. We are providing research—
including analysis on lessons learned from past financial crises—to help guide the
investment management industry during this time of instability and uncertainty.5
■ On 7 April 2020, Egon Zehnder and CFA Institute virtually convened 24 CEOs
from asset management firms across Asia, Oceania, Europe, and North America for
a discussion of the impact that COVID-19 is having on their sector. Marg Franklin,
CEO of CFA Institute, asked the audience how they were responding to the chang-
ing environment. Among topics discussed were the reaction of employees and clients,
change management, operational flexibility, technology, stewardship, and environ-
mental, social, and governance (ESG) issues.6
The current exceptional circumstances and the subsequent reaction of authorities are
directly impacting the normal functioning of financial markets and practitioners. With
this survey and the accompanying study, CFA Institute has aimed to clarify how experts
and professionals active in the various sectors of capital markets and investment manage-
ment think about the effects of the current crisis.
Several perspectives are analysed:
■ economic situation and potential recovery
■ market impact on volatility, liquidity, and price formation
■ interventionism of governments and central banks
4 “SRC Statement on Financial System Actions for Covid-19,” Systemic Risk Council, accessed 20 May 2020,
https://www.systemicriskcouncil.org/; SRC, “Proposed Measures to Address Economic Elements of Current
Pandemic Crisis,” 19 March 2020, http://4atmuz3ab8k0glu2m35oem99-wpengine.netdna-ssl.com/wp-content/
uploads/2020/03/SRC-signed.pdf.
5 “Coronavirus and Market Volatility,” Research & Analysis, CFA Institute, accessed 21 May 2020, https://www.
cfainstitute.org/en/research/coronavirus.
6 Egon Zehnder, “Asset Management: ‘All Firms Will Be Remembered by How They Treat Employees and Clients,’”
Asset Management, 27 April 2020, https://www.egonzehnder.com/industries/financial-services/asset-management/
insights/asset-management-all-firms-will-be-remembered-by-how-they-treat-employees-and-clients.
6 WWW.CFAINSTITUTE.ORG2. Introduction
■ regulatory response
■ overview of ethics in times of crisis
■ impact on the asset management business model and role of finance
■ changes, if any, to the active versus passive debate
■ preliminary analysis of CFA Institute members’ employment situation
2.2 Survey Details and Methodology
CFA Institute set out to survey its members on the effects the coronavirus-induced eco-
nomic crisis is having on capital markets in general and the investment management
industry in particular. We have sought to clarify the debate and public commentary on
a few aspects particularly relevant for our core membership and touching upon the econ-
omy, regulatory intervention, market impact, ethics, asset management business model,
and employment in the financial space.
The survey was fielded to the global membership of CFA charterholders across all regions
and jurisdictions where the organisation has representation.
The survey was sent on 14 April 2020 and closed on 24 April 2020.
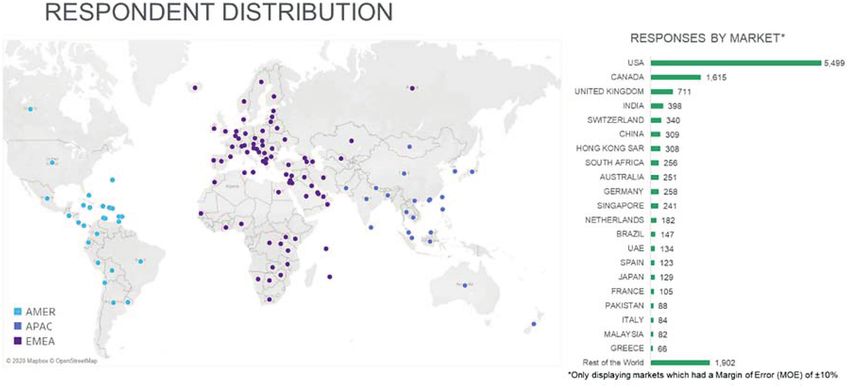
A total of 167,312 individuals received an invitation to participate. Of those, 13,278 pro-
vided a valid answer, for a total response rate of 8%. The margin of error was +/-0.8%. See
Appendix 1 for a detailed review of the survey’s demographics.
2.3 Highlights
Key highlights and statistics from the survey are as follows:
■ On the shape of a potential economic recovery. The data show that most respon-
dents are on the conservative side of the spectrum as compared to industry and
banking CEOs, who appear more optimistic. Of these respondents, 44% see a
medium-term hockey stick–shaped recovery, which implies some form of stagna-
tion for two to three years before we see a steady pickup. A further 35% are see-
ing a U-shaped recovery, essentially mildly more optimistic in the short term than
the hockey stick. Only 10% are envisaging a quick V-shaped recovery. It is worth
© 2020 CFA INSTITUTE. ALL RIGHTS RESERVED. 7Is the Coronavirus Rocking the Foundations of Capital Markets?
pointing out that only 4% are prophesying long-term economic stagnation, similar
to what economist Nouriel Roubini has been alluding to (i.e., the lost decade of the
2020s). Finally, we should mention that the answers given on this question show no
significant regional differences.
■ On market volatility. A large majority of approximately three-quarters of respon-
dents are either still analysing how volatility is moving before they make a decision
on strategic asset allocation or are seeing no significant impact from a strategic stand-
point. The other one-quarter have significantly modified their strategic allocation. On
this last metric measuring if firms have had to change their allocation, respondents
from Latin America (44%) and South Asia (38%) appear to have been more affected
by volatility jitters than have respondents in Europe (26%) and North America (22%).
■ On market liquidity. There are significant variations per type of asset and region. For
investment-grade corporate bonds in developed markets, a large majority of three-
quarters of respondents believe that liquidity is down, yet 40% overall have seen a
positive stabilisation impact from the central bank intervention. The picture is rea-
sonably similar for government bonds in developed markets. However, central bank
intervention seems to have had a lesser impact on emerging markets, with one-half
of respondents seeing liquidity of government bonds and equities down over there.
Liquidity in global developed market equities seems to have suffered less from the
market rout, with 31% believing the level of liquidity has dropped. Of note, only a
minority thought we are facing a severe liquidity shock that could result in fire sales
and dislocation, potentially indicating that markets at large are not panicking; the
highest figure on this issue was found with respondents in Africa, Southeast Asia,
and East Asia, of whom 29%, 28%, and 27% respectively thought emerging market
equities were facing a severe liquidity shock. Southeast Asia respondents were also,
conversely, at 26%, the region to believe the most in an actual uptick in liquidity, in
this case for government bonds in developed markets.
■ On the risk of specific asset mispricing. A resounding 96% of respondents believe the
crisis could result in asset mispricing specifically related to the current situation, with no
regional variations. In equal proportion, respondents indicated that the two reasons why
this would be the case are liquidity dislocation (38%) and distortion of natural market
pricing because of government intervention (36%). Respondents in Asia were most con-
cerned with liquidity (45% to 48%) whereas North America and Europe showed higher
levels of concern about public authorities distorting prices (39%). Of note, dubious pro-
fessional practices and ethics did not cause concern (2%) as regards asset mispricing.
■ On government and central bank interventionism. Overwhelmingly, respondents
seem to indicate the swift intervention of governments and central banks to support the
8 WWW.CFAINSTITUTE.ORG2. Introduction
economy and markets was a necessary stabilising factor. However, there is division on
whether this aid should be pursued further: Equally supported are that this interven-
tionism will be insufficient because it will need to be continued (49%) and that this aid
is short term and should be stopped as soon as possible to allow a deleveraging accom-
panied by fiscal rigour. Respondents in South Asia (61%) and the Middle East (59%)
were the most to think that the intervention would be insufficient and would need to be
sustained. Conversely, respondents in North America were proportionately more likely
to think this intervention, although a valid stabilising factor, would need to stop as soon
as possible so that deleveraging could take place with some degree of fiscal rigour.
■ On regulation of financial services in times of crisis. Over half of respondents over-
all believe that conduct regulation should not be relaxed to encourage trading and
liquidity. At the same time, respondents seem to believe that regulators have a role to
play in the crisis response and its aftermath: Thus 69% think regulators should actively
seek the appropriate response through consulting with industry, and over half believe
they should design specific regulatory mechanisms to help restart market activity. At a
regional level, respondents in North America seem more often inclined to refuse regu-
latory intervention altogether on the basis that markets should be able to fix themselves
(23%) versus 19% in Europe and 13% in South Asia. This latter region was also the one
where 38% of respondents agree regulation should be relaxed versus 26% overall.
■ On circuit breaker and trade-stopping rules. The results are not pointing to a clear
trend either way, yet 45% believe to some extent the rules are working as intended and
are ensuring fair, efficient, and orderly markets in current conditions; 25% disagree.
Respondents in North America were more inclined to vindicate these rules than over-
all. Of note, only 54% of respondents who indicated they work for a regulator or gov-
ernment agreed the rules are working efficiently.
■ On what regulators should and should not do. Respondents are clear on a number of
points. A large majority agree companies that receive emergency support during the
crisis should be banned from paying dividends or executive bonus compensation (75%).
They also believe a ban on short selling should not be considered (83%); a review of
exchange-traded funds (ETFs) behavior during the crisis should be initiated to deter-
mine the nature of their impact (84%); regulators should focus on investor education
about risk of investor fraud in times of crisis (94%); regulators should focus on market
surveillance (82%); regulators should not consider imposing security market holidays
(82%); and regulators should not consider temporarily permitting companies to delay
reporting on changes in their financial conditions (73%). In terms of regional differences,
North America respondents were particularly allergic to short-selling bans (91%) and
were also comparatively more opposed to allowing delay in financial reporting changes
(80% versus 60% in South Asia and 70% in Europe). It is interesting to note that the
© 2020 CFA INSTITUTE. ALL RIGHTS RESERVED. 9Is the Coronavirus Rocking the Foundations of Capital Markets?
results were a bit more nuanced on whether regulators should suspend non-essential
rulemaking and examinations until the crisis has passed (59% in favour overall, with
again North America least in favour [57%] and South Asia most in favour [72%]).
■ On professional ethics in times of crisis. Results are not perfectly clear-cut. Overall,
45% of respondents think it is likely the crisis will result in unethical behavior on the
part of the investment management industry, with 30% neutral and 25% disagreeing.
There are interesting localized differences, with less developed markets in general see-
ing a higher risk in this regard.
■ On the message the financial industry should deliver to the public. Overwhelmingly,
respondents agreed the markets are an important part of how the economy operates and
the public should know they continue to function in such unprecedented conditions (44%),
as well as advocating for the public not to engage in panic selling or market timing (41%).
■ On the long-term and structural effects the crisis may be having on the financial
services industry. Equally as important with close to 40% of respondents choosing
each one of them are, first, large-scale bankruptcies and, second, an acceleration of
automation to reduce fixed costs. At 34% of response frequency, further consolidation
was also a theme, on a par with further divergence between emerging and developed
markets and, finally, a potential reduction in the globalization of financial markets.
■ On active versus passive investments. The largest portion of respondents (42%)
believe it was unlikely the crisis would reverse the steady shift into passive invest-
ments from active investing, but 31% think it would.
■ On the employment situation of members and their firms. Responses indicate that
it may be too early to tell or that while staying prudent, firms have not made drastic
changes at this stage. Notably, 54% of respondents see no change in their firm’s hir-
ing plan, and 36% report seeing a hiring freeze. Only 9% are reporting a downsizing.
Respondents in East Asia and the Middle East seem more affected as they reported
their firms had initiated a downsizing in 18% of cases, respectively. Members who
work at firms in manufacturing and utilities (e.g., oil and gas, energy) indicated in a
higher proportion that their firm is downsizing (30% and 21% respectively).
At a personal level, 77% of respondents reported no change to their situation, 12% are
concerned about their job security in the short term (26% in the Middle East), and 1%
reported to have lost their job. A statistically significant relationship exists between
what respondents’ thoughts are on the recovery and what their sentiments are on their
current employment status. Of those expecting a quick V-shaped recovery, 83% indi-
cated the crisis is not affecting their job.
10 WWW.CFAINSTITUTE.ORG3. Details of Results
3.1 A Conservative Economic Recovery—Which
Alphabet Letter will it Be?
The debate about which form of economic recovery may materialise has been raging since
day one of the decision to lockdown and forcibly subdue economic activity. This debate
essentially pitches two camps, with some degree of interconnectedness between their
proponents.
The first camp seems to bank on a quick and steady recovery, provided the lockdown does
not endure for too long. That first camp has been the territory of a few barons from some
specific industrial corners, like technology (see, e.g., Apple CEO Tim Cook in April 2020
on a possible V-shaped recovery7) or banking (see, e.g., Goldman Sachs chief strategist
Peter Oppenheimer at the end of February on the temporary nature of the impact,8 and
see ex-CEO Lloyd Blankfein in early March on the sound economic fundamentals in
the United States;9 also see Standard Chartered PLC group pointing at the end of April
2020 to a possible rapid recovery in China and other emerging markets, as well as a global
economy coming out of recession by the end of the year10).
The other camp tends to be a meeting zone for international organisations, institutional
economists, and central bankers who believe the recession may be severe and will affect
the fundamentals of the economy to the point that any recovery will be slow and difficult.
A few statistics, predictions, and statements are worth keeping in mind:
7 Lisa Eadicicco, “Apple CEO Tim Cook Reportedly Told Trump That He Predicts a V-Shaped Economic
Recovery from the Coronavirus Pandemic,” Business Insider, 24 April 2020, https://www.businessinsider.fr/us/
apple-ceo-tim-cook-tells-trump-v-shaped-economic-recovery-2020-4.
8 Hanna Ziady, “Investors Are Betting on a Quick Recovery from Coronavirus. What If They’re Wrong?” CNN
Business, 22 February 2020, https://edition.cnn.com/2020/02/21/business/company-earnings-coronavirus/index.html.
9 Lloyd Blankfein Twitter, @lloydblankfein, 9 March 2020; Theron Mohamed, “Goldman Sachs Ex-CEO Lloyd Blankfein
Predicts a ‘Quick Recovery’ for Markets from Coronavirus,” Markey Insider, 9 March 2020, https://markets.businessin-
sider.com/news/stocks/goldman-sachs-ex-ceo-lloyd-blankfein-sees-fast-coronavirus-recovery-2020-3-1028977728.
10 Sumeet Chatterjee and Lawrence White, “StanChart Sees Key Markets Leading Quick Economic Recovery After
Loan Losses Hit First Quarter,” Yahoo News, 29 April 2020, https://uk.news.yahoo.com/stanchart-profit-falls-
12-coronavirus-043636134.html.
© 2020 CFA INSTITUTE. ALL RIGHTS RESERVED. 11Is the Coronavirus Rocking the Foundations of Capital Markets?
■ The IMF projected in its April 2020 outlook report that the world economy would
contract by 3.0% in 2020.11
■ The World Bank gave in March 2020 a bleak outlook about poverty trends in East
Asia and the Pacific. Its baseline scenario considers that almost 24 million fewer
people will leave poverty status across the region in 2020 as a result of the economic
crisis. The forecasts point to growth in the region slowing to 2.1% as compared with
an estimated expansion of 5.8% in 2019.12
■ The European Commission announced in its Spring Economic Forecast that the
eurozone economy could shrink by 7.75% in 2020, which would eclipse the 2009 eco-
nomic record of the global financial crisis.13 Economy commissioner Paolo Gentiloni
warned that “the economic downturn would be sending debt and deficit ratios in the
EU soaring and then give way to an uneven recovery in 2021.”
■ German Bundesbank president Jens Weidmann gave his opinion on 5 May 2020 that
“measures to constrain and combat the coronavirus pandemic [lockdowns, social dis-
tancing] are likely to remain in place for a long time, meaning a rapid and strong
economic recovery is relatively unlikely.”
■ The Bank of England (BoE) announced in its Monetary Policy Report (May 2020)
that the UK economy could decline by around 25% between March and May. For the
whole of 2020, the BoE considers the GDP could be falling by 14%.14 For historical
comparisons, the BoE mentioned this sudden drop would be the steepest since 1706.
In this context, CFA Institute members appear to have a conservative or prudent view of
what the potential economic recovery could look like.
Close to 80% of respondents think the recovery will be slow to stagnant in the short term,
before picking up eventually in the medium term. A medium-term recovery in the shape of a
hockey stick (44%) indicates an essentially stagnant economy for two to three years before a
steady upward trend, while a “U” shape (35%) indicates a slow (subdued) pickup after reach-
ing the bottom, followed by a later acceleration phase, probably within three to five years.
11 “World Economic Outlook, April 2020: The Great Lockdown,” International Monetary Fund, April 2020, https://
www.imf.org/en/Publications/WEO/Issues/2020/04/14/weo-april-2020.
12 “The World Bank in East Asia Pacific,” World Bank, last updated 16 April 2020, accessed 20 May, 2020, https://
www.worldbank.org/en/region/eap/overview.
13 European Commission, “Spring Economic Forecast,” May 2020, https://g8fip1kplyr33r3krz5b97d1-wpengine.
netdna-ssl.com/wp-content/uploads/2020/05/Spring-2020-Economic-Forecast.pdf.
14 Bank of England, “Monetary Policy Report,” May 2020, https://www.bankofengland.co.uk/-/media/boe/files/
monetary-policy-report/2020/may/monetary-policy-report-may-2020.pdf.
12 WWW.CFAINSTITUTE.ORG3. Details of Results
What kind of recovery do you expect post the current economic and financial crisis induced by COVID-19?
50%
45% 44%
40%
35%
35%
30%
25%
20%
15%
10%
10% 8%
5% 4%
0%
Medium-term Slow U-shaped Quick V-shaped Longer-term There will not be a
hockey-stick shaped recovery recovery hockey-stick real recovery and
recovery (2–3 years) shaped recovery long-term market
(5–10 years) stagnation will
ensue
Note: Excludes “Not sure”
It is interesting to note that only 10% of respondents are expecting a quick and strong
recovery, or the famous “V” shape, which could show relative conservatism among
members.
Equally, only 4% seem to favour a fairly negative long-term stagnation scenario, such as
that described in part by economist Nouriel Roubini in early March 2020,15 referring to
a “lost decade of the 2020s.” A parallel can be established with Japan’s lost decade of the
1990s.16 Japan’s economic success of 1970–1980 is thought to have been fuelled by low
interest rates, which in turn had encouraged stock market and real estate speculation to a
point where the government had to raise interest rates, which led to a stock market crash
and a debt crisis. Japan’s economy has essentially been stagnating ever since, ridden by the
agonies of deflation.
15 Theron Mohamed, “Coronavirus Will Send Stocks and Oil into ‘Free Fall’ and Shrink the Global Economy,
‘Dr. Doom’ Economist Warns,” Business Insider, 9 March 2020, https://markets.businessinsider.com/news/stocks/
nouriel-roubini-predicts-stocks-price-oil-free-fall-coronavirus-recession-2020-3-1028977265.
16 Justin Kuepper, “What You Can Learn from Japan’s Lost Decade,” The Balance, 18 September 2019, https://www.
thebalance.com/japan-s-lost-decade-brief-history-and-lessons-1979056.
© 2020 CFA INSTITUTE. ALL RIGHTS RESERVED. 13Is the Coronavirus Rocking the Foundations of Capital Markets?
The survey showed no meaningful regional differences regarding the expected shape of
the recovery.
What kind of recovery do you expect post the current economic and financial crisis induced by COVID-19?
GLOBAL AFRICA EAST ASIA EUROPE LATIN AMERICA & CARIBBEAN
MIDDLE EAST NORTH AMERICA SOUTH ASIA SOUTHEAST ASIA & OCEANIA
60%
49%
50%
46%
46%
45%
45%
44%
43%
43%
42%
38%
40%
36%
36%
35%
34%
33%
32%
32%
31%
30%
20%
11%
10%
10%
10%
10%
9%
9%
9%
9%
9%
8%
8%
8%
8%
8%
8%
10%
7%
6%
5%
4%
4%
4%
4%
4%
3%
3%
3%
0%
Medium-term Slow U-shaped Quick V-shaped Longer-term There will not be a
hockey-stick shaped recovery recovery hockey-stick shaped real recovery and
recovery (2–3 years) recovery (5–10 years) long-term market
stagnation will ensue
Note: Excludes “Not sure”
Commentators will seek to read a potential future for the world economy in early signs of
strength or weakness in China’s economy after its gradual reopening beginning in April
2020. One question could be about the apparent pickup in China’s April exports:17 Does
it indicate inventories have been reducing while a pickup in demand from other Asian
countries is added to a backlog of orders, or will this recovery be short lived as global
demand remains subdued?
17See “Coronavirus: China’s Medical Supply Boom, Lockdown Backlog Sparked Surprise April Exports Rise,” South
China Morning Post, 7 May 2020, https://www.scmp.com/economy/china-economy/article/3083357/coronavirus-
chinas-medical-supply-boom-lockdown-backlog; or “China Exports Rebound in April on Pick-Up in Asian
Demand,” Financial Times, 7 May 2020, https://www.ft.com/content/06b25266-2921-4cdf-b7d2-499d33793e65.
14 WWW.CFAINSTITUTE.ORG3. Details of Results
The shock to the supply side of the equation will also be analysed. Proponents of the out-
put gap theory include Paul Krugman.18 The theory argues that we need to pay atten-
tion to the longer-term structural hit to the supply side caused by the crisis, which would
make any recovery subdued as the lost capacity may not recover by itself, precipitating the
economy into deflation, which would be equivalent to a direct and definite destruction of a
portion of the economy. This is in part why Krugman had been arguing that the US Cares
Act is unlikely to be sufficient and that a bigger relief program would be needed to keep
the supply capacity intact in case demand returns—a neo-Keynesian approach to ensuring
the economy can recover if both supply and demand come back together to their pre-crisis
levels. In Path Dependence and Pandemics in a Classical Growth Model,19 academics Thomas
R. Michl (Colgate University) and Daniele Tavani (Colorado State University) explain
how “a temporary unfavourable shock to the output capital ratio will permanently reduce
the employment rate.” The question will therefore become: How long can the economy
sustain such radical measures as the current lockdowns in force in many regions of the
world before it gets structurally and irreparably damaged?
3.2 Finance Professionals Circumspect in the Face
of Volatility and Liquidity—Could Mispricing be
an Issue?
With the survey, CFA Institute wanted to measure if market jitters observed since
February, following the decisions in various parts of the world to lock down economies,
have had a direct and immediate impact on financial firms and their investment strategy.
In traditional investment management theory, strategic asset allocation is focused on
long-term objectives, whereas tactical asset allocation allows a certain degree of short-
term flexibility to react to market changes and volatility.
In the case of the coronavirus crisis, it was not immediately clear if the observed and
significant market moves had prompted professionals to re-evaluate their allocations or if
they had chosen to face the music until further clarification.
18 Paul Krugman, “About That Deflation Risk,” New York Times, 4 February 2009, https://krugman.blogs.nytimes.
com/2009/02/04/about-that-deflation-risk/.
19 Thomas R. Michl and Daniele Tavani, “Path Dependence and Pandemics in a Classical Growth Model” (working
paper, PERI: Political Economy Research Institute, University of Massachusetts, Amherst, 30 April 2020), PERI,
https://www.peri.umass.edu/publication/item/1283-path-dependence-and-pandemics-in-a-classical-growth-model.
© 2020 CFA INSTITUTE. ALL RIGHTS RESERVED. 15Is the Coronavirus Rocking the Foundations of Capital Markets?
We chose to focus our market analysis on two dimensions: volatility and liquidity. The
ultimate objective was to measure if there was a risk that the specific market situation
caused by the coronavirus crisis could harm the normal price formation process and if so,
to determine the likely causes.
As shown on Charts 1 and 2 (source: Bloomberg), equity volatility initially reacted
very strongly and quickly to announcements of lockdowns and the immediate effects
on employment and economic activity seizure, with the VIX Index in the United States
going back to levels last seen during the 2008–09 global financial crisis (the VIX mea-
sures the implicit volatility of the SP500 options traded on the CBOE). Yet, government
and central bank interventions calmed those markets significantly, which is reflected in
the results of the survey.
CHART 1. VIX INDEX (SINCE 1998)
90
80 VIX Index daily (source: Bloomberg)
70
2007–2009 global 2020 coronavirus
60 crisis
financial crisis
50
40
30
20
10
0
1998-12-30
1999-12-30
2000-12-30
2001-12-30
2002-12-30
2003-12-30
2004-12-30
2005-12-30
2006-12-30
2007-12-30
2008-12-30
2009-12-30
2010-12-30
2011-12-30
2012-12-30
2013-12-30
2014-12-30
2015-12-30
2016-12-30
2017-12-30
2018-12-30
2019-12-30
Source: Bloomberg
16 WWW.CFAINSTITUTE.ORG3. Details of Results
CHART 2. VIX INDEX (YTD 2020)
90
80 VIX Index daily (source: Bloomberg)
70
60
50
40
30
20
10
0
2020-01-01
2020-01-08
2020-01-15
2020-01-22
2020-01-29
2020-02-05
2020-02-12
2020-02-19
2020-02-26
2020-03-04
2020-03-11
2020-03-18
2020-03-25
2020-04-01
2020-04-08
2020-04-15
2020-04-22
2020-04-29
2020-05-06
2020-05-13
2020-05-20
Source: Bloomberg
The story is similar for bonds, using as reference the MOVE Index published by ICE
BoA ML (see Charts 3 and 4). The index measures the implicit volatility of options on US
Treasuries for two-, five-, 10-, and 30-year maturities.
© 2020 CFA INSTITUTE. ALL RIGHTS RESERVED. 17Is the Coronavirus Rocking the Foundations of Capital Markets?
CHART 3. MOVE INDEX (SINCE 1999)
275
Move Index daily (source: Bloomberg)
225
2007–2009 global
financial crisis
175
2020 coronavirus
crisis
125
75
25
1998-12-30
1999-12-30
2000-12-30
2001-12-30
2002-12-30
2003-12-30
2004-12-30
2005-12-30
2006-12-30
2007-12-30
2008-12-30
2009-12-30
2010-12-30
2011-12-30
2012-12-30
2013-12-30
2014-12-30
2015-12-30
2016-12-30
2017-12-30
2018-12-30
2019-12-30
Source: Bloomberg
On the liquidity in bond markets, an indirect measure to use are the spreads of credit
default swaps (CDS), which provide an estimation of the cost of insuring against the risk
of default of various different bond and fixed-income instruments, whether sovereign or
corporate. Larger CDS spreads indicate the market’s level of fear is also rising, which may
in turn result in underlying instruments’ liquidity diminishing on expectations of credit
rating downgrades or outright defaults. As Charts 5 and 6 indicate (source: Bloomberg
and Markit), CDS spreads on investment-grade corporate bonds in North America,
Europe, and Asia ex-Japan have strongly risen on the effects of lockdown announcement
in February and March, before retreating on governments’ relief programs and central
bank expansionary monetary policy decisions. It is worth noting that these CDS spreads
have not reached the levels seen during the 2007–09 global financial crisis.
18 WWW.CFAINSTITUTE.ORG40
50
60
70
80
90
100
110
120
130
140
150
160
170
2020-01-01
2020-01-08
Source: Bloomberg
2020-01-15
2020-01-22
2020-01-29
2020-02-05
2020-02-12
2020-02-19
CHART 4. MOVE INDEX (YTD 2020)
2020-02-26
Move Index daily (source: Bloomberg)
2020-03-04
2020-03-11
2020-03-18
2020-03-25
2020-04-01
2020-04-08
2020-04-15
2020-04-22
2020-04-29
2020-05-06
© 2020 CFA INSTITUTE. ALL RIGHTS RESERVED.
2020-05-13
2020-05-20
3. Details of Results
19Is the Coronavirus Rocking the Foundations of Capital Markets?
CHART 5. CDS SPREADS FOR INVESTMENT-GRADE CORPORATE BONDS IN THE US AND
EUROPE—MARKIT ITRAXX AND CDX (SINCE 2011)
220
200 ITRX EUR CDSI GEN 5Y Corp CDX NA IG CDSI GEN 5Y Corp
180
160
140
120
100
80
60
40
2011-10-12
2012-04-12
2012-10-12
2013-04-12
2013-10-12
2014-04-12
2014-10-12
2015-04-12
2015-10-12
2016-04-12
2016-10-12
2017-04-12
2017-10-12
2018-04-12
2018-10-12
2019-04-12
2019-10-12
2020-04-12
Source: Bloomberg and Markit
20 WWW.CFAINSTITUTE.ORG3. Details of Results
CHART 6. CDS SPREADS FOR INVESTMENT-GRADE CORPORATE BONDS IN THE US,
EUROPE AND ASIA EX-JAPAN—MARKIT ITRAXX AND CDX (YTD 2020)
180
ITRX EUR CDSI GEN 5Y Corp
160 CDX NA IG CDSI GEN 5Y Corp
ITRX EXJP IG CDSI GEN 5Y Corp
140
120
100
80
60
40
2020-01-01
2020-01-08
2020-01-15
2020-01-22
2020-01-29
2020-02-05
2020-02-12
2020-02-19
2020-02-26
2020-03-04
2020-03-11
2020-03-18
2020-03-25
2020-04-01
2020-04-08
2020-04-15
2020-04-22
2020-04-29
2020-05-06
2020-05-13
2020-05-20
Source: Bloomberg and Markit
In the face of such market jitters, the CFA Institute membership appears to reflect that
firms in general are staying cautious and are awaiting a clarification of market trends
before considering making serious alterations to their investment strategy. Still, 26% have
reported that their firms have had to make significant changes. Regionally, there seems
to be a tendency for emerging markets to have been more severely impacted by market
volatility, especially in Latin America and South Asia, where 44% and 38% respectively
are reporting that their firms have had to alter allocation choices.
© 2020 CFA INSTITUTE. ALL RIGHTS RESERVED. 21Is the Coronavirus Rocking the Foundations of Capital Markets?
Market volatility has moved sharply since the worldwide emergence of the COVID-19 crisis, for
global equities and fixed income instruments. Select the statement that best describes how
you feel about market volatility:
45%
42%
40%
35%
32%
30%
26%
25%
20%
15%
10%
5%
0%
My firm is currently Market volatility has Market volatility has forced
investigating how market had no significant my firm to significantly alter
volatility could impact our impact on my activity its investment management
strategic asset allocation or or my firm’s activity processes or allocation
investment choices choices
Note: Note: data excludes “Don’t Know” and “Not relevant for me”
22 WWW.CFAINSTITUTE.ORG3. Details of Results
Market volatility has moved sharply since the worldwide emergence of the COVID-19 crisis, for global equities
and fixed income instruments. Select the statement that best describes how you feel about market volatility:
GLOBAL AFRICA EAST ASIA EUROPE LATIN AMERICA & CARIBBEAN
MIDDLE EAST NORTH AMERICA SOUTH ASIA SOUTHEAST ASIA & OCEANIA
50%
47%
47%
44%
44%
45%
42%
42%
42%
41%
40%
38%
40%
36%
36%
34%
34%
33%
33%
35%
32%
28%
30%
26%
26%
25%
25%
24%
25%
22%
22%
19%
20%
17%
15%
10%
5%
0%
My firm is currently Market volatility has Market volatility has forced
investigating how market had no significant my firm to significantly alter
volatility could impact our impact on my activity its investment management
strategic asset allocation or my firm’s activity processes or allocation
or investment choices choices
Note: Note: data excludes “Don’t Know” and “Not relevant for me”
The question pertaining to market liquidity has also yielded interesting results, which
vary quite significantly depending on the type of asset and the region under consideration.
The general conclusion is that liquidity has been affected across the board, yet that gov-
ernment and central bank intervention has had a serious stabilising effect. This stabilising
effect has, however, not been as effective in emerging markets as it has been in developed
markets. Worthy of note is that central bank intervention is perceived to have been sig-
nificantly more impactful in corporate and sovereign bond developed markets than for
© 2020 CFA INSTITUTE. ALL RIGHTS RESERVED. 23Is the Coronavirus Rocking the Foundations of Capital Markets?
equities. This could indicate yet again that bond markets in general were benefitting from
serious and direct central bank support even before the crisis and that this support contin-
ues to be necessary for bond markets to function.
Only a minority of respondents think we are facing a severe liquidity shock that could
result in fire sales and dislocation, potentially indicating that markets at large are not pan-
icking. The highest figure on this issue was found with respondents in Africa, Southeast
Asia, and East Asia, of whom 29%, 28%, and 27% respectively thought emerging market
equities were facing a severe liquidity shock.
In your opinion based on your relevant trading experience, how has COVID-19 affected the level of
market liquidity in each of the following secondary markets:
Corporate bonds (Investment Grade) in developed markets Emerging market equities
Global equities in developed markets Government bonds in developed markets
Government bonds in emerging markets
60%
50%
49%
50%
42%
40%
36%
40%
31%
25%
30%
23%
23%
22%
21%
19%
20%
15%
14%
14%
13%
11%
10%
10%
10%
6%
6%
6%
6%
5%
4%
0%
Liquidity has Liquidity is down Liquidity was going No marked There is a liquidity
gone up down, but central change shock that could
bank intervention has result in fire sales
stabilized the markets and dislocation
Note: Excludes “Don’t know” and “Not relevant for me”
This analysis then takes us to the ultimate question related to the specific risk of asset mis-
pricing. Overwhelmingly, respondents agree in largely similar proportions across regions
that the current market conditions could give rise to a risk of asset mispricing.
24 WWW.CFAINSTITUTE.ORG3. Details of Results
Do you think the current crisis increases the chance of
asset mispricing specifically related to the current
situation of financial stress?
120%
100% 96%
80%
60%
40%
20%
4%
0%
Yes No, there is no specific
risk of asset mispricing
Note: Excludes “Don’t know”
At respectively 38% and 37%, liquidity dislocation and the distortion caused by public
intervention were the two causes most often cited overall to explain how asset mispricing
may take place. Of note, bad professional ethics was cited by only 2% of respondents over-
all. Respondents in Asia were the most concerned with liquidity (45% to 48%), whereas
North America and Europe showed higher levels of concern about public authorities dis-
torting prices (39%).
© 2020 CFA INSTITUTE. ALL RIGHTS RESERVED. 25Is the Coronavirus Rocking the Foundations of Capital Markets?
What is the most likely reason that the current crisis increases the chance of asset mispricing?
GLOBAL AFRICA EAST ASIA EUROPE LATIN AMERICA & CARIBBEAN
MIDDLE EAST NORTH AMERICA SOUTH ASIA SOUTHEAST ASIA & OCEANIA
60%
48%
50%
45%
43%
40%
39%
39%
38%
37%
37%
40%
36%
36%
35%
33%
32%
30%
28%
30%
26%
26%
20%
15%
15%
14%
13%
13%
12%
11%
11%
11%
10%
10%
10%
9%
9%
9%
8%
10%
7%
7%
6%
6%
5%
5%
4%
4%
4%
3%
3%
3%
3%
3%
2%
2%
2%
2%
2%
1%
0%
Because of a Because of public Because of Because government Because of wrong Other
liquidity authorities’ improper financial authorities are professional ethics
dislocation intervention information being allowing securities on the part of
distorting natural disclosed in times issuers to withhold market
market pricing of crisis critical information, participants, taking
forcing investors to advantage of
guess on how bad market stress
things are
Interpreting how market practitioners have reacted to public intervention is a theme that
is explored as well in this survey and study. It will show the CFA Institute membership
is not entirely settled on the necessity for authorities and central banks to intervene in
markets or for how long this intervention should be sustained.
26 WWW.CFAINSTITUTE.ORG3. Details of Results
3.3 Public Authorities Have Rolled Out Heavy
Support Artillery—Was this Warranted, Should it
Stop, or Will We Need Life Support for Eternity?
In a new report released in May 2020, the Asian Development Bank (ADB)20 predicted
that “the global economy could suffer between USD5.8 trillion and USD8.8 trillion in
losses—equivalent to 6.4% to 9.7% of global gross domestic product (GDP)—as a result
of the novel coronavirus disease (COVID-19) pandemic.”
Starting in March, public authorities, governments, and central banks around the world
began implementing economic relief programs and expansionary monetary policies to
support the economy and financial markets during the lockdown. We should think of
these measures as a bridging facility between before and after the crisis, on the proviso
that supply capacity must hold and consumption must also resume unabated reasonably
quickly.
In the same report, the ADB estimated that “sustained efforts from governments focused
on these measures could soften COVID-19’s economic impact by as much as 30% to 40%.”
The ADB based its estimations on a six-month scenario in each of the 96 countries ana-
lysed, between the beginning of the disease outbreak and the time when the economy
begins to normalise. The analysis uses a model where various industries output and eco-
nomic factors are shocked to determine impact.
Government and central bank measures have been unprecedented in their scale and
depth and also in the clear messaging that authorities stand ready to intervene in unlim-
ited proportions. Former ECB president Mario Draghi’s words in July 2012, right in the
midst of the euro crisis, spring back to mind: “Whatever it takes.” Christine Lagarde,
current ECB president, has now taken a similar stance: “There are no limits to our com-
mitment to the euro.”21 Markets have therefore started to grow accustomed to central
banks playing the role of lender and market maker of last resort at any time and under
any circumstance.
20 “COVID-19 Economic Impact Could Reach $8.8 Trillion Globally—New ADB Report,” ADB, 15 May 2020,
https://www.adb.org/news/covid-19-economic-impact-could-reach-8-8-trillion-globally-new-adb-report.
21 Christine Lagarde, “Our Response to the Coronavirus Pandemic,” European Central Bank, updated 19 May 2020,
https://www.ecb.europa.eu/home/search/coronavirus/html/index.en.html.
© 2020 CFA INSTITUTE. ALL RIGHTS RESERVED. 27Is the Coronavirus Rocking the Foundations of Capital Markets?
Public authorities’ response has been of three different natures:
■ central bank measures (monetary policy, public asset purchase programmes through
quantitative easing, liquidity facilities)
■ international organisations and supranational entities measures (financing of states by
IMF, World Bank, EU, EBRD)
■ national government measures
As explained in the introduction to this report, CFA Institute has worked with the
Systemic Risk Council (SRC) on collating and digesting the operational details of these
measures in key markets around the world after the SRC public letter on its recom-
mendations for governments and central banks. Another good source on the details of
these plans is regularly prepared and updated by BNP Paribas in its ECO Flash series
on Covid-19 Key Measures.22 These works together clearly show the great magnitude of
public authorities’ response to the economic crisis that is still unfolding.
Nevertheless, questions remain as to the economic soundness and rationale of these mea-
sures or, to the contrary, whether they will be sufficient—should we even consider pursu-
ing relief for a prolonged period of time? We set out to question our membership on these
concepts.
Economist Paul Krugman has taken a clear stance on this question. At the end of March,
he was noting on social media network Twitter that the US relief program was unlikely
to be enough in the face of the current economic shutdown: “We want massive, debt-
financed disaster relief while the economy is in its medically induced coma.”23
Here is how the membership answered our questions.
22 “The Economic Research Portal,” BNP Paribas, accessed 21 May 2020, https://economic-research.bnpparibas.
com/Views/InterHomeView.aspx?Lang=en-US; and “COVID-19: Key Measures Taken by Governments and
Central Banks,” BNP Paribas Eco Flash, regularly updated, https://economic-research.bnpparibas.com/Views/
DisplayPublication.aspx?type=document&IdPdf=38920&src=mail&publication=EcoFlash.
23 Paul Krugman, Twitter, @paulkrugman.
28 WWW.CFAINSTITUTE.ORGYou can also read