Is the Worst of the Oil Crisis Behind Us? - Oxford Institute for ...
←
→
Page content transcription
If your browser does not render page correctly, please read the page content below

May 2020

 Is the Worst of the Oil Crisis Behind Us?

OXFORD ENERGY COMMENT   Bassam Fattouh and Andreas Economou
Background
With the May WTI futures contract trading at negative prices in April and as concerns about the oil
market reaching the limits for storage abound, it is difficult to be optimistic about oil prices and balances
for 2020 and 2021 (Figure 1). Despite the historic OPEC+ agreement reached in April, some are
skeptical about the impact of the announced cuts on balances given the scale of the demand shock,
the expected slow pace of the economic recovery, and doubts about the ability of many OPEC+
members to abide by the deeper output cuts. Given the high volumes of stocks accumulated during the
last few weeks (Figure 2), even if the oil market balances on a flow basis in the second half of 2020, it
will take months for OPEC+ to bring crude stocks within an ‘acceptable’ range, and the high level of
stocks, alongside the rise in spare capacity as a result of the OPEC+ cuts, will keep a ceiling on the
price recovery.

 Figure 1: NYMEX WTI                                             Figure 2: Weekly US commercial crude stocks

 Source: EIA, OIES.                                              Source: EIA, OIES.

All these factors suggest a recovery in oil prices that may turn out to be slow with many bumps in the
road ahead. However, these factors don’t imply that the worst of the oil crisis is not already behind us.
April was the worst month in terms of oil market balances and prices. During that month, the oil market
saw the largest y/y contraction in global oil demand which according to our estimates reached a
staggering 33 mb/d. Also, during that month, production from OPEC increased by 1.6 mb/d to a 13-
month high of 30.4 mb/d. If one is to add the pressures on storage and the negative sentiment following
the breakup of the OPEC+ agreement, April 2020 will be remembered as the bleakest month in the
history of oil markets.

Oil price outlook
Looking ahead however, there are signs of improvement both on the supply and demand fronts.
Lockdowns in many parts of the world are starting to ease and there are signs that this is having a
positive impact on demand, particularly gasoline demand. This by no means implies that y/y
contractions for the rest of the year will suddenly stop, but these demand contractions are projected to
ease over the rest of 2020. Also, in the month of May, OPEC+ cuts will come into effect. If there is full
compliance with the quotas, OPEC 10 output alone (excluding Libya, Iran and Venezuela) will fall by
7.1 mb/d to 20.6 mb/d from the high levels of April estimated at 27.7 mb/d (Figure 3). For some

  The contents of this paper are the authors’ sole responsibility. They do not necessarily represent the views
                        of the Oxford Institute for Energy Studies or any of its Members.
                                                                                                                 2
producers such as Saudi Arabia, Kuwait and the UAE, the fall in output will be higher than the headline
figures as the production numbers in April came above the reference which they need to cut from
(Figure 4). Also, unlike the previous 2014–2016 cycle, the supply responses from non-OPEC+ countries
have been fast and severe. The year 2020 started with expectations that non-OPEC crude supply would
perform strongly and increase by 1.4 mb/d y/y. These have been revised downwards and expectations
now are of a severe y/y contraction of 2.7 mb/d, with North America accounting for the bulk of the
decrease (1.5 mb/d). Overall, global oil supplies in May are expected to decline m/m by 11.3 mb/d (of
which OPEC crude will account for 7.2 mb/d of the total decline and non-OPEC crude for 3.7 mb/d), the
largest shut-in on record.

 Figure 3: OPEC(10) production adjustments                       Figure 4: Saudi Arabia supply

 Source: Argus, OIES.                                            Source: IEA, JODI, OIES.

The impact of these factors is already being felt on benchmark prices Brent and WTI which have risen
more than $10/b in the past few weeks. But more importantly, they are also being felt in the physical
markets. Dated Brent to futures Brent has narrowed and some of the physical differentials such as Urals
have also strengthened (Figure 5). And while the market is still in contango, the time spreads have
started to ease, and tanker rates have fallen sharply from their very high levels in recent weeks with
Very Large Crude Carrier (VLCC) earnings from the Middle East Gulf to China dropping 68 per cent in
just nine days from around $222,000 per day on 22 April to around $72,000 per day on 4 May. This
does not imply that there will no longer be downward pressure on prices in May and June. Given that
OPEC+ cuts are mainly longer-haul crude and their impact will be felt only weeks ahead, the excess
supply needs to find its way into storage. But the risk of tank-tops at the global level has dissipated, as
the pace of the crude stock build has already peaked. Concerns that the Brent benchmark, (which
consists of a basket of waterborne crudes and the Brent futures contract is financially settled) could
turn negative similar to the May WTI contract, were never realistic to start with and are less so now. All
these factors point to improvement in market fundamentals, though from a very low base.

  The contents of this paper are the authors’ sole responsibility. They do not necessarily represent the views
                        of the Oxford Institute for Energy Studies or any of its Members.                        3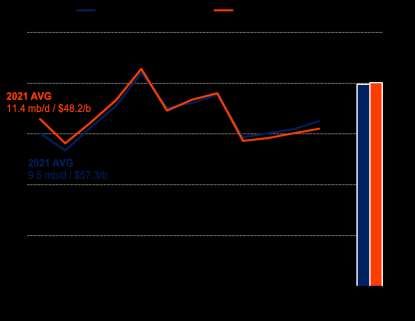
Figure 5: Price differentials
           North Sea Dated vs ICE Brent                                         Urals NWE vs ICE Brent

 Source: Argus, OIES.

In fact, the combination of these demand (easing the lockdowns) and supply factors (OPEC+ cuts and
the severe reductions in supplies outside OPEC+) could balance the market as soon as Q3 2020, in
which the expected massive surplus of 20.6 mb/d in Q2 turns into a 1.5 mb/d deficit, with the market
reversing into a 5 mb/d deficit for 2021 as a whole (Figure 6). In this case, oil prices could find important
support from market fundamentals, with Brent recovering to the $40-50/b range for most of 2021.

 Figure 6: Oil market outlook under reference case
                       Brent price                                                   Global balance

 Note: Assumes 100% compliance to the OPEC+ deal.
 Source: OIES.

  The contents of this paper are the authors’ sole responsibility. They do not necessarily represent the views
                        of the Oxford Institute for Energy Studies or any of its Members.                        4
Lockdowns and oil demand
But the range of uncertainty surrounding each of these factors is wide, with the shape of recovery of oil
demand being the key factor determining oil market outcomes. In the current context, there are no
statistical models that can capture the relationship between GDP and oil demand and therefore the
confidence bounds around demand estimates are very wide. Also, one has to factor into the estimates
the impact of lockdowns and mobility restrictions as an exogenous shock directly impacting global oil
demand, as well as indirectly via the impact on the global economy. This task is nontrivial. First, oil
consumption data and in particular consumption by product are only available with a lag and for most
non-OECD countries are incomplete. Second, the policy responses against the coronavirus pandemic
vary by country both in terms of duration and stringency. Third, the impact of these policy responses on
the various segments of global oil demand is not uniform, with sectors such as transportation and even
sub-sectors within transportation (such as road transport and aviation) having been impacted the most.
To overcome these challenges, we augment our oil demand forecast with real-time data of mobility
trends available by Apple and Google on a country-basis, as well as incorporate into the model the
“COVID-19 Government Response Stringency Index” from Hale et al. (2020) 1 that systematically
measures the stringency of government responses to COVID-19 across country and time. Further, we
calibrate our oil demand model by sector, decomposed to transportation (further disaggregated to road
transport, aviation, marine bunkering and other transport), buildings, industry and other. For specific
sectors we also utilize additional data such as changes in flight schedules for aviation, freight rate
indices for bunkering and industrial production and real economic activity indicators for industry and
other. Regarding the speed at which the lockdowns will be lifted, we follow current consensus that the
easing will be gradual through Q2 2020 and assume that all mobility restrictions will be lifted by Q3.
Figure 7: Global oil demand vs Dec 19
By region By sector
Source: OIES.
As shown in Figure 7, results suggest that demand for transportation fuels has been the worst affected,
accounting for 78 per cent of total contractions across all sectors, with the decline in demand for road
transport fuels in April reaching 23.5 mb/d, followed by the decline in jet fuel demand by 4.7 mb/d.
1 Hale, Thomas, Sam Webster, Anna Petherick, Toby Phillips, and Beatriz Kira (2020). Oxford COVID-19 Government
Response Tracker, Blavatnik School of Government. Data use policy: Creative Commons Attribution CC BY standard.
The contents of this paper are the authors’ sole responsibility. They do not necessarily represent the views
of the Oxford Institute for Energy Studies or any of its Members. 5Further, analysis suggests that the oil demand recovery is expected to be slow in 2020 and only gradual
through 2021, with global oil demand rebounding to its pre-shock levels only in Q4 2021. For 2020,
estimates suggest that y/y oil demand growth could contract by 11.4 mb/d and rebound by 10.6 mb/d
in 2021.
While these innovations in modelling demand in the context of a sudden stop to the global economy
may improve models’ predictive power, they don’t resolve the following key uncertainties:
Will the global economy witness another wave of lockdowns?
When will global oil demand reach the pre-coronavirus level? Will this be achieved in 2020, 2021
or even beyond?
Once the global economy stabilises, will we see growth rates going back to the pre-coronavirus
level? This question is in part related to the issue of whether COVID-19 will result in permanent
shifts in governments’ behaviour and consumers’ consumption and mobility patterns and accelerate
the energy transition.
No one has answers to these questions, but as shown in Figure 8 below, the balances are extremely
sensitive to the pace of demand recovery. A weaker recovery in oil demand will delay the rebalancing
process by a quarter even with 100 per cent OPEC+ compliance to the output cuts and the more severe
and persistent shut-ins of non-OPEC production. Indicatively, in Q3 2020 the market remains in surplus
by 0.7 mb/d versus a 1.5 mb/d deficit under the reference case, while the draws are nearly halved in
Q4 relative to the reference, therefore compromising the price recovery process throughout.
Figure 8: Oil market outlook under demand downside case
Brent price Global balance
Note: Assumes 100% compliance to the OPEC+ deal.
Source: OIES.
OPEC+ cuts and compliance
The oil market balances are also sensitive to another factor: OPEC+ compliance. Many are skeptical
about whether producers will abide by their quotas, especially for countries like Russia, Iraq and Nigeria
whose compliance to quotas were low even when the required cuts were smaller under previous
agreements. But at least for the next few months, compliance is expected to be reasonable for a number
of reasons. First, some producers are finding it increasingly difficult to market all their volumes in this
The contents of this paper are the authors’ sole responsibility. They do not necessarily represent the views
of the Oxford Institute for Energy Studies or any of its Members. 6current environment. Second, OPEC+ producers will consider very carefully the potential cost of non-
compliance and assess the risk of entering into another cycle of overproduction, especially at times
when Saudi Arabia has shown low tolerance for non-compliance and the willingness to shift policy
quickly if the burden of adjustment falls primarily on its shoulders. Also, if OPEC+ producers fail to abide
by their quotas, the market rebalancing will be delayed till the end of 2020. Indicatively, even in a
scenario in which total OPEC+ compliance averages 70 per cent (based on the average compliance in
2019, excluding Saudi Arabia), then not only will the expected surplus in 2020 be 2 mb/d higher than
our reference case on annual terms, but also annual Brent will fail to recover above the $30/b mark
(Figure 9).
Figure 9: Oil market outlook under low OPEC+ compliance case
Brent price Global balance
Note: Assumes 70% compliance to the OPEC+ deal.
Source: OIES.
Supply prospects outside OPEC+
The final factor determining the sensitivity of oil balances is the extent of supply reductions outside
OPEC+. Unlike the 2014-–2016 cycle, which came at the back of a sustained period of Brent prices
above $100/b, the scale of the current demand shock is much bigger, and the financial position of all
players is relatively weaker and therefore the supply contractions/production shut-ins will be deeper
and faster in this cycle. Also, the pipeline for new mega projects has almost dried up as most of the
projects approved in the $100/b price environment between 2010 and 2014 have come into production
in the last few years and these have not been fully replaced by new ones. The impact of the current
shock will be felt through different parts of the supply curve. For instance, while US shale has a shorter
investment cycle and lower capital intensity than conventional fields, limited access to finance means
that most US shale operators have to operate within cashflow. In an environment of low prices, cashflow
generated will not be sufficient to maintain high levels of activity which will impact supply growth. For
landlocked crudes such as those produced in Canada and Russia, limits to storage, pipeline
infrastructure constraints and low physical prices mean producers have no choice but to shut in
production.
On this basis, Figure 10 presents a scenario in which the reductions in US production are more
aggressive than expected (i.e. y/y US crude production contacts by 1.3 mb/d in 2020 and 1.5 mb/d in
2021, versus 1.1 mb/d and 0.8 mb/d, respectively, under our reference case), while the return of shut
in production from the US and elsewhere as oil prices recover in 2021 is slower and weaker than our
The contents of this paper are the authors’ sole responsibility. They do not necessarily represent the views
of the Oxford Institute for Energy Studies or any of its Members. 7reference case. This could further squeeze the market into deficit in 2021 by an additional 1 mb/d,
nearing 6 mb/d versus 5 mb/d in the reference, as well as sustain oil prices in the high-$50/b.
Figure 10: Oil market outlook under high impact on non-OPEC supply case
Brent price Global balance
Note: Assumes 100% compliance to the OPEC+ deal.
Source: OIES.
A key question is whether production lost during the downturn will be permanent. Some are of the view
that during this cycle, large volumes of production will be ‘destroyed’. But there is no evidence to support
this view and there is no reason to think that oil production will remain shut in regardless of the price
level. After all, for many of the players which have entered the US shale space, this is exactly the
flexibility shale provides them: shut in production when prices are low and increase activity when the
outlook improves. Therefore, if oil prices do eventually recover, production will come back but with lags.
The key uncertainties concern the price level at which activity will start recovering and the lags involved.
Opportunities for Saudi Arabia
The transformation of the supply curve as a result of the COVID-19 shock will present low cost
producers with the ability to increase production, particularly Saudi Arabia, with some opportunities that
were not available before the current demand shock. If the demand recovery proves to be stronger than
expected, Saudi Arabia may find itself in a position to increase production and capture market share by
substituting for production losses elsewhere (high output / low price). But this may require that prices
remain in a range of $40-50/b so as not to encourage rapid supply growth in other parts of the world
and to support the demand recovery. With higher production and more importantly higher exports, this
strategy may result in a similar payoff to a strategy of lower output and higher prices say in the $60-
70/b range (low output / high price). This is shown in Figure 11 that estimates Saudi Arabia’s gross oil
revenues under these two options, in a combined scenario in which a stronger-than-expected global oil
demand recovery is confronted by a low non-OPEC supply response (i.e. the high impact non-OPEC
supply scenario shown in Figure 10). But the higher output/lower price strategy has additional
advantages. First, this is consistent with an array of existing domestic policies aimed at improving
efficiency of energy consumption, energy pricing reforms, and increasing the share of gas and
renewables in the power sector which will reduce domestic demand and free crude for exports. Second,
by increasing production, the Kingdom can engage in a faster monetization strategy at times when there
The contents of this paper are the authors’ sole responsibility. They do not necessarily represent the views
of the Oxford Institute for Energy Studies or any of its Members. 8are concerns that the energy transition will result in lower long-term demand for oil. Third, given that oil
production still constitutes a significant part of GDP, higher production can support overall Saudi GDP
growth. Fourth, when the next cycle arrives, Saudi Arabia can negotiate cuts with other producers from
a much higher base. Finally, in our scenario, we assume that an oil price above the $40-50/b price
range would induce a recovery in supply outside OPEC+, particularly US shale. But if the supply
response turns out to be weaker than in previous cycles because investors require a higher price in
order to be attracted to US shale again, especially in the aftermath of the shock of negative prices, then
Saudi Arabia can increase both its exports and revenues.
Figure 11: Saudi Arabia gross oil revenues in high oil demand – low non-OPEC supply case
Source: OIES.
But oil markets rarely conform with such neat outcomes and if the current crisis has taught oil market
players and observers anything, it is that even if Saudi Arabia achieves such a sweet price/output range,
it would only be a matter of time before it gets disturbed again. After all, the history of oil markets is one
of a series of shocks. In dealing with these shocks, retaining flexibility in oil policy within a set of
economic and political constraints is key. The challenge is, and has always been, how to reduce some
of these constraints so as to maximise oil policy flexibility.
The contents of this paper are the authors’ sole responsibility. They do not necessarily represent the views
of the Oxford Institute for Energy Studies or any of its Members. 9You can also read