Island Bay to CBD Preliminary Funding Report - Wellington Cycleway Feasibility Study
←
→
Page content transcription
If your browser does not render page correctly, please read the page content below
Wellington Cycleway Feasibility Study

Island Bay to CBD

Preliminary Funding Report
Wellington Cycleway Feasibility Study- Island Bay to CBD                                                               i

Contents
Executive Summary ....................................................................................................1
1   Introduction....................................................................................................... 5
       1.1     Overview ................................................................................................................................ 5
       1.2     Study Scope............................................................................................................................ 5
2      Strategic Policy Context...................................................................................... 7
       2.1     National Policy & Plans......................................................................................................... 7
       2.2     Regional Policy ...................................................................................................................... 9
       2.3 Policy Conclusions................................................................................................................ 11
3      NZTA Assessment Framework ..........................................................................12
4      Cycleway Scheme Objectives .............................................................................14
5      Corridor Description ......................................................................................... 15
       5.1     Topography ........................................................................................................................... 15
       5.2     Land-use ...............................................................................................................................16
       5.3     Road Network .......................................................................................................................19
       5.4     Existing Commuter Cycle Trends....................................................................................... 25
       5.5     Crash History ....................................................................................................................... 27
6      Design Philosophy ............................................................................................ 32
       6.1 Commuter Cyclist User Priorities ...................................................................................... 33
       6.2     Wellington Specific Cyclist Route Choice Considerations................................................ 34
       6.3     Facility Types & Standards ................................................................................................. 36
7      Cycleway Routes & Treatments Considered ...................................................... 37
       7.1     Section 1 ............................................................................................................................... 37
       7.2     Section 2............................................................................................................................... 44
       7.3     Section 3 ............................................................................................................................... 53
       7.4     Preferred Cycleway Route & Treatments........................................................................... 62
8      Cost Estimates & Efficiency Forecasts .............................................................. 63
       8.1 Cost Estimates ..................................................................................................................... 63
       8.2     Economic Analysis .............................................................................................................. 65
9      NZTA Funding Assessment Profile ................................................................... 70
10     Summary and Conclusions ............................................................................... 72
       10.1 Summary .............................................................................................................................. 72
       10.2 Recommended Investment Strategy .................................................................................. 74
       10.3 Conclusion ........................................................................................................................... 75
       10.4 Recommendations............................................................................................................... 75
Appendix A................................................................................................................. A
Appendix B................................................................................................................. B
Appendix C ................................................................................................................. C
Appendix D ............................................................................................................... D

| May 2013                                                                                                      Opus International Consultants Ltd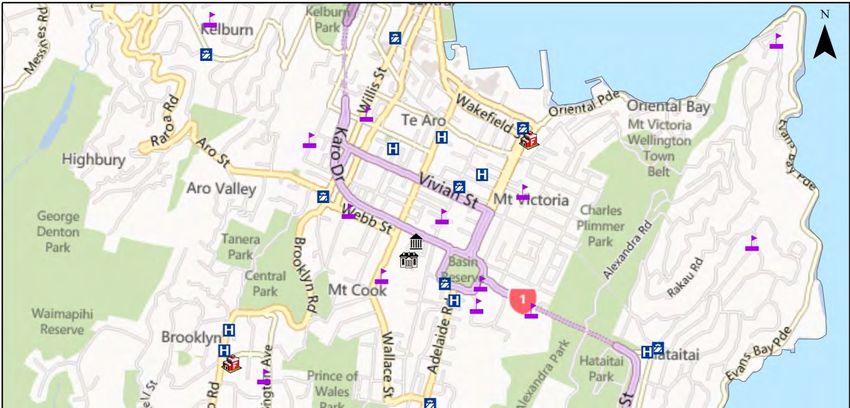
Wellington Cycleway Feasibility Study- Island Bay to CBD                                                     ii

Figure 1: Overview of Study Area Considered......................................................................................... 6
Figure 2: Short to Medium-Term Impacts (GPS July 2011, Page 7) ..................................................... 8
Figure 3: Congestion typically observed down Adelaide Road (Looking South towards Newtown) .14
Figure 4: Cross-Section of Study Corridor ............................................................................................. 15
Figure 5: Study Corridor Elevation ......................................................................................................... 15
Figure 6: Key land-use features of the study area ................................................................................. 17
Figure 7: Forecast Population Growth (Left) and Employment Growth (Right) ............................... 18
Figure 8: Basic Principal of a Road Hierarchy .......................................................................................19
Figure 9: Modified Version of “Hierarchy of Roads”, Map 33 WCC District Plan (Left) & the Study
Corridor AADT’s (Right) ........................................................................................................................ 20
Figure 10: Gradient of the WCC Road Network.....................................................................................21
Figure 11: Location & Characteristics of key roads in Section 1 of Study Corridor ............................ 22
Figure 12: Location of key Road links within Section 2 of Study Corridor ......................................... 23
Figure 13: Location of key Road links within Section 3 of Study Corridor ......................................... 24
Figure 14: WCC Cycle-Counts 2003-2012 at Adelaide Road / John Street Intersection .................. 26
Figure 15: Cycle Crash Location in Study Area ..................................................................................... 27
Figure 16: Time of day crashes have occurred ...................................................................................... 30
Figure 17: Examples of On-road Cycle Facility (left) & Shared Use Cycle Path (Right) .................... 36
Figure 18: Section 1 Routes – Option 1-A.............................................................................................. 39
Figure 19: Section 1 Routes – Option 1-B, 1-C & 1-D ............................................................................ 40
Figure 20: Elevated Plans of Route 1 Options .......................................................................................41
Figure 21: Section 2 Routes – Option 2-A ............................................................................................. 45
Figure 22: Section 2 Routes – Option 2-B ............................................................................................ 46
Figure 23: Section 2 Routes – Option 2-C ............................................................................................ 47
Figure 24: Section 2 Routes – Option 2-D & Option 2-E..................................................................... 48
Figure 25: Elevated Plans of Route 2 Options ...................................................................................... 49
Figure 26: Section 3 Routes – Option 3-A ............................................................................................ 55
Figure 27: Section 3 Routes – Option 3-B ............................................................................................. 56
Figure 28: Section 3 Routes – Option 3-C ............................................................................................ 57
Figure 29: Section 3 Routes – Option 3-D ............................................................................................ 58
Figure 30: Elevated Plans of Route 3 Options ...................................................................................... 59

 | May 2013                                                                                                 Opus International Consultants Ltd

Wellington Cycleway Feasibility Study- Island Bay to CBD                                                      iii

Table 1: RLTS Outcomes, Targets & Actions aligning with the Island Bay to CBD Cycleway ............. 9
Table 2: WCC Outcomes aligning with the Island Bay to CBD Cycleway ........................................... 10
Table 3: Funding Assessment Framework for New Walking & Cycling Projects ................................13
Table 4: Roads of Interest on Corridor Section 1.................................................................................. 22
Table 5: Roads of Interest on Corridor Section 2 ................................................................................. 23
Table 6: Roads of Interest on Corridor Section 2 ................................................................................. 25
Table 7: Two-hour peak totals recorded each survey period at Newtown Site (07:00-09:00) ......... 26
Table 8: Breakdown of Cycle Crashes by Study Area Section .............................................................. 28
Table 9: Study Area (All Sections) Cycle Crashes 2007-2012.............................................................. 29
Table 10: Wellington City (Urban) Comparison Cycle Crashes 2007-2012 ....................................... 29
Table 11: Road Users Involved in Cycle Crashes................................................................................... 29
Table 12: Intersection / Midblock Comparison .................................................................................... 30
Table 13: Crash Movement by Severity ..................................................................................................31
Table 14: Categories of cyclists and their characteristics (Adapted Austroads AP-G88-11 Page 9) .. 32
Table 15: Cyclists User Needs (Adopted “LTSA Cycle Network & Route Planning Guide Page 23”) 33
Table 16: Cycling Stages of Change (Adapted from LTNZ Research Report 294, Table 4.1&4.2) .... 34
Table 17: Cycle Facility Dimensions Adopted ....................................................................................... 36
Table 18: Summary of Estimates ........................................................................................................... 65
Table 19: Forecast Daily Trips on the cycleway .................................................................................... 66
Table 20: Cyclist Injury Totals on defined corridor (01/07/2007 – 01/07/2012)............................. 67
Table 21: BCR values for Central Corridor & Combination Option..................................................... 68
Table 22: First Year Rate of Return ....................................................................................................... 68
Table 23: Sensitivity Tests on Preferred Option BCR (note rounding) ............................................... 69
Table 24: NZTA Funding Criteria Assessment ..................................................................................... 70
Table 25: Priority of Activities................................................................................................................. 71
Table 26: Project Rating ......................................................................................................................... 75

 | May 2013                                                                                                  Opus International Consultants Ltd

Wellington Cycleway Feasibility Study- Island Bay to CBD                        iv

| May 2013                                                      Opus International Consultants Ltd
Wellington Cycleway Feasibility Study- Island Bay to CBD                                     1

Executive Summary
Opus International Consultants has been commissioned by Wellington City Council (WCC) to
complete a cycleway feasibility study for a corridor linking the Wellington suburb of Island Bay and
the Central Business District (CBD).
This report documents the development of a preferred cycleway facility. The feasibility of the
project is closely linked to its ability to attract government funding from the New Zealand
Transport Agency (NZTA). For such reasons the options have been assessed against NZTA’s
funding criteria. NZTA seek to support walking and cycling proposals that align with the
Government funding priorities set out in the Government Policy Statement (GPS). NZTA will
therefore prioritise funding towards cycling schemes that:
•   Provide an option for travelling to work in large urban congested cities;
•   Attract new commuter cyclists; and / or
•   Improve the safety of existing cyclists.
This study has demonstrated that the creation of a cycleway linking Island Bay and Wellington
CBD would have a “High” strategic fit with these objectives. In order to provide a facility that is
highly effective in achieving these objectives, options have been developed and assessed against
their ability to attract new and maintain existing commuter cyclists. New and existing cyclists have
varying priorities expected from a cycleway. In carrying out this study, research obtained by the
project team1 has identified that the best way to effectively cater for both cycle user groups within
the context of Wellington’s road network is to provide a facility that feels safe, is flat and direct.
Option Development
The study team broke down the corridor into three sections. The existing physical characteristics
and constraints for cycling in each section were identified. Given the constraints and the desires of
the two cycle user groups a series of alternative treatment and route options were then developed.
The options looked to address existing barriers to cycling as a commuter mode in the corridor.
Treatment options considered on the routes developed included traffic calming, on-road cycle
lanes, shared use paths and Copenhagen lanes2. Examples of on-road cycle lanes and shared-paths
are shown in Figure ES1. The routes considered in the three sections are shown in Figure ES2.

         Figure ES1: Examples of On-road Cycle Facility (left) & Shared Use Cycle Path (Right)3

1 J.Beetham,(2013), School of Geography, Environment and Earth Sciences Victoria University of Wellington.
2 Copenhagen lanes are segregated cycle lanes separated from vehicle and pedestrian traffic by raised kerbs.
3 Source: New Zealand Supplement to the Austroads guide to Traffic Engineering Practice Part 14: Bicycles, page iii.

| May 2013                                                                             Opus International Consultants Ltd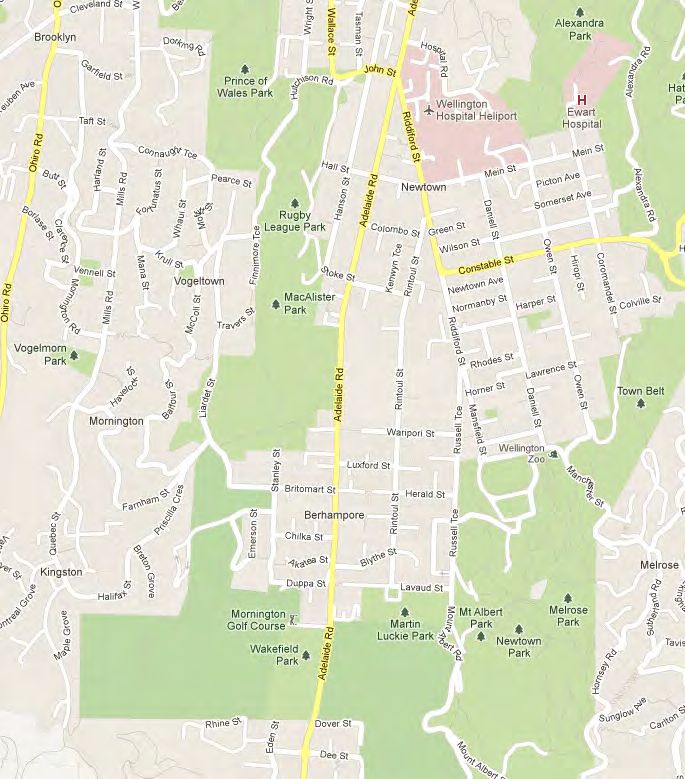
Wellington Cycleway Feasibility Study- Island Bay to CBD                           2

                                                                                                       Tory St
                                            Hanson St

                                           Adelaide Rd
                                                                                                                 Cambridge /
                                                                                                                 Kent Tce

                                                                                           Tasman St

                           The Parade

                                                                                                                  Adelaide Rd

              Reef St

                   Figure ES2: Routes considered on Section 1 (left), Section 2 (Centre) & Section 3 (Right)

| May 2013                                                        Opus International Consultants Ltd
Wellington Cycleway Feasibility Study- Island Bay to CBD 3
Option Assessment
Based on the flatness, directness and safety criteria specified, an assessment of the route and
treatment options proposed was completed. The project team concluded that the following
components as shown in Table ES1 should make up the preferred “Combination Option” as they
are able to achieve a “High” rating against NZTA’s effectiveness criteria. An on-road treatment was
recommended due to low costs and because it had the least effect on parking, property and
adjacent land-use activities.
Table ES1: Preferred “Combination Option” Summary
Name Section Description
Reef Street and The Parade up until Enhance and extend existing cycle lanes so
the Adelaide Road / Dee Street continuous facility provided in each direction
Roundabout through the full length of the section.
Option 1-A
Possibility of revisions to on-street parking
arrangements at Island Bay shops to maintain a
continuous cycle facility.
Provide on-road cycle lanes in each direction
Follows Adelaide Road from Dee requiring the loss of on-street parking.
Option 2-A
Street through to John Street. Improvements to intersections with safety features
such as advanced cycle stop boxes provided.
Uses Adelaide Road and Kent / Cater for cyclists in existing bus lanes in each
Option 3-A
Cambridge Terrace to reach the CBD direction.
Quiet-Street route for new / unconfident cyclists
provided by cycle directional signing, low-
Follows Stoke Street and Hanson intervention traffic calming (e.g. measures to visually
Option 2-D
Street. narrow the roads) and treatments to highlight the
presence of cyclists between Stoke Street and
Hanson Street;
Quiet-Street route for new / unconfident cyclists
continuation of Option 2-D measures on Tasman
Uses Tasman Street and Tory Street Street until Rugby Street. North of Rugby Street,
Option 3-C
to reach the CBD road space should be re-allocated to provide a
southbound cycle lane on the eastern side of Tory
and Tasman Streets.
Expected Cost for Preferred Option: $4.50 Million
An economic efficiency assessment was then completed. The number of current and anticipated
users was forecast. 439 existing cyclists on the route are projected. Following completion of the
cycleway 400 new users are forecast. By considering Health, Safety and Travel Time benefits the
economic efficiency of the proposal was determined to be 3.7. The option can be considered to have
a “Medium” Economic Efficiency Rating. Based on these results it is proposed that the scheme
receives the following NZTA funding assessment profile as shown in the Table ES2 below.
Table ES2: Activity Profile
Category Rating
Strategic Fit High
Effectiveness High
Efficiency Medium
Rating HHM Category 2
| May 2013 Opus International Consultants LtdWellington Cycleway Feasibility Study- Island Bay to CBD 4 Conclusions This study has developed an improvement scheme that will cater to the needs of both new and existing cyclists. The cycling corridor has a high strategic fit with the Government’s policy objectives. The study has investigated a wide range of alternatives and recommended a scheme that will achieve the policy outcomes effectively attaining value for money. With the efficiency of the scheme confirmed as being able to generate a BCR of 3.7 a funding profile rating of 2 should be assigned. Given these findings it is recommended that the project is continued to the next stage of development where the following activities should occur: • Develop detailed designs and identify the preferred “Combination Option”; • Consultation with affected stakeholders; and • Refinement of the cost estimates. | May 2013 Opus International Consultants Ltd
Wellington Cycleway Feasibility Study- Island Bay to CBD                         5

1       Introduction
1.1     Overview
        Opus International Consultants (Opus) has been commissioned by Wellington City Council
        (WCC) to complete a cycleway feasibility study for a corridor linking the Wellington suburb
        of Island Bay and the Central Business District (CBD).

        This report documents the development of a preferred route and cycleway facility (the
        scheme). The feasibility of the scheme is closely linked to its ability to attract government
        funding from the New Zealand Transport Agency (NZTA). For such reasons the scheme has
        been assessed against NZTA’s funding criteria. This approach will allow WCC to prioritise
        the implementation of different cycleway projects and have sufficient information to
        prepare a funding application.

1.2     Study Scope
        The scope of this study is to develop and determine whether the scheme is feasible on the
        6.1km section between Island Bay and the CBD as defined in Figure 1 (overleaf). The
        scheme will allow for improved cycle travel either through or around some of the most
        congested parts of Wellington City. The study area is a highly utilised commuter corridor. It
        connects Wellington’s southern suburbs to the CBD, passing through or nearby a number of
        local shopping precincts and key institutions such as Wellington Hospital and Massey
        University. A high demand for travel is exhibited through the study area. To ensure that the
        best cycle route and facility possible can be provided, the study scope of works has included:

        •    Determining the alignment of the study with national, regional and local policy;
        •    A review of NZTA’s “Assessment Framework” to define the essential funding
             requirements the study must comply with;
         •   Setting the cycleway scheme objectives given the policy and funding needs;
         •   Assessment of the study area characteristics;
         •   Development of various routes, treatment options & their assessment;
         •   Forecasting new users attracted to the scheme; and
         •   Assessment of the scheme against NZTA’s funding “Assessment Framework”.

        The study has been completed on the assumption that both the Memorial Park Underpass
        situated at Buckle Street and the Basin Reserve Overbridge will be constructed in the near
        future. Development of the Adelaide Road growth node between the Basin Reserve and
        John Street is not yet confirmed but has been considered as part of the study.

| May 2013                                                                 Opus International Consultants Ltd
Wellington Cycleway Feasibility Study- Island Bay to CBD 6
Study Area
Figure 1: Overview of Study Area Considered
| May 2013 Opus International Consultants LtdWellington Cycleway Feasibility Study- Island Bay to CBD 7
2 Strategic Policy Context
2.1 National Policy & Plans
The Land Transport Management Act 2003 (the Act) is the main statute for New Zealand’s
land transport planning and funding system. The purpose of the Act is to contribute to
achieving an affordable, integrated, safe, responsive and sustainable land transport system.
The Act requires that a Government Policy Statement (GPS) be issued by the Minister of
Transport every three years. This enables the Minister to guide NZTA and the land
transport sector on the outcomes, objectives, and the short to medium-term impacts that
the crown wishes to achieve. Longer term government objectives are addressed in the New
Zealand Transport Strategy 2008 (NZTS). While not a statutory document, the NZTS sets
out a series of aspirational targets for land transport in 2040. As the NZTS was developed
by the previous government and prior to the global financial crisis, the GPS is currently the
primary document for land transport decision makers. However, the Act requires NZTA to
at a minimum assess all projects against the GPS and the five NZTS objectives:
• Assisting economic development;
• Assisting safety and personal security;
• Improving access and mobility;
• Protect and promote public health; and
• Ensure environmental sustainability
Providing a project that aligns well with the above objectives and those listed by the current
GPS is a fundamental requirement of any funding application. Alignment of the Island Bay
to CBD cycleway against these national policy documents is described in the remainder of
Chapter 2.1.
2.1.1 Land Transport Management Act Objectives
• Assisting economic development
A new cycleway between Island Bay and the CBD has the potential to make the CBD and
the employment opportunities located within it more accessible for both the financially
disadvantaged and those without private vehicles.
• Assist safety and personal security
A new cycleway has the potential to enhance cycle safety along the 6.1 km study
corridor. On-road facilities typically see a reduction of between 10-20% in the number
of cycle related injury crashes4. If completely separated facilities are provided the cycle
safety benefits that can be captured will be even higher.
• Improve access and mobility
The cycleway will not enhance access and mobility for freight. However, it could
improve access to schools and educational establishments such as Massey University.
4 NZTA’ Economic Evaluation Manual Chapter A6
| May 2013 Opus International Consultants LtdWellington Cycleway Feasibility Study- Island Bay to CBD 8
• Protect and promote public health
The cycleway has the potential to protect and promote public health by providing a
facility which will encourage active mode travel. Cycling has a number of health benefits
generated by the undertaking of physical activity. These benefits would be realised by
the new cyclists attracted to the facility.
• Ensure environmental sustainability
The installation of a cycleway has the ability to encourage people to cycle rather than
travel by vehicle. A reduction in vehicle trips will improve congestion and energy
efficiencies from stop/start movements characteristic of the study corridor during peak
travel times. Through reductions in fuel consumption travel through the corridor may
become more sustainable.
2.1.2 Government Policy Statement (GPS)
The Government Policy Statement on Land Transport Funding 2012/13 – 2021/22 (July
2011) presents the Government’s desired outcomes and funding priorities for the
National Land Transport Fund (NLTF). At present economic growth and productivity is
a key priority for the Government. For this reason the GPS lists three areas of focus:
• Economic growth and productivity;
• Value for money; and
• Road safety.
In achieving these focus areas the impacts listed in Figure 2 should be met through the
allocation of funding from the NLTF. In accordance with the reasons detailed in Chapter
2.1.1, allocating funding for the cycleway will address the majority of the short to
medium term impacts the Government wishes to achieve from its funding priorities.
Figure 2: Short to Medium-Term Impacts (GPS July 2011, Page 7)
| May 2013 Opus International Consultants LtdWellington Cycleway Feasibility Study- Island Bay to CBD 9
2.1.3 Safer Journeys – New Zealand’s Road Safety Strategy 2010-2020
“Safer Journeys” is the National strategy to guide improvements in road safety over the
period 2010-2020. It contains the long-term goal for road safety in New Zealand of
achieving “A safe road system increasingly free of death and serious injury”. One
priority area of road safety is for “safe walking and cycling” journeys. The Island Bay to
CBD cycleway can align with the Strategy by:
“Providing safe and convenient routes for pedestrians and cyclists, especially to and
from work and school” (Safer Journeys, Page 39).
2.2 Regional Policy
2.2.1 Wellington Regional Land Transport Strategy (September 2010)
The Wellington Regional Land Transport Strategy 2010 (RLTS) guides the development
of the regions transport system (including public transport, roads, walking, cycling and
freight) for the next ten years and beyond. It provides an overall context for investment.
The RLTS identifies a number of key outcomes which the region seeks to achieve. A
series of targets and actions have subsequently been developed for all the RLTS
outcomes. Those outcomes and key actions relevant to the study are shown in Table 1.
Table 1: RLTS Outcomes, Targets & Actions aligning with the Island Bay to CBD Cycleway
RLTS Outcome 2020 Strategic Target Key Actions
(2.1) Increased mode share • Increase active mode use to at • Improve walking and cycling
for pedestrians & cyclists least 30% of all trips in urban facilities;
areas;
• Advocate for higher priority
• Active modes account for at least of pedestrian and cyclist road
16% of region wide journey to safety funding.
work trips.
(2.2) Improved level of • 70% of people report a “good” or • Provide quality footpaths and
service for pedestrians and “neither good nor bad” level of cyclist facilities
cyclists service for the strategic cycle
network
(2.3) Increased safety for • A reduction in the number of • Improve cycling networks
pedestrians & cyclists cyclist casualties to no more than
110 per annum. • Advocate for adequate
government funding.
(3.1-3) Reduced • Transport generated CO2 • Improve & promote mode
greenhouse gas emissions; emissions will be maintained shift to public transport,
private car mode share & below year 2001 levels. walking and cycling.
fuel consumption
(4.1) Reduced severe road • Average congestion on selected • Advocate for mode shift.
congestion roads well remain below 2003
levels despite traffic growth.
(5.1) Improved regional • There are no crashes attributable • Improve walking and cycling
road safety to roading network deficiencies; safety.
Continuous reduction in the
number of killed and seriously
injured on the regions roads.
| May 2013 Opus International Consultants LtdWellington Cycleway Feasibility Study- Island Bay to CBD 10
2.2.2 Wellington Regional Cycling Plan (December 2008)
The Regional Cycling Plan (2008) responds to the issues and policy framework set out
in the RLTS. It sets out an action programme with a series of high level initiatives
developed to contribute towards the RLTS outcomes, targets and actions detailed in
Section 2.2.1. This includes reviewing, addressing any identified deficiencies and
expanding the cycle network in accordance recognised best practice guidelines by
considering:
• Road space allocation;
• Surface quality and maintenance;
• Route directness and connectivity;
• Signage and information;
• Vehicle traffic speeds and parking restrictions;
• Crash and risk statistics;
• Cycle parking and storage facilities;
• Cycle priority measures;
• Segregated cycle facilities on high speed/high volume routes; and
• Integration with public transport systems.
The Island Bay to CBD cycleway can align with the Regional Cycling Plan by considering
the above issues in its design and development. This will assist in the cycleway achieving
the recognised RLTS outcomes.
2.2.3 WCC Transport Strategy 2006
The WCC Transport Strategy provides the ten year direction and strategic vision for
transport activities in Wellington City. Table 2 lists long term outcomes relevant to the
Island Bay to CBD cycleway project. The Cycleway project could positively contribute
towards the realisation of these key outcomes by providing a facility that will encourage
mode shift away from private vehicle use.
Table 2: WCC Outcomes aligning with the Island Bay to CBD Cycleway
WCC Outcome Outcome Alignment with Cycleway Project
2.3 More Sustainable: Wellington will minimise • Increasing the use of low-energy transport
the environmental effects of transport and support options
the environmental strategy;
2.4(a) Better connected: Wellington will have a • A well connected system of local roads and
highly interconnected public transport, road and streets, footpaths and cycleways.
street system that supports its urban development
and social strategies;
2.4(b) Healthier: Wellingtons Transport system • Promoting walking and cycling and reduced
will contribute to healthy communities and social dependence on motor vehicles for short trips
interaction through the travel demand management
programme.
| May 2013 Opus International Consultants LtdWellington Cycleway Feasibility Study- Island Bay to CBD 11
2.2.4 WCC Cycling Policy 2008
The “WCC Cycling Policy 2008” is a component of the overall transport plan set out in
the “Transport Strategy 2006”. The Cycling Policy “creates a framework for the
development of infrastructure and measures to improve the safety and convenience of
cycling and cycling facilities”. The Policy is built on six specified objectives:
• To improve cycle safety throughout Wellington;
• To improve the convenience of cycling in Wellington;
• To improve the experience of cycle trips to and from the Central Area;
• To improve the experience of cycle trips to and from Suburban Centres;
• To improve the experience of cycle trips to and from educational centres; and
• To improve the experience of cycle trips for recreation.
The proposed Island Bay to CBD cycleway is well aligned with these objectives and the
overarching Transport Strategy it supplements.
2.2.5 WCC Adelaide Road Framework 2008
The cycleway also helps achieve the vision outlined in the “Adelaide Road Framework
2008”. Having a designated facility for cyclists within the vicinity of Adelaide Road will:
• Make Adelaide Road safer for cyclists and more cycle friendly;
• Better connected for people to access areas of work and living; and
• Result in reduced mode conflicts.
2.3 Policy Conclusions
The concept of the Island Bay to CBD cycleway project has been assessed against national,
regional and local strategic policy. Clearly the project demonstrates the potential to
correlate strongly with the desires and aspirations of all levels of governance. A number of
common themes have been identified across these policies, highlighting the need for the
cycleway to:
• Ease congestion between Island bay and the CBD which will help to reduce vehicle
emissions;
• Reduce death and serious injury through the provision of new or improved cycle
facilities;
• Make it easier for residents along the study corridor to access employment
opportunities and retail areas, particularly people that may be unable to afford to travel
by car or by bus.
• Make better use of existing transport capacity available on the city road network;
• Remove barriers to cycling that will increase the amount of choice in ways to travel and
propensity for change. This may be through the removal of perceived discomfort or
danger;
• Reduce reliance on one form of transport to improve the resilience of the wider
transport network; and
• Encourage more regular cycling to improve public health.
| May 2013 Opus International Consultants LtdWellington Cycleway Feasibility Study- Island Bay to CBD 12
3 NZTA Assessment Framework
Under the Act, NZTA is responsible for allocating funds from the NLTF for investment
activities set by the Government. Territorial Authorities such as WCC can gain funding from
the NLTF if they successfully demonstrate to NZTA that a project can achieve value for
money. Value for money is generally defined as a means of selecting the right things to do
(Strategic Fit), implementing them in the right way (Effectiveness), at the right time and for
the right price (Economic Efficiency)5.
To demonstrate value for money a project must be assessed against NZTA’s funding
Assessment Framework. The Assessment Framework uses a ranking system of “High”,
“Medium” or “Low” against the Strategic Fit, Effectiveness and Economic Efficiency criteria
which are defined as follows:
• Strategic Fit
A strategic fit assessment considers how an identified problem, issue or opportunity
aligns with the NZTA’s strategic investment direction without considering the possible
solution. The investment direction is derived from the GPS. Strategic fit assessments
and the criteria within them are specific to “activity classes”. Walking and cycling is
considered to be a single “activity class”. This ensures uniformity in the comparison
between different walking and cycling projects. It should be noted that for walking and
cycling projects, a “High” Strategic Fit can be gained if the project aligns with one or
more of the defined “High” rating targets.
• Effectiveness
The effectiveness assessment considers the contribution that a project makes to achieve
the potential identified in the strategic fit assessment. Higher ratings are given to
projects providing long-term, integrated and enduring benefits.
• Economic Efficiency
The economic efficiency assessment considers how well the proposed solution
maximises the value of what is produced from the resources used. The Benefit Cost
Ratio (BCR) is the primary mechanism used to rate the economic efficiency of a project.
Table 3 overleaf provides a summary of the Assessment Framework for a walking and
cycling project. Therefore in order to successfully demonstrate that the Island Bay to CBD
Cycleway provides value for money, the study must:
• Achieve a “High” Strategic Fit rating by either significantly reducing actual crash risk, be
part of a model walking / cycling community, or by reducing congestion on a key route
in a major urban area;
• Achieve a “High” Effectiveness rating by at a minimum showing that the project can be
significantly effective at achieving the Strategic Fit.
• Achieve a “High” efficiency rating by having four times as many transport benefits as
there are costs.
5 http://www.pikb.co.nz/assessment-framework/assessment-framework-overview/
| May 2013 Opus International Consultants LtdWellington Cycleway Feasibility Study- Island Bay to CBD 13
Table 3: Funding Assessment Framework for New Walking & Cycling Projects
Low Rating Medium Rating High Rating
Strategic Fit
• Reduce actual crash risk Reduction in predicted crash Reduction in actual crash
risk involving deaths and risk (5 fatal/serious over
serious injuries - comply last 5 year) – Comply with
with Safer Journeys strategy Safer Journeys strategy
• Increase cycle participation Be Part of a Model
Improve uptake of cycling
Walking/Cycling
Default and walking in main urban
Community to make it
areas
easier and safer.
• Reduce congestion Complete/ complement On a key route in Major
existing walking an cycling urban area on agreed
network for easing walking and cycling
congestion strategy strategic network
Effectiveness
• Impact from strategic fit Has an impact and
assessment proportional to scale Significantly effective Significantly effective
of project
• Reach agreed LOS (NLTP) Satisfied
• Consider all problems, issues
Considered
and opportunities
• Consider all alternatives Considered
• Consider Opportunities to Collaboration of the
collaborate Considered development of studies,
strategies and plans
• Consider adverse effects Considered
• Affordable Satisfied
• Avoid job duplication Satisfied
• Include monitoring and review
Satisfied
framework
• NZTA supported strategy,
endorsed package, programme Part of or will contribute to Key component
or plan
• Long term solution Provide enduring benefits
• Solution to land use strategy
Satisfied
and implementation plans
• Contribute to multiple GPS Strategic approach to
impacts Contributes make significant
contribution
• A whole network approach Satisfied
• Improve integration between
Satisfied
modes
• Integrates land transport, use Satisfied through strategic
and activity approach
• Supports network from a
Satisfied
national perspective
• Optimised against multiple
transportation outcomes and Satisfied
objectives
Efficiency
• BCR 1.0-2.0 2.0-4.0 4.0+
| May 2013 Opus International Consultants LtdWellington Cycleway Feasibility Study- Island Bay to CBD 14
4 Cycleway Scheme Objectives
The study corridor is one of Wellington’s key urban routes connecting the southern suburbs
with employment opportunities in the CBD. The daily demand for travel along the corridor
is highest during the morning and evening peak hours as shown in Figure 3. At these times
people commute to and from work respectively, contributing towards congestion on the
road network. Providing a cycleway facility that encourages commuter mode shift will assist
in the reduction of this congestion. Adopting commuter cyclists as the primary user group
increases the potential to realise a number of important benefits aligning with current
strategic policy including:
• Reduction of congestion and its environmental effects during peak travel periods;
• Enhanced cycle safety;
• Building on Wellington’s existing cycle network; and
• Providing increased health benefits for new users.
The cycleway scheme objectives are therefore:
• To reduce congestion through the study corridor by encouraging commuter mode shift
from private vehicles to cycling;
• To significantly improve cycle safety and reduce the number of fatal and serious injury
crashes in the study corridor; and
• To provide a facility that meets the “High” ratings under NZTA’s Assessment
Framework making the project more likely to attract further funding.
Figure 3: Congestion typically observed down Adelaide Road (Looking South towards Newtown)
| May 2013 Opus International Consultants LtdWellington Cycleway Feasibility Study- Island Bay to CBD 15
5 Corridor Description
The study area corridor extends 6.1km between The Esplanade, Island Bay and Wellington
Waterfront in the CBD. The corridor has a number of physical and geographical
characteristics with implications for the choice of a cycleway route. For simplicity the
corridor has been broken down into the following three sections as shown in Figure 6:
• Section 1 – The Esplanade to Dee Street / The Parade Roundabout
• Section 2 – Dee Street / The Parade Roundabout through to John Street
• Section 3 – John Street through to Wellington Harbour
The remainder of this Chapter provides context to the corridor sections and describes the
opportunities and challenges a cycleway may present.
5.1 Topography
The study area corridor is situated at the bottom of a steep valley between the Brooklyn Rise
(West) and Mount Victoria (East). A typical cross section of the valley is shown in Figure 4.
The cross-section was taken where Adelaide Road and The Parade intersect at Dee Street.
Brooklyn Rise Mt Victoria
W E
Figure 4: Cross-Section of Study Corridor
While the study corridor is situated in a valley, the topography and grade of the route is not
constant. An elevated plan of Adelaide Road from Island Bay through to the Basin Reserve
is shown in Figure 5. The route requires a number of climbs to travel from the shoreline in
either direction of travel (at 5m above sea level) to a maximum elevation, 65m above sea
level at MacAlister Park.
S N
Figure 5: Study Corridor Elevation
| May 2013 Opus International Consultants LtdWellington Cycleway Feasibility Study- Island Bay to CBD 16
5.2 Land-use
Development within the corridor broadly follows the valley floor described in Chapter 5.1.
Following the valley floor, Adelaide Road is the main arterial road linking Island Bay and
the CBD. From Island Bay through to Newtown, Adelaide Road traverses an area of low
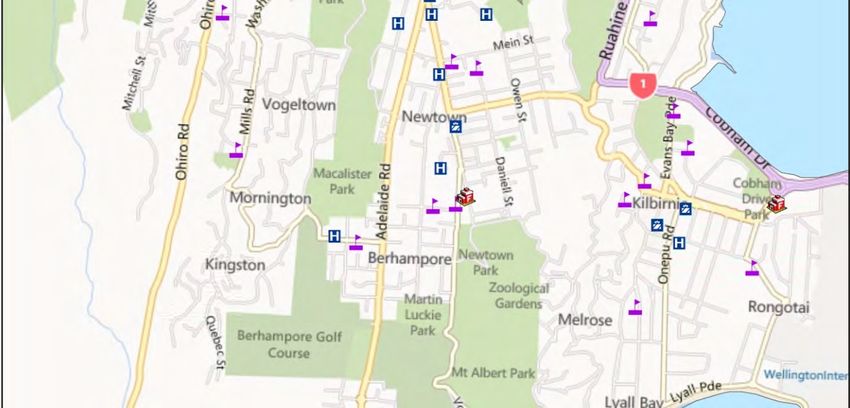
density residential housing. As shown in Figure 6 clusters of retail shopping areas are also
located at Island Bay, Berhampore and Newtown. North from Newtown towards the
Adelaide Road growth node and the CBD development in the corridor is increasingly
commercial with higher density apartment dwellings. Additionally the cycleway would be
situated within close proximity to Wellington Hospital, many schools and Massey
University. The cycleway would therefore provide an important connection for active mode
travel between the southern residential suburbs, employment opportunities to the north,
educational facilities and health services.
Although existing land-use activities provide an important snap-shot of how a cycleway
could benefit the community at the present time, considering the future is essential to
determine if the cycleway will support future growth initiatives and aspirations.
The Wellington Transport Strategy Model (WTSM) operated by the Greater Wellington
Regional Council (GWRC) enables future transport demands to be forecast. The forecasts
are based on data from Statistics New Zealand and demographic trends from previous
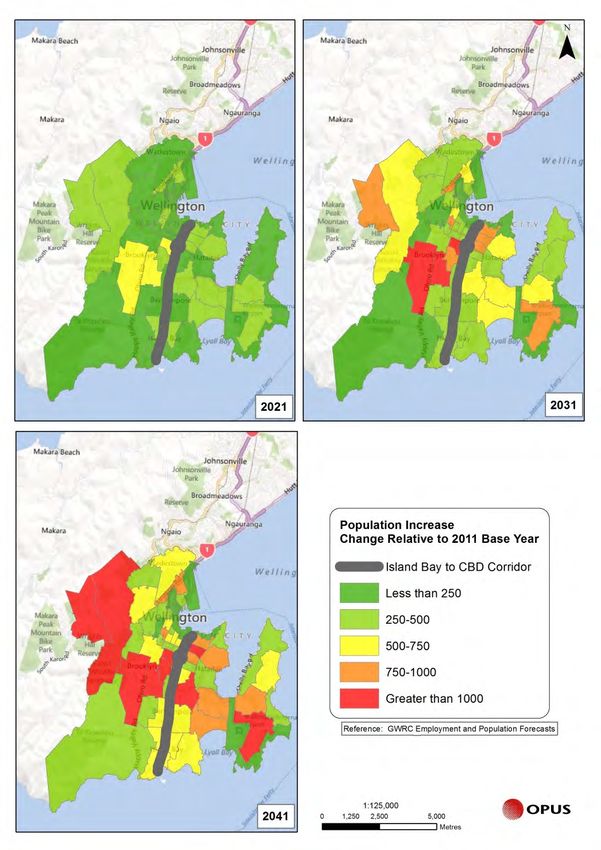
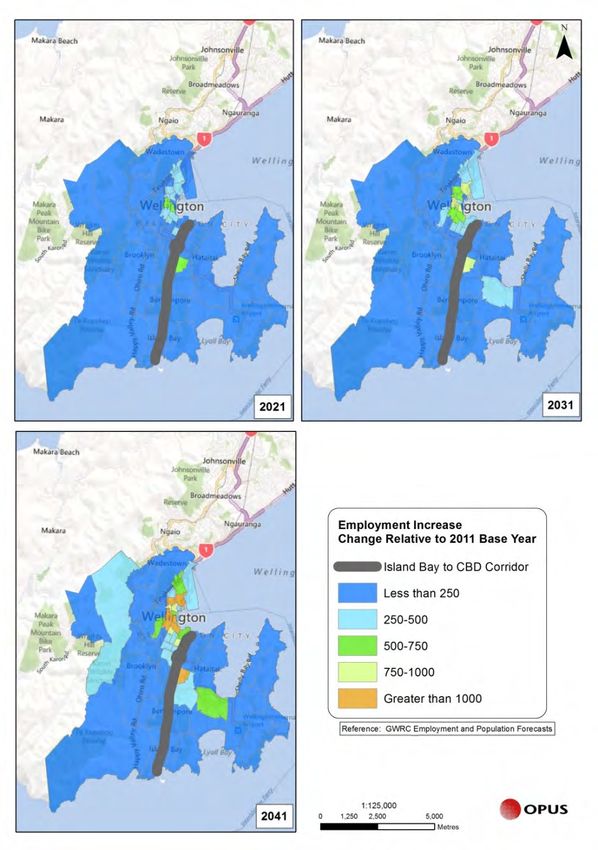
Census’. Figure 7 shows the forecast changes to population and employment that are used
as the basis for WTSM travel demand forecasts. These are utilised for all the transport
projects in the region including the components of the Road of National Significance.
It can clearly be seen that the population is forecast to increase along the corridor and that
the growth will be most intense around Newtown and in the CBD. Employment growth is
also concentrated around Newtown and the CBD with a pocket of high growth at the
“Adelaide Road growth node”. With an increase in employment opportunities in these
areas the demand for travel in the corridor will also increase. The cycleway will therefore
play an important role in servicing active mode travel in the north-south direction.
Based on the current land-use activities and the projected WTSM outputs it can be
concluded that the cycleway will increase connectivity for existing cycle demand. The
cycleway is also in a location capable of servicing future year requirements as population
and employment growth changes are influenced by future land-use patterns.
| May 2013 Opus International Consultants LtdWellington Cycleway Feasibility Study- Island Bay to CBD 17
Central Business District
Adelaide Road Growth Node
Section 3
Section 2
Newtown Shops
Wellington Hospital
Berhampore Shops
Section 2
Section 1
Island Bay Shops
Figure 6: Key land-use features of the study area
| May 2013 Opus International Consultants LtdWellington Cycleway Feasibility Study- Island Bay to CBD 18
Figure 7: Forecast Population Growth (Left) and Employment Growth (Right)
| May 2013 Opus International Consultants LtdWellington Cycleway Feasibility Study- Island Bay to CBD 19
5.3 Road Network
The road network through the study corridor contains a mixture of arterial, principal,
collector and local roads. Key arterial and principal roads are typically straight, very wide,
low in gradient and appropriate for high volume traffic flows. The roads generally have good
forward visibility and controlled intersections along them. Conversely the quieter, local
roads are windy, narrow, low volume and have poor visibility. The local roads do however
provide a greater access to property. The general principle for a roading hierarchy and their
effect on access and mobility is shown in Figure 8.
Figure 8: Basic Principal of a Road Hierarchy6
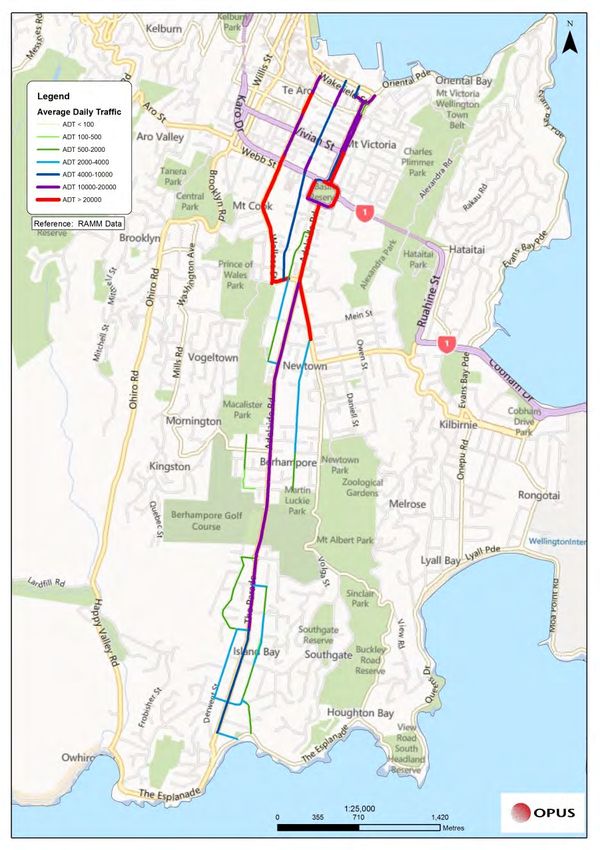
The road network hierarchy for Wellington City in the study corridor and a summary of the
Average Annual Daily Traffic (AADT) traffic volumes sourced from NZTA’s Crash Analysis
System (CAS) is shown in Figure 9. There is strong correlation between the roading
hierarchy and the traffic volumes observed. Heavy traffic volumes of over 20,000 vehicles
per day are seen at the northern end of the corridor on the designated SH1 and arterial
roads. However, Taranaki Street and Adelaide Road (south of the Basin Reserve) carry
similar levels of traffic despite being only collector and principal roads respectively. Historic
development of Wellington’s road network and the significant growth that has occurred
around it has limited the potential for transport capacity changes. Therefore the desirable
road layout cannot always be provided to cater for the high traffic volumes. Unsurprisingly
congestion is a feature through the corridor south of the Basin Reserve.
6 Image from Austroads Guide to Traffic Management Part 5: Road Management; Page 5.
| May 2013 Opus International Consultants LtdWellington Cycleway Feasibility Study- Island Bay to CBD 20
Basin Reserve Basin Reserve
Taranaki St
Taranaki St
Adelaide Rd
Adelaide Rd
The Parade
The Parade
Figure 9: Modified Version of “Hierarchy of Roads”, Map 33 WCC District Plan (Left) & the Study Corridor AADT’s (Right)
| May 2013 Opus International Consultants LtdWellington Cycleway Feasibility Study- Island Bay to CBD 21
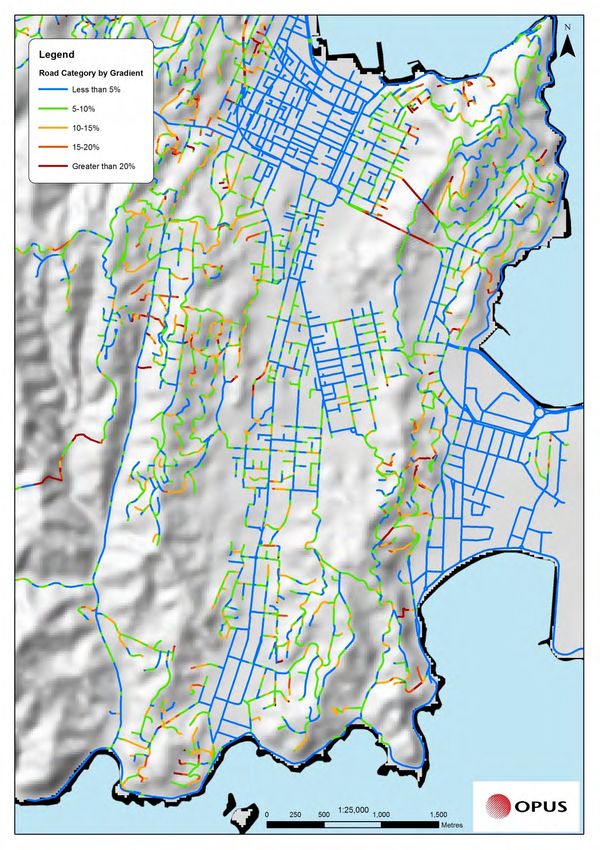
In addition to traffic volumes, the gradient of the roads through the study corridor is also an
important consideration for the cycleway. The respective gradients per 50m road section
can be seen in Figure 10. The road gradient has been calculated using LIDAR using a geo-
spatial system. Generally it can be seen through the corridor that the arterial roads for the
most maintain a low gradient while local roads can be at between 5-15%. The remaining
contents of Chapter 5.3 specify the characteristics of the study corridor sections in detail.
Figure 10: Gradient of the WCC Road Network
| May 2013 Opus International Consultants LtdWellington Cycleway Feasibility Study- Island Bay to CBD 22
5.3.1 Section 1
The Parade is the main link into and out of Island Bay. Defined as a principal road in the
WCC District Plan, The Parade has an AADT of over 10,000 vehicles per day north of
Medway Street. The road is wide and relatively flat until the Dee Street roundabout
where it becomes Adelaide Road. Surrounding The Parade is a series of parallel
residential streets including Derwent Street, Medway Street, Eden Street (West of The
Parade) and Clyde Street (East of The Parade). With AADT’s under 3,000 vehicles per
day the parallel routes cater for low volume residential traffic. A summary of the road
characteristics for these roads and their location is shown in Table 4 and Figure 11
respectively. Note that the road widths are from kerb to kerb (from RAMM) and have
not been surveyed as part of this study.
Table 4: Roads of Interest on Corridor Section 1
Typical On-Street Max
Road Hierarchy AADT* Lanes
Road Width parking Gradient
Reef Street Local Road 2,182 16m 2 YesWellington Cycleway Feasibility Study- Island Bay to CBD 23
5.3.2 Section 2
From the Dee Street roundabout, Adelaide Road traverses the entirety of Section 2 from
Island Bay through to the Adelaide Road / John Street / Riddiford Street intersection.
Running parallel to Adelaide Road are local roads including Stanley Street, and Hanson
Street to the west. To the east of Adelaide Road are Rintoul Street and the Principal road
Riddiford Street. Riddiford Street passes Wellington Hospital and is the primary
corridor from the CBD to Newtown. Characteristics of these roads and their location are
shown in Table 5 and Figure 12 respectively. Roads are again taken from kerb to kerb.
Table 5: Roads of Interest on Corridor Section 2
Typical On-street Max
Road Hierarchy AADT Lanes
Road width parking Gradient
Adelaide Road Principal 11,576 8.5-10m 2 In Places 10-15%
Stanley Street Local Road 1,027 7.5-9.5m 1-2 Yes 10-15%
Stoke Street Local Road 1,127 8.5-10m 2 YesWellington Cycleway Feasibility Study- Island Bay to CBD 24
5.3.3 Section 3
In Section 3 there are a number of high volume links connecting the main Adelaide
Road Corridor to the south and the CBD to the north. As shown in Figure 13 Adelaide
Road continues from the John Street signalised intersection before it reaches SH1 at the
southern side of the Basin Reserve (Rugby Street). Following the Basin Reserve, the key
arterials Kent and Cambridge Terrace provide access to and from the coast respectively.
Cambridge Terrace has three lanes of vehicle capacity in the northbound direction to
cater for over 10,000 vehicles per day. Kent Terrace provides three lanes of southbound
capacity and is designated as SH1 (south of the Vivian Street intersection). Kent Terrace
typically sees over 20,000 vehicles daily. Adelaide Road, Kent and Cambridge Terrace
are situated on a relatively flat grade. Roads are again taken from kerb to kerb.
Section 3
Section 2
Figure 13: Location of key Road links within Section 3 of Study Corridor
| May 2013 Opus International Consultants LtdWellington Cycleway Feasibility Study- Island Bay to CBD 25
Defined as a Collector Road, Taranaki Street / Wallace Street to the West of the
Adelaide Road corridor sees in excess of 20,000 vehicles per day. Taranaki Street is one
of the primary vehicle corridors into the CBD. It has multiple lanes of capacity in each
direction to the north of SH1. South of SH1 there is one lane in each direction as it
passes Wellington High School and Massey University. Some grades up to 10% can be
experienced before it ties into John Street.
In addition to these high capacity and heavily utilised links, the local road Tasman /
Tory Street provides a two-way, single lane in each direction between John Street, SH1
and the waterfront. Tasman Street begins at John Street and terminates at SH1. Tory
Street begins at SH1 and proceeds through the CBD to the waterfront. Tasman Street
covers a residential area and allows access to Massey University. Situated on a hill, it
has one short section with a steep grade up to 10% near John Street. Tory Street is one
of the central corridors through the CBD. However, as it has only one lane of capacity in
each direction, traffic is instead attracted to the high capacity routes of Taranaki Street
or Cambridge / Kent Terrace. There is a high proportion of foot traffic using Tory Street.
The key characteristics for each of the roads described are shown in Table 6.
Table 6: Roads of Interest on Corridor Section 2
Typical On-street Max
Road Hierarchy AADT Lanes
Road width parking Gradient
Adelaide Road Principal 22,905 15.5m 2-4** In PlacesWellington Cycleway Feasibility Study- Island Bay to CBD 26
Table 7: Two-hour peak totals recorded each survey period at Newtown Site (07:00-09:00)
Weekday
Year Monday Tuesday Wednesday Thursday Friday
Average
2003 130 136 179 131 131 141
2004 160 155 101 138 132 137
2005 157 184 175 123 101 148
2006 200 206 208 197 169 196
2007 267 278 284 269 283 276
2008 231 252 254 217 239 239
2009 247 312 274 295 220 270
2010 321 352 334 322 206 307
2011 243 286 283 296 249 271
2012 150 285 299 310 223 253
Figure 14: WCC Cycle-Counts 2003-2012 at Adelaide Road / John Street Intersection
The annual growth calculated is significantly higher than the 0% stated for the
Wellington Region in NZTA’s Economics Evaluation Manual (EEM Volume 2, page 8-
21). Therefore it can be said that there is an increasing demand for cycle activity in the
study corridor. The cycleway project will contribute as a means of providing a
designated facility to meet this and additional demand both now and in the future.
| May 2013 Opus International Consultants LtdWellington Cycleway Feasibility Study- Island Bay to CBD 27
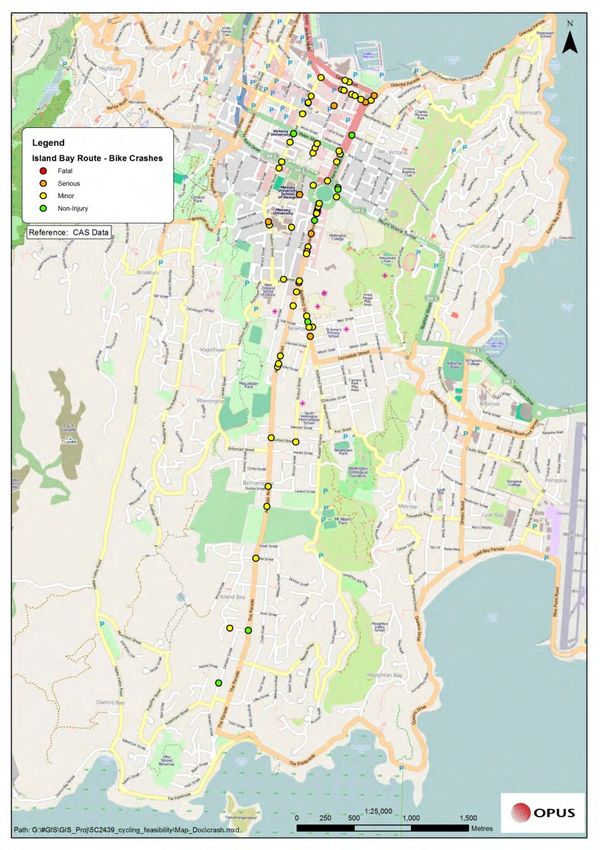
5.5 Crash History
A high level crash analysis was completed for the study corridor using data sourced from
NZTA’s CAS. A five year analysis period between the 1st of July 2007 and 30th of June 2012
has been adopted. The analysis period uses the most up-to date data set currently available
allowing current crash trends and issues to be identified. Most crash benefits associated
with the cycleway project will come from improvements to cycle safety. Therefore only
crashes involving cyclists have been considered in this analysis. Any crash in the selected
study area not involving a cyclist has been removed from consideration. Detailed crash
outputs, reporting and key assumptions from the CAS analysis is provided in Appendix A.
The remainder of this chapter summarises the key trends identified on the road corridors
considered critical for the study. Figure 15 shows the distribution of the crashes by Section.
Section 3
Section 2
Section 1
Figure 15: Cycle Crash Location in Study Area
| May 2013 Opus International Consultants LtdYou can also read