Issue NO. 315 MAY 2021 - Observer Research Foundation
←
→
Page content transcription
If your browser does not render page correctly, please read the page content below

Occasional Paper

                                                    Issue NO. 315              MAY 2021
                   © 2021 Observer Research Foundation. All rights reserved. No part of this publication
                     may be reproduced, copied, archived, retained or transmitted through print, speech
                                         or electronic media without prior written approval from ORF.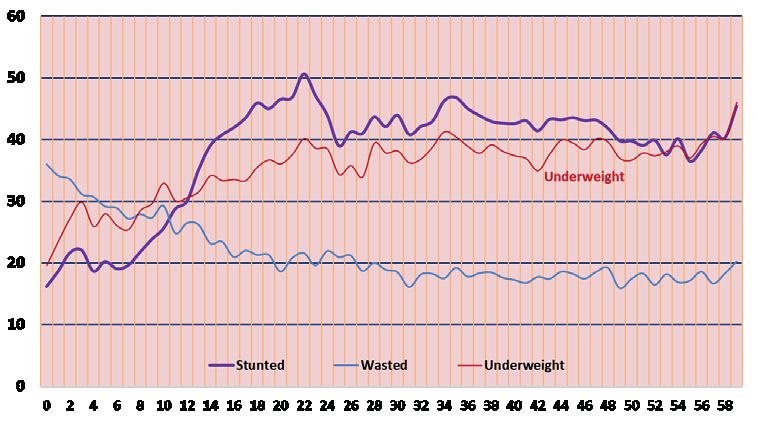
The 5th National Family
Health Survey of India: A
Sub-National Analysis of
Child Nutrition
Sheila C. Vir and Shoba Suri
Abstract
In December 2020, the government released the results of the National Family Health
Survey (NFHS) 5 for 2019-20, covering 22 states and Union Territories (UTs). Contrary
to expectations, NFHS5 found an increase in the percentage of stunted children in 13
states and UTs, compared to the results of NFHS4. This paper analyses such reversal
of the three-decadal progress that India had previously made in reducing stunting in
children. It analyses the determinants of such a regression and proposes measures that
need urgent attention. The paper notes a percentage-point increase in the coverage
of nutrition-sensitive interventions that address the underlying determinants of child
undernutrition, including improvement in women’s status and the provision of maternal
health services, as well as child health services. It argues for positioning the reduction
of child undernutrition high in the national development agenda and addressing
the immediate determinant of undernutrition by strengthening the complementary-
feeding component of the national nutrition mission.

Attribution:
Attribution: Sheila
             Archit C Vir and
                    Lohani,   Shoba Suri,Misinformation
                            “Countering    “The 5th National
                                                          andFamily  HealthOnline:
                                                              Hate Speech   Survey Regulation
                                                                                   of India: A Sub-National
                                                                                               and User Behavioural
Analysis
Change,”ofORF
           Child  Nutrition,”
               Occasional     ORF
                          Paper No.Occasional Paper2021,
                                    296, January    No. 315, May 2021,
                                                         Observer      Observer
                                                                  Research      Research Foundation.
                                                                           Foundation.

                                                     01
                                                      2
G
lobal evidence has established the serious implications of
malnutritiona on a child’s physical and brain development; in turn,
this has an adverse impact on cognitive development, and the
overall productivity and economic development of a nation. The
World Bank states, “A 1% loss in adult height due to childhood
stunting is associated with a 1.4% loss in economic productivity.”1 It is estimated
that undernourished children, as adults, have a reduced earning potential of at
least 10 percent of their lifetime earnings, while every additional centimetre gain
of adult height is associated with a 4.5-percent increase in wage rates.2,3 The
adverse impact of undernutrition on brain structure and development cannot be
corrected later in life and can lead to cognitive deficits and compromised learning
abilities.4,5 Undernourished children are at a disadvantage from the start and are
more likely to be enrolled in school late; they have higher chances of repeating
a grade or dropping out of school altogether.6,7,8 This is supported by studies
which report that adults who have a history of being stunted at age two, end up
completing one less year of schooling.9,10,11
At the national level, the impact of undernutrition on persistent poverty,
reduction in human capital, and lower gross domestic product (GDP) is well-
documented.12,13,14,15,16 Experts have established that malnutrition influences
the lack of progress in 14 of the 17 Sustainable Development Goals (SDGs).17
Globally, the cost of malnutrition is pegged at US$3.5 trillion per year, or
US$500 per person.18
Indeed, stunting has lasting effects on future generations. Moreover, the
high rate of anaemia19 amongst women results in entering pregnancy in an
anaemic stage—this has well-documented negative impacts on fetal growth and
Introduction
birthweight, as well as on the health status of the mother. After they are born,
and these infants do not receive adequate nutrients especially in the first 24
months of their life, their malnutrition and ill health worsens. A 2020 report in
the Lancet highlights the fact that about 68 percent of under-five child mortality
in India is associated with malnutrition.20
Findings from low- and middle-income countries have established that the
first 1,000 days of life is the opportune window for investing in child nutrition.21
The return on investment in reducing stunting and wasting in children is almost
sixteen-fold (US$16) on every US$1 invested.22
A study of Uttar Pradesh (UP) as early as in 1998, and the subsequent National
Family Health Survey 3 (NFHS 3) and NFHS 4 in 2015-16,23 also concur with
the age-wise trend in increase in undernutrition (stunting) rate in 0-24 months
a Malnutrition is measured as stunting or underweight or wasting.
3(See Figure 1). It is noted that undernutrition rates in young children increase
sharply between 0-24 months of age, and then levels off.24 Research has also
found that the stunting that occurs in this early age of two years is largely
irreversible.25
Figure 1
Child undernutrition trends, by age (0-
24 months)
6 to 18 months crucial: adult height is set at 2 years
of age
Stunted
% children
Wasted
Introduction
Age in months
Height at 2 years determines productivity and income NFHS 4: 2015-16
Source: National Family Health Survey 4, 2015-1626
The NFHS surveys, particularly NFHS 3 onwards, have called on the
country’s policymakers to address the immediate as well as the underlying
determinants of undernutrition in children (See Figure 2). In 2008, global
efforts led to a consensus on a set of evidence-based, direct essential nutrition
interventions (ENIs) that needed special attention to address malnutrition.
Five years later, in 2013, the Lancet Nutrition series stressed on the need to
couple ENIs with nutrition-sensitive interventions.27 Specific measures were
initiated to promote early initiation of breastfeeding, exclusive breastfeeding
4for the first six months, and other maternal and child health services. There was
also an emphasis on the importance of breaking the cycle of infection/diseases/
health and malnutrition, and the intergenerational cycle of malnutrition in
women. This led to the concept of a multisectoral programme to address child
undernutrition being built into the strategy of the National Nutrition Mission
or POSHAN Abhiyaan.28
Figure 2
A Conceptual Framework of
Malnutrition
S
Child nutrition, health H
O
and survival R
T
R
O
U
T
Hygiene E
S
L
O
N
G
Introduction
Income generation
R
O
U
T
E
S
Source: UN Standing Committee on Nutrition 200829
5Reversal of Previously Decreasing Trend in Child
Undernutrition
Prior to the first National Family Health Survey (NFHS 1) in 1992, the only
data available on undernutrition was limited to 10 states through the National
Nutrition Monitoring Bureau (NNMB). Following the NFHS 1, four national
surveys have been conducted: NFHS2 (1998-99),30 NFHS 3 (2005-6),31 NFHS
4 (2015-16),32 and NFHS 5 (2019-20). The fifth survey33 commenced in 2019
prior to the outbreak of COVID-19, and the phase 1 data for 22 states and UTs
was released in December 2020.
As shown in Figure 3, there was a substantial drop nationally in the percentage
of stunted and underweight young children between 1992 and 2015,34 along with
a corresponding decline in under-five mortality rate. In 2015-16, 38.4 percent
of children below five years were stunted and 35.7 percent were underweight.
In absolute numbers, however, India was still home to 46.6 million stunted
children, or one-third of the world’s 144 million under-five stunted children.35
Figure 3
Stunting, underweight and under-five
mortality trends (1992-2016)
Introduction
Stunting and Underweight Trends in India
120 109
100 95
80 74
60 52 53 50
46 48 47
42.5
38 35.7
40
20
0
Stunting Underweight Under-5 Mortality
1992-93 1998-99 2005-06 2015-16
Source: National Family Health Surveys36
6The latest NFHS data available for 22 states and UTs shows that the decrease in
the rate of stunting has not been sustained. Indeed, in most of the 22 states and
UTs covered by NFHS 5, there has been a reversal: the percentage of under-five
children who are reported to be stunted has increased.
The findings of NFHS 5, especially the increase in incidence of stunting, have
raised apprehensions among public health nutrition experts and development
professionals. This paper presents the results of a rapid trend analysis of the
findings of the 5th NFHS. The aim is to find ways by which timely actions can be
planned and executed to accelerate improvement in India’s goals for reducing
stunting in children.
The return on
investment in reducing
stunting and wasting in
children is 16-fold, or
US$16 for every dollar
Introduction
invested.
7T
he conceptual framework for this review comprises the
determinants of child undernutrition and the evidence-based
global interventions. As shown in Figure 2, the immediate
determinants of child undernutrition are inadequate food
and nutrient intake, and presence of ill health and diseases.
This present analysis considers the following immediate determinants: infant
and young child feeding practices, and child health services. Meanwhile, the
underlying determining factors with reference to trends in the coverage of
nutrition-sensitive interventions pertain to food and nutrition security, health
and nutrition care of women, empowerment of women, appropriate water-
sanitation-hygiene (WASH) practices, completion of at least 10 years or secondary
education by girls, and delaying age of marriage of girls to over 18 years.
This analysis focuses on the nutrition-sensitive factors, as the underlying
determinants of child stunting. A regression analysis of data from India, Nepal
and Bangladesh, found that the five highest risk factors that contribute to child
Rapid Trend Analysis
stunting were related to the situation of women in these countries. These factors
include the decision-making power of women, maternal health services (antenatal
services and institutional deliveries), percentage of mothers with height below
145 cm, education, domestic violence, sanitation, and hygiene environment (See
Table 1). NFHS 5 data captures information on a number of these nutrition-
on Child Stunting
sensitive indicators while some others are considered proxy indicators for women’s
economic and social status. These include information provided by NFHS 5 on
women having bank accounts or mobile phones, and access to safe fuel.
Table 1
Highest Risk Factors for Stunting in young
children: India, Nepal, and Bangladesh
India Bangladesh Nepal
No education of mothers Domestic Violence Maternal Height
Maternal Height Decision making power Water
Mothers with no Institutional Maternal Height Open Defecation
Delivery
Households with low standard of Secondary Education Born in Hospital
living
Households with no toilet facility Wealth Quintile ANCs visits
-- -- Maternal Education
Source: Adhikari Viret et al 2013;37 Heady & Hoddinott 2015;38and Bhagowali et al 202l.39
8Objectives of the Analysis
This preliminary analysis aims to understand the trends emerging from the
NFHS 5 data covering 22 states and UTs of India, and to provide inputs
regarding the overall directions that programmes on child nutrition need to
take. The following are the objectives of this analysis:
1. To analyse state-wise trends in child stunting rates in NFHS 5 (2019-20) as
compared to NFHS 4 (2015-16).
2. To undertake a state-wise comparison of NFHS 5 and NFHS 4 and analyse
the emerging trends in progress as well as gaps in the context of conceptual
framework comprising the immediate, underlying, and basic determinants
of child undernutrition.
Rapid Trend Analysis
3. To analyse progress and gaps in the percentage coverage of trends of
interventions dealing with the direct nutrition interventions as well as the
nutrition-sensitive measures.
4. Based on the observational trend analysis, to identify the factors that may be
on Child Stunting
contributing to the unexpected increase in the rate of child stunting.
5. To recommend measures that require urgent attention for reducing the
rates of child stunting.
Findings
This section highlights the NFHS 5 findings (2019-20) as compared to NFHS
4 (2015-16) regarding malnutrition in children, as manifested in stunting. It
presents information on the nutritional status of women and the coverage of
various interventions that address the underlying and immediate determinants
that impact child undernutrition (See Figure 2).
Figure 4 shows the state-wise patterns in childhood stunting rates for 22 states
and UTs, as reported in NFHS 5. Stunting rate was highest in under-five children
in Meghalaya (46.5 percent) and Bihar (42.9 percent); Sikkim was noted to have
the lowest child stunting rate at 22.3 percent. A comparison of NFHS 4 with
NFHS 5 findings revealed that there were only three states (Bihar, Manipur and
Sikkim) that reported a decline in the rate of stunting by at least 3 percentage
points, with Bihar declining from 48.3 percent in 2015-16 to 42.9 percent in
2019-20. Thirteen states and UTs showed a rise in the percentage of stunted
children. Of these, six (Goa, Himachal Pradesh, Kerala, Nagaland, Meghalaya,
9and Telangana) showed an increase in the rate of stunting in children by at
least 3 percentage points. The two states that had the lowest stunting rates in
children in 2015-16 (NFHS 4) but showed a substantial rise in stunting rate as
per the NFHS 5 survey are Goa (from 20.1 percent to 25.8 percent) and Kerala
(from 19.7 percent to 23.4 percent).
Figure 4
Stunting trends in 22 states and UTs
100
90
80
Rapid Trend Analysis
70
60
46.5
50 42.9
39.4
39
40 35.3 35.4 35.2 33.1 32.3 33.8
31.2 30.8 32.7 30.5 32
28.9 26.9
25.8
30 23.4 23.4 22.3 22.5
on Child Stunting
20
10 31.4 36.4 48.3 20.1 38.5 26.3 36.2 19.7 34.4 28.9 43.8 28.1 28.6 29.6 28 24.3 32.5 23.3 37.2 27.4 30.9 26.8
0
NFHS-5 NFHS-4
Source: National Family Health Survey 4 (2015-16)40 and 5 (2019-20)41
As seen in Figure 5, there is an increasing trend in overweight prevalence in
under-five children in all the 22 states and UTs. In one state (Sikkim) which
recorded a decrease of over 3 percentage points in undernourished children,
there was a 1-percent increase in the percentage of overweight children.
10Figure 5
Overweight trends in under-five
children in 22 States and UTs
25
20
13.4
15
10 9.6 9.6 10.5
10 8.2
4.9 5.7 4.9 5.4
3.9 4 4.1 3.4 4 3.4 4.3
5 2.7 2.4 2.8 3.2
1.9
1.2 2.3 1.2 3.7 1.9 1.9 2.6 3.4 1.9 3.1 3.9 4.2 3.8 8.6 0.7 3 2.1 3 3.9 5.7 4 1.6
0
Rapid Trend Analysis
on Child Stunting
NFHS-5 NFHS-4
Source: NFHS4 (2015-16)42 and NFHS5 (2019-20)43
11D
ata from the 4th and 5th NFHS were compared to analyse patterns
in three underlying factors for child undernutrition: poor access
to food, poor women’s health and child care practices, and poor
health and environment. These are commonly accepted as
the underlying determinants of undernutrition, which in turn
impact the immediate determinants of child undernutrition (See Figure 2).
Coverage of Interventions: The
Women’s overall status
Underlying Determinants of
As shown in Figure 2, women’s nutritional, socio-economic r status including
their ‘empowerment’ status, as well as their access to maternal and child health
services, are fundamental underlying factors that impact their child’s nutrition.
As presented in Figures 6 to 9 and Table 2a, disaggregated by state, the results of
NFHS 4 and NFHS 5 were compared with reference to the following indicators:
women’s nutrition, age of marriage, age of conception, mothers with minimum
ten years of education, and women empowerment with reference to decision-
making and their socio-economic situation. Data on women possessing mobile
Child Undernutrition
phones, and women having their own bank accounts, are studied as proxy
indicators of empowerment. No data on direct indicators that measured
decision-making power or economic situation was available in the past or latest
NFHS.
Figure 6
Prevalence of girls married below 18
years in 22 states & UTs (%)
25
20
13.4
15
10 9.6 9.6 10.5
10 8.2
4.9 5.7 4.9 5.4
3.9 4 4.1 3.4 4 3.4 4.3
5 2.7 2.4 2.8 3.2
1.9
1.2 2.3 1.2 3.7 1.9 1.9 2.6 3.4 1.9 3.1 3.9 4.2 3.8 8.6 0.7 3 2.1 3 3.9 5.7 4 1.6
0
NFHS-5 NFHS-4
Sources: National Family Health Survey- 4 (2015-16)44 and 5 (2019-20)45
12Figure 7
Prevalence of teenage pregnancies in
adolescent girls (15-19 years) in 22
Coverage of Interventions: The
states & UTs (%)
25
Underlying Determinants of
21.9
20
16.4
15
12.6
11.7
11
10 8.6
7.6 18.8 18.3
7.2
5.4 5.8
13.6 5.2
11.8 12.2 4.1 4.3
5 3.4 3.8 10.6
2.8 8.3 8.6 3.1 3 8.5
7.8 2.4 7.4 7.2
6.5 5.7 1.1
1
Child Undernutrition
4.7
2.9 2.6 3 2.8 3 01 0
0
NFHS-5 NFHS-4
Sources: National Family Health Survey- 4 (2015-16)46 and 5 (2019-20)47
13Figure 8
Women having completed 10 years or
more of schooling in 22 states & UTs (%)
Coverage of Interventions: The
100
90
Underlying Determinants of
77
80
71.5
65.9 67.8
70
60 52.5
50.2 50.4 50 51.3 50
48.1 49
50 44.4 45.5
39.6
40 33.8 35.1 35.8
32.9
29.6 28.8 72.2
30 58.2 59.4 23.2 56.8
49.1
20
45.5 42 45.9 39.9 40.7 43.6 40.3 37.1 44.6
34.3 33 33.6 33.3
10
26.2 22.8 23.4 26.5
Child Undernutrition
0
NFHS-5 NFHS-4
Sources: National Family Health Survey- 4 (2015-16)48 and 5 (2019-20)49
14Figure 9
Women who reported delivery in
institutional setup in the 22 states &
UTs (%)
Coverage of Interventions: The
96.5 99.7 97 99.8 97 99 96.5 99.6
100 94.3 94.7 94.7
91.7 92.4
95.1
Underlying Determinants of
88.2 89.2
90 84.1 85.8
79.9
76.2
80
70
58.1
60
50 45.7
40
30
20
10
91.5 70.6 63.8 96.9 88.5 76.4 94 99.8 90.3 69.1 51.4 79.7 32.8 94.7 91.5 79.9 75.2 96.4 88.5 85.5 90.8 99.3
0
Child Undernutrition
NFHS-5 NFHS-4
Sources: National Family Health Survey- 4 (2015-16)50 and 5 (2019-20)51
Nutritional status of women (15-49 years)
Women’s poor nutrition is one of the most important determinants of childhood
stunting (See Table 1). As seen in Figure 10, the prevalence of thinness in women
has declined since NFHS4, except for Kerala and Dadra and Nagar Haveli which
show an increase of 1.5 and 1.7 percentage points, respectively. According to
the World Health Organization (WHO), a prevalence rate of over 20 percent
of women with low BMI (Figure 10
Prevalence of women with low BMI/
thinness in 22 states & UTs
Coverage of Interventions: The
35
30 25.6 25.2 25.1
Underlying Determinants of
25
18.8
20 14.817.6 17.2 16.2 16.214.8
13.8 13.9
15 10 10.8 9.4 8
10 7.2 7.5 5.8
5.3 5.2 4.4
5 17.625.730.414.727.216.220.7 8.5 19.1 8.8 12.1 8.4 11.5 6.4 22.918.921.313.123.412.210.513.5
0
Assam
Goa
Sikkim
Manipur
Ladakh
Bihar
Andaman & Nicobar
Nagaland
Jammu & Kashmir
Himachal Pradesh
Gujarat
Lakshwadeep
Meghalaya
Kerala
Andhra Pradesh
Mizoram
Maharashtra
Karnataka
West Bengal
Dadra & Nagar Haveli
Tripura
Telangana
Child Undernutrition
NFHS-5 NFHS-4
Sources: National Family Health Survey- 4 (2015-16)52 and 5 (2019-20)53
Besides undernutrition, overweight and obesity in mothers also contribute
to birth of babies who are either small for gestation age (SGA) or have a low
birth weight (LBW). The trends in obesity/overweight in women (15-49 years)
shows a sharp increase in 16 of the 22 states and UTs. The maximum increase
is observed in Karnataka by 6.8 percentage points. Though NFHS5 does not
present data on access to food, a rising trend in percentage of overweight women
in most of the states (see Figure 11) shows that there might be an overall higher
intake of food, but not necessarily the right type of food items or with the right
food diversity.
16Figure 11
Obesity/overweight trends in women
(15-49 years) in 22 states & UTs
Coverage of Interventions: The
45
38.1 38.1
40 36.3 36.1
34.7
34.1 33.5
35
Underlying Determinants of
30.4 30.1 30.1 29.3 28.3
30 26.8
23.4 24.2
25 22.6 21.5 22.7
20 15.2 15.9 14.4
15 11.5
10
5 33.2 13.2 11.7 33.5 23.7 28.6 23.3 32.4 23.4 26 12.2 21 16.2 26.7 28.6 16 19.9 31.8 23.3 29.3 16.3 40.6
0
Child Undernutrition
NFHS-5 NFHS-4
Sources: National Family Health Survey- 4 (2015-16)54 and 5 (2019-20)55
Anaemia in women is a well-known cause of poor fetal growth and low birth
weight. However, the percentage rate of anaemia in adolescent girls and women
of reproductive age (15-49 years) shows an increasing trend in 16 states and
UTs; the highest rise is in Assam (19 percentage points), followed by Jammu
& Kashmir (17 percentage points), and Ladakh (14.4 percentage points). A
similar trend in prevalence percentage rate of anaemia is noted in adolescent
girls (15-19 years), with 16 states and UTs showing an increase.
17Age of marriage and Educational attainment
The data reveals a positive trend towards the lowering of incidence of girls being
married below 18 years. (See Figure 6) The exceptions are three north-eastern
states—Assam, Tripura, and Manipur. However, the percentage of adolescent
girls married remains high but stable in Karnataka, Meghalaya, West Bengal
Coverage of Interventions: The
and the two UTs (Andaman & Nicobar and Dadra & Nagar-Haveli). In five
states, including West Bengal and Tripura, almost one in ten adolescent girls is
reported to be pregnant at the time of the surveys (See Figure 7).
Underlying Determinants of
It is well-established that girls completing school education is a crucial factor
in lowering the incidence of teenage marriage or pregnancy.56 Moreover,
as shown in Table 1, women completing at least 10 years of education is an
important factor contributing to lowering the prevalence of child stunting.57
Unfortunately, there was rather slow progress in raising the percentage of
girls completing 10 years of education or more, between 2015-16 and 2018-19.
The overall trend indicates an improvement in all the states, except Tripura
where the girls falling in this category of education remains almost stagnant at
Child Undernutrition
about a quarter of women. There are only three states and one UT (See Figure
10) with over two thirds of women having completed 10 years of education at
least: Kerala (77 percent), Goa (71 percent), Lakshadweep (67.8 percent) and
Himachal Pradesh (65.9 percent).
Women’s empowerment
Table 2 a & b gives an overview of the state-wise coverage of some of the
nutrition-sensitive interventions, besides school education, that impact women
empowerment. The data shows an increase in the percentage points of women
having a mobile phone for their use as well as a bank or savings account, and
access to clean fuel. These improvements could be considered proxy indicators
of improvement in women empowerment.
Women’s poor nutrition has
been found to be one of the
most important determinants
of stunting in their children.
18Table 2a
Coverage of nutrition-sensitive interventions in women, by 22 States/
UTs , NFHS 4 and NFHS 5
States/UTs HH using clean fuel for Women having a bank Women having own Women facing spousal Mothers had 4 ANC Mothers consumed IFA Women with low BMI
cooking or savings account mobile phone violence visits for 180 days or more (Table 2b
Coverage of nutrition-sensitive interventions in children,
by 22 States/UTs, NFHS 4 and NFHS 5
States/UTs Children with Exclusive Children (6-23 mo) Stunting
diarrhoea recieved Zinc Breastfeeding receiving Adequate dietb
NFHS 5 NFHS 4 % (+/-) NFHS 5 NFHS 4 % (+/-) NFHS 5 NFHS 4 % (+/-) NFHS 5 NFHS 4 % (+/-)
Andhra Pradesh 41.8 30.1 +11.7 68 70.2 -2.2 9.3 7.6 +1.7 31.2 31.4 -0.2
Assam 28 22 +6.0 63.6 63.5 +0.1 8 8.9 -0.9 35.3 36.4 -1.1
Bihar 25.6 20.1 +5.5 58.9 53.4 +5.5 10.9 7.5 +3.4 42.9 48.3 -5.4
Goa -- -- -- 61.4 60.9 +0.5 21.5 10.4 +11.1 25.8 20.1 +5.7
Gujarat 35.4 17.4 +18.0 65 55.8 +9.2 5.9 5.2 +0.7 39 38.5 +1.5
Himachal Pradesh 19.5 15 +4.5 69.9 67.2 +2.7 19 10.9 +8.1 30.8 26.3 +4.5
Karnataka 45.5 34.3 +11.2 61 54.2 +6.8 12.8 8.2 +4.6 35.4 36.2 -0.8
20
Kerala 22.4 14.1 +8.3 55.5 53.3 +2.2 23.5 21.4 +2.1 23.4 19.7 +3.7
Maharashtra 27.3 13 +14.3 71 56.6 +14.4 9 6.5 +2.5 35.2 34.4 +0.8
Manipur 26.1 14.1 +12.0 70.7 73.6 -2.9 19.6 18.8 +0.8 23.4 28.9 -5.5
Meghalaya 40.5 57.8 -17.3 42.7 35.8 +6.9 29.8 23.5 +6.3 46.5 43.8 +2.7
Mizoram 29.8 29 +0.8 67.9 61.1 +6.8 13.4 14.5 -1.1 28.9 28.1 +0.8
Nagaland 9.1 16 -6.9 43.2 44.3 -1.1 14.5 18.8 -4.3 32.7 28.6 +4.1
Sikkim 50 -- -- 28.3 54.6 -26.3 24.7 23.1 +1.6 22.3 29.6 -7.3
Telangana 38.5 31.6 +6.9 68.2 67 +1.2 9.2 10.1 -0.9 33.1 28 +5.1
Tripura 16.7 19.1 -2.4 62.1 70.7 -8.6 13.5 5.9 +7.6 32.3 24.3 +8.0
West Bengal 36 20.8 +15.2 53.3 52.3 +1.0 23.4 19.6 +3.8 33.8 32.5 +1.3
Andaman & Nicobar Islands 44.1 8.3 +35.8 73.3 66.8 +6.5 19.5 14.2 +5.3 22.5 23.3 -0.8
Dadra & Nagar Haveli and -- 12.9 -- 79.4 67.9 +11.5 10.2 2.1 +8.1 39.4 37.2 +2.2
Daman & Diu
Jammu & Kashmir 50.5 39.3 +11.2 62 65.4 -3.4 13.6 23.5 -9.9 26.9 27.4 -0.5
Lakshadweep -- -- -- 70.9 64.1 +6.8 24 23.9 +0.1 30.5 30.9 -0.4
Ladakh 54.5 -- -- 67 54.8 +12.2 19 15.9 +3.1 30.5 30.9 -0.4
b Breastfed children receiving 4 or more food groups and a minimum meal frequency, non-breastfed children fed with a minimum of 3 Infant and Young Child Feeding Practices (fed with other
milk or milk products at least twice a day, a minimum meal frequency that is receiving solid or semi-solid food at least twice a day for breastfed infants 6-8 months and at least three times a day
for breastfed children 9-23 months, and solid or semi-solid foods from at least four food groups not including the milk or milk products food group).Maternal health services
Table 2a shows the coverage of the recommended minimum four contacts for
antenatal care (ANC) services. The aim is to ensure at least 90 percent coverage.
There is an improvement in this intervention across 11 states and UTs, with more
significant change in Bihar, Manipur and Goa—the last of which is the highest in
Coverage of Interventions: The
the country at 93 percent. Despite improvement in ANC coverage, there is a lack
of corresponding increase in the percentage of pregnant mothers consuming
the recommended 180 iron-folic acid (IFA) tablets and there is a wide variation
Underlying Determinants of
across states: Kerala reported a coverage of 67 percent; Goa, 65 percent; and
Nagaland, a minuscule 4.1 percent. The percentage of women who underwent
institutional delivery of their infant has increased significantly. (See Figure 9.)
Household environment
There was a marked improvement in the use of improved drinking water source
and sanitation facilities. Nearly all the states and UTs recorded an increase; the
Child Undernutrition
exception is Sikkim (See Figures 12 & 13).
Figure 12
Households with improved water source
in 22 states & UTs
96.7 99.2 98.5 97.2 98.7 97.5 96.3
96.2 95.8
100 95.3 94.9 93.5
91 92.8
95.4
91.9 92.9
88 88.7
90 86
77.1
79.2
80
70
60
50
40
30
20
10
95.6 84.2 98.4 96.7 95.9 94.9 95.3 94.8 92.5 63.9 70.3 93.8 82.4 97.8 97.7 86.4 97.2 95 94.8 89.1 83 91.1
0
NFHS-5 NFHS-4
Sources: National Family Health Survey- 4 (2015-16)58 and 5 (2019-20)59
21Figure 13
Households that use an improved
sanitation facility in 22 states & UTs
Coverage of Interventions: The
98.7 99.8
100 95.3
87.9 87.7 87.3 88
90 82.9
81.8
77.3
80 76.2
Underlying Determinants of
74 74.8 75.7
72 73.6
68.6 68
70 64.9 65.8
60
49.4
50
42.3
40
30
20
10
Child Undernutrition
55.4 49 26.5 78.7 63.6 72.3 57.8 98.2 52.3 52.6 61.4 84.4 76.7 89.7 52.3 63.7 52.8 75.4 44.4 53.8 17.8 99.6
0
NFHS-5 NFHS-4
Sources: National Family Health Survey- 4 (2015-16)60 and 5 (2019-20)61
In summary: As illustrated in Table 2 a & b and Figures 6 to 9, the results of
NFHS 5 indicate a substantial improvement in the percentage coverage of the
nutrition-sensitive interventions that address the underlying determinants of
child undernutrition:
yy women empowerment status (proxy indicators: women having their own
mobile phones, having a bank or savings account, married above 18 years,
reduction in domestic violence);
yy maternal health services (minimum of four ANCs, institutional delivery);
and,
yy improved household situation (access to sanitation facilities, safe clean
fuel).
22These underlying factors are in turn influenced by existing government
policies that are being rolled out in the past five or six years under a number of
programmes for achieving universal sanitation, improving women’s economic
situation, and promoting education and care of girls. These underlying factors
influence the immediate determinants that are discussed in the subsequent
section of this paper.
Coverage of Interventions: The
Underlying Determinants of
Between the 4th and 5th
NFHS, there has been a
substantial improvement
in the percentage coverage
of nutrition-sensitive
Child Undernutrition
interventions, including
women empowerment and
maternal health services.
23A s presented in Figure 2, the two immediate determinants of child
undernutrition are nutrient intake, and infection and ill-health.
Nutrient intake: Breastfeeding & Complementary
Feeding
Nutrient intake in the first two years of life is governed by appropriate infant
and young child feeding (IYCF) practices, which comprise breastfeeding and
Immediate Determinants
complementary feeding (CF).c The fifth NFHS provides details on two indicators
of breastfeeding practices (early initiation of breastfeeding, and exclusive
breastfeeding for the first six months), and two indicators of appropriate CF
(timely introduction of CF at six to eight months, and adequacy of CF).
The results of NFHS 5 indicate that the percentage of mothers following
the practice of early initiation of breastfeeding has declined in 12 states and
UTs (See Figure 14). The maximum percentage points decline is observed in
Sikkim (33.5 percent), Dadra and Nagar Haveli (24.1 percent), and Assam (15.3
percent). Meanwhile, a rise in the rates of early initiation of breastfeeding is
and Interventions
observed in Lakshadweep, Meghalaya, and Andhra Pradesh. Moreover, as also
noted in the NFHS 4 findings, in 10 states and UTs, there is a substantial gap
in the percentage of mothers who had institutional delivery (See Figure 9) and
in the mothers who followed the practice of early initiation of breastfeeding.
The practice of exclusive breastfeeding (See Figure 15) shows only a marginal
improvement. Since NFHS 4, there has been a steep decline of 26.3 percentage
points in the practice of exclusive breastfeeding in Sikkim.
There are substantial gaps
in the percentage of mothers
who had institutional delivery,
as well as those who followed
the practice of early initiation
of breastfeeding.
c Complementary Feeding (CF) refers to feeding an infant, from six months onwards, semisolid food
to complement breastfeed which by itself is inadequate to provide the increased requirements of
nutrients for the rapidly growing infant
24Figure 14
Early initiation of breastfeeding within
an hour of birth in 22 states & UTs
90 78.8 76.3
80
66.7
70 61.6
Immediate Determinants
60.1 57.9 59.4
55.6 57.9
60 52 49.1 49.1
53.2 53.7
45.1 46.9
50 37.8 37.1 36.4 42
40 31.1 33
25.9
30
20
10 40 64.4 34.9 73.3 49.9 41.1 56.3 64.3 57.5 65.4 60.6 70.3 53.1 66.5 36.9 44.4 47.4 41.9 50 45.7 60 57.7
0
Assam
Sikkim
Ladakh
Goa
INDIA
Manipur
Bihar
Andaman & Nicobar
Jammu & Kashmir
Nagaland
Himachal Pradesh
Lakshwadeep
Gujarat
Meghalaya
Kerala
Andhra Pradesh
Mizoram
Maharashtra
Karnataka
West Bengal
Dadra & Nagar Haveli
Tripura
Telangana
and Interventions
NFHS-5 NFHS-4
Sources: National Family Health Survey- 4 (2015-16)62 and 5 (2019-20)63
25Figure 15
Exclusive breastfeeding for 6 months in
22 states & UTs
90 79.4
80 69.9 71 70.7 73.3 70.9
68 67.9 68.2 67
Immediate Determinants
63.6 65
70 58.9 61.4 61
55.5
62.1 62
53.3 55
60
50 42.7 43.2
40 28.3
30
20
10 70.2 63.5 53.4 60.9 55.8 67.2 54.2 53.3 56.6 73.6 35.8 61.1 44.3 54.6 67 70.7 52.3 66.8 67.9 65.4 64.1 54.8
0
Dadra & Nagar…
Assam
Goa
Manipur
Sikkim
Ladakh
Bihar
INDIA
Andaman & Nicobar
Nagaland
Himachal Pradesh
Jammu & Kashmir
Gujarat
Kerala
Meghalaya
Lakshwadeep
Andhra Pradesh
Mizoram
Maharashtra
Karnataka
West Bengal
Tripura
Telangana
and Interventions
NFHS-5 NFHS-4
Sources: National Family Health Survey- 4 (2015-16)64 and 5 (2019-20)65
Timely introduction of complementary feeding (See Figure 16) at 6-8 months
and diet adequacy are important indicators of young child feeding practices.
In nine states and UTs, there has been a declining trend in adopting the
practice of timely introduction of semisolid food to a child. Both Kerala and
Himachal Pradesh, with over 3-percent increase in child undernutrition rate,
show a substantial increase in the percentage of children who are introduced
to complementary feeding on time. A wide variation is noted across the 22
states and UTs in following the recommended practice of timely introduction of
complementary feeding, with Tripura showing an increase of 39.5 percentage
points.
26Figure 16
Introduction of complementary feeding
(6-8 months) in 22 states & UTs66
90 78.9
80 68.3
71.3 69.4 67.8
66.8
70
Immediate Determinants
56.9 57.4
60 50.8 51.7 52.7 51.3 53.1
45.8
50 39
42 43.3 41.8 43
40
30
20
10 56.1 49.9 30.8 49.4 52.9 46 63.1 43.3 78.8 67.4 68.2 70.7 61.8 57.5 13.6 52 45.1 19.6 50.2 42.2
0
Assam
INDIA
Goa
Manipur
Sikkim
Ladakh
Bihar
Andaman & Nicobar
Himachal Pradesh
Jammu & Kashmir
Nagaland
Lakshwadeep
Gujarat
Meghalaya
Kerala
Andhra Pradesh
Mizoram
Maharashtra
Karnataka
Dadra & Nagar Haveli
West Bengal
Tripura
Telangana
and Interventions
NFHS-5 NFHS-4
Sources: National Family Health Survey- 4 (2015-16)67 and 5 (2019-20)68
Minimum acceptable diet (or diet adequacy) is a composite indicator of diet
diversity and frequency of feeding. Here, the percentage coverage is noted to
have remained extremely low from the time of the fourth NFHS, to the fifth—at
a range of 5.9 to 29.8 percent (See Figure 17). Only one state (i.e., Meghalaya)
has percentage coverage of over 25 percent. In five states—namely, Assam,
Mizoram, Nagaland, Telangana, Jammu and Kashmir—there has in fact been a
decline in the percentage of young children being given adequate diet.
27Figure 17
Children 6-23 months receiving a
minimum acceptable diet in 22 states &
UTs
Immediate Determinants
35
29.8
30
24.7 24
23.5 23.4
25 21.5
19 19.6 19.5 19
20
12.8 13.4 14.5 13.5 13.6
15 10.9 10.2
9.3 9 9.2 9.6
8
10 5.9
5 7.6 8.9 7.5 10.4 5.2 10.9 8.2 21.4 6.5 18.8 23.5 14.5 18.8 23.1 10.1 5.9 19.6 14.2 2.1 23.5 23.9 15.9
0
Assam
Sikkim
Goa
Manipur
Ladakh
INDIA
Bihar
Andaman & Nicobar
Nagaland
Himachal Pradesh
Jammu & Kashmir
Gujarat
Lakshwadeep
Meghalaya
Kerala
Andhra Pradesh
Mizoram
Maharashtra
Karnataka
West Bengal
Dadra & Nagar Haveli
Tripura
Telangana
and Interventions
NFHS-5 NFHS-4
Sources: National Family Health Survey- 4 (2015-16)69 and 5 (2019-20)70
The trend in CF practices in six (Goa, Himachal Pradesh, Kerala, Nagaland,
Telangana, Tripura) of the 22 states and UTs where percentage rate of increase in
stunting was 3 percentage points as compared to NFHS 4 was analysed. In three
of the states (Goa, Himachal Pradesh, Kerala), the dietary adequacy remained
almost stagnant despite the fact that overweight and obesity in women increased
and maternal-child health services and women empowerment indicators
continued to remain in the higher range (See Table 2). For example, in Himachal
Pradesh, with 66 percent women having at least 10 years of education, there is at
least a three-percent increase in undernutrition but almost a two-fold increase
in overweight and obesity in children. In the other two states (Telangana and
Nagaland), there is a decline in the complementary feeding practices either in
terms of the timely introduction of CF between 6-8 months (Telangana) or in
diet adequacy (Nagaland). In Tripura, there are unexpected changes in both
breastfeeding and complementary feeding practices and an escalation in both
childhood stunting and overweight.
28On the other hand, a substantial decreasing trend of 5 percent in stunting rate
is noted in Bihar. As shown in Table 2, a significant percentage point increase in
both the underlying and immediate determinants—including timely introduction
of CF (30.8 to 39 percent)—is noted in Bihar. Similarly, the improving trend
in child undernutrition in Manipur seems to be due to a combined impact of
improvement in the nutrition-sensitive indicators (household profile, women
empowerment, pregnancy and delivery care) and in adequacy of diet (increased
from 14.0 to 22.0 percent) and access to food (proxy indicator being overweight
in women, increased from 26.0 to 34.1 percent). The situation in Sikkim,
Immediate Determinants
however, is complex: the incidence of overweight and obesity in women has
increased substantially—from 26.7 percent in NFHS 4 to 34.7 percent in NFHS
5, while the stunting rate in children also increased. However, adequacy of CF
is almost stagnant (from 23.1 percent in NFHS 4 to 24.7 percent in NFHS 5)
but there is an unusual increasing trend in the percentage of children given CF
in the recommended age of 6-8 months. At the same time, this analysis notes
a significant decline in exclusive breastfeeding practices (from 54.6 percent in
NHFS 4 to 28.3 percent in NFHS 5). The situation in Sikkim is rather unique
and needs to be further analysed using the district data.
and Interventions
Diseases/infections and Prevention
The other immediate determinant of child undernutrition is overall health, or
the absence of diseases. Food consumed by a child will not be utilised well if a
child also suffers from ill-health caused by frequent diseases and infections. The
interventions therefore comprise measures that prevent frequent childhood
diseases, infections and illnesses. The two NFHS indicators used in this study
are: percentage of children fully immunised, and percentage who received oral
rehydration solution (ORS) and ORS along with Zinc supplements (See Figure
18, Table 2 b). The NFHS 5 findings indicate a substantial improvement in
the trend in all of these three indicators of health services. In the states and
UTs of Goa, Himachal Pradesh, Karnataka, Sikkim, West Bengal, Jammu &
Kashmir, Ladakh, and Lakshadweep—full immunisation coverage is over 80
percent while in Dadra & Nagar Haveli, the coverage has reached 90 percent
(See Figure 19).
29Figure 18
Children with diarrhoea receiving ORS in
20 states & UTs
90 73.7 71.3 75.3
80.8 78.3
80 69.1 66.5 69.8 73.2 71.4 67.2
62.5 64.2 65 84.9
70 58.2 61.1 59.5
77.4 54.5 56.3
60 70 51
69.1
64.7 65
50 62.7
Immediate Determinants
60.5 60.2 56.8
40 47.6
51.9
45.2 46.2
52.8 49.4
46.3
30 40.3
20
10
0
Dadra & Nagar…
!ndaman &…
Goa
Ladakh
INDIA
Manipur
Sikkim
Assam
Bihar
Jammu & Kashmir
Himachal Pradesh
Nagaland
Gujarat
Lakshwadeep
Kerala
Meghalaya
Andhra Pradesh
Maharashtra
Mizoram
Karnataka
West Bengal
Tripura
Telangana
NFHS-5 NFHS-4
and Interventions
Sources: National Family Health Survey- 4 (2015-16)71 and 5 (2019-20)72
Figure 19
Children 12-23 months fully immunised
in 22 states & UTs
94.9
100 89.3 87.8 86.2 88.2 86.1
90 81.9
76.3
81.4 77.8
73.5
80.6 79.1 77.8
73 72.5
80 66.4
71 68.8
63.8
69.5
70 57.9 62
60
50
40
30
20
10 65.3 47.1 61.7 88.4 50.4 69.5 62.6 82.1 56.2 65.8 61.4 50.7 35.4 83 67.5 54.5 84.4 73.2 50.5 75 81.9 89
0
Dadra & Nagar…
Assam
Goa
Ladakh
Manipur
Sikkim
INDIA
Bihar
Andaman & Nicobar
Jammu & Kashmir
Himachal Pradesh
Nagaland
Lakshwadeep
Gujarat
Kerala
Meghalaya
Andhra Pradesh
Mizoram
Maharashtra
Karnataka
West Bengal
Tripura
Telangana
NFHS-5 NFHS-4
Sources: National Family Health Survey- 4 (2015-16)73 and 5 (2019-20)74
30A
s analysed in the earlier sections of this paper, NFHS 5 data in
the last 4-5 years (the period between 2015/16 of NFHS 4 and
2019/20 NFHS 5), indicate a positive trend in percentage increase
in the coverage of nutrition-sensitive interventions that address
the underlying determinants of child undernutrition such as
water-sanitation as well as the proxy indicators of women empowerment. These
developments in the last three to four years could be attributed to a number of
initiatives by the government. They have resulted in either the introduction of
new policies or the effective roll-out of existing policies and programmes. These
include accelerated coverage of national programmes such as Jan Dhan Yojana,
Janani Suraksha Yojana (JSY), Swachh Bharat Abhiyaan, Ujjawala Scheme,
PMMVY (Pradhan Mantri Matru Vandana Yojana), Mahila Kisan Sashaktikaran
Karan Pariyojana (MKSP) under the National Health Mission, National Rural
Livelihood Mission (NRLM), and Beti Bachao Beti Padhao mission.
With reference to the immediate determinants, there is an improvement in
the interventions on maternal child health services such as immunisation and
antenatal services. However, the other immediate determinants pertaining to
intake of nutrients through appropriate IYCF practices are far from appropriate.
The NFHS 5 findings confirm that the child feeding practices, particularly of CF,
have remained extremely poor. The percentage of children who are reported
Trend Analysis:
to receive the benefit of diet adequacy of 20 percent or above is noted in only
six states, with the highest diet adequacy reported from Meghalaya state (29
percent). This is very low compared to the other countries of Asia and South
America, which have a much higher percentage of children in the category of
diet adequacy (See Figure 20).
An Overview
NFHS5 has found
that child feeding
practices, particularly of
complementary feeding,
remain extremely poor.
31Figure 20
Complementary Feeding, Food
adequacy situation in LMICs and India
60
54 55
52
50 48
40
40 36
30
20
10
10
0
India Nepal Indonesia Mexico Guatemala Thailand Vietnam
Trend Analysis:
Minimum Dietary Adequacy (%)
Source: UNICEF IYCF global database75
An Overview
In progressive states such as Himachal Pradesh and Kerala where a higher
percentage of women have completed secondary education, there is also a
corresponding increase in the percentage of overweight and obese women, but
also an unexpected increase in child stunting rates. These findings prove that
poor purchasing power is possibly not the primary contributory factor. Child care,
including feeding practices, are possibly getting adversely affected since there
is a high chance that educated and empowered mothers are employed in tasks
outside their homes and there is inadequate time to follow the recommended
complementary feeding practices. Such a trend also indicates that caregivers are
not paying attention to the appropriate selection of food items for family’s daily
diet. This possibly also shows that once there is increase in decision-making
power, the daily family eating habits possibly shift—to indulging more in high-
fat and refined carbohydrate diets. This observation is strengthened by field
studies in Gujarat and MP which reported that parents—often the father—tend
to spend 20 rupees or more per day to buy processed foods items for their
children, such as biscuits, cookies, fried wafers, and salty and sweet snacks.76
These food items are often high in saturated fats, trans fatty acids, sugar, and
salt. Advertisement and intensive marketing of such food items are also critical
32driver which influences the selection of complementary food items. These
findings concur with recent studies which found that intake of such unhealthy
food items is on the rise even in low-income countries.77,78,79
The fifth NFHS confirms that the complementary feeding (CF) practices
being followed are poor and need urgent attention. It is well recognised that
most of the growth faltering occurs during this critical period from six months
to two years, when CF plays a significant role in addressing nutrition intake
by a child. This period of growth faltering also coincides with the transition
from exclusive breastfeeding to consuming a wide range of family foods while
continuing to breastfeed.80-81 Insufficient quantities and inadequate quality of
complementary foods, together with poor feeding practices and increased rates
of infection, contributes to such growth faltering.82,83,84,85,86 It is evident that
adoption of appropriate complementary feeding practices requires behavioural
changes with reference to making informed selection of appropriate food items
and following recommended feeding practices. For influencing IYCF practices,
a well-planned and effective social behavioural and communication (SBCC)
strategy is essential since the behaviors are ingrained in society and in family
traditions. The imperative is to reach mothers, caregivers, family members, and
others in the extended circle of influencers.
Adoption of appropriate breastfeeding practices is also not limited to merely
Trend Analysis:
having the correct knowledge but influencing adoption of desirable skills and
practices. Studies undertaken in Maharashtra and Gujarat, for example, have
demonstrated that breastfeeding is largely “mother dependent” and introduction
of appropriate techniques of proper “cradle” holding and actively discouraging
An Overview
“nipple suckling” for effective breastfeeding is feasible and contributes to
improvement in ‘catch up’ growth even in low birth weight newborns and in
preventing undernutrition.87 The power of existing legislation, “The Infant
Milk Substitutes, Feeding Bottles, and Infant Foods (Regulation of Production,
Supply and Distribution) Act”, 1992 (IMS Act), and strengthening a number
of programmes such as Home Based Care of Newborn, Home based Care of
Young Children, Mother’s Absolute Affection (MAA) programme, Breastfeeding
Friendly Hospital Initiative (BFHI), and establishment of Human Donor Milk
Bank.88 It is noteworthy that in India, unlike in many other countries, the Infant
Milk Substitutes Act89 also bans marketing and advertisements of complementary
foods. However, many food items such as biscuits are smartly marketed for the
general population and unfortunately replace home-cooked food and are used
for feeding the young children.
Compared to breastfeeding promotion, convincing caregivers and community
regarding adoption of appropriate complementary feeding practices, including
access to diversified diet is complex. It requires context-specific and scientifically
appropriate inputs.
33T
his trend analysis of NFHS 5 data indicates a progressive trend
in some of the nutrition-sensitive interventions which address
the underlying determinants of malnutrition. However, efforts
are required to continuously improve the coverage and meet
the target of at least 90 percent coverage. At the same time, the
findings reveal that the complementary feeding practices remain poor and
therefore it is imperative to direct interventions towards the improvement of
dietary adequacy for young children. The following actions are crucial.
Intensify advocacy to position investing in child
nutrition high in the development agenda
Recommendations and
At the level of family and community, there is little recognition of the “invisible”
chronic undernutrition, measured as stunting or poor height for age. The
predominant public perception of an undernourished child —severely wasted,
without any visible fat and looking ill and famished—prevents a correct
understanding of childhood undernutrition. Stunting may not be clearly visible
but has serious adverse effects on optimum physical and brain development,
immunity and health, cognitive development , and school performance; it also
has serious implications in the incidence of adult onset non-communicable
diseases.90 A stunted child may in fact appear overweight or chubby, which
is often incorrectly perceived as signs of being “healthy”. The policymakers,
public, community and caregivers at large need to be made aware of the largely
irreversible serious damage of child undernutrition not only on physical growth
but on the development of the nervous system and brain in the first 1000 days
of life—from the period of foetal growth in pregnancy to the time that the child
is two years of age.91 There is an urgent need for policymakers to internalise
Conclusion
that reversing of stunting and child growth deficits are difficult while cognitive
deficits may be permanent after two years.92 Investing in improving child
nutrition needs to be a national priority.
Converge nutrition-sensitive and direct nutrition actions
at the level of families
Evidence gathered over nearly two decades confirms that a child’s first 1,000
days of life is the most opportune period for preventing undernutrition.
Microplanning is important to reach mothers and children in this period: to
identify and map families in a community with a pregnant woman, or a child
0-24 months, or a newly married woman in the preconception stage—and
classify these households as at “high risk” of undernutrition and thus requiring
urgent special attention to prevent young children slipping into undernutrition.
34In a population of 1000, for example, with a total fertility rate of 2, it is estimated
that there would be around 45 to 50 such ‘high risk’ households. Mapping
and reaching these households is essential for effectively addressing both the
feeding practices and the immediate and underlying determinants of child
nutrition.93 It is crucial to pay attention to the following: young child feeding
and maternal nutrition practices; weight gain of pregnant women and children
0-24 months; timely provision of maternal and child health and family planning
services; improving purchasing power; providing water-sanitation facilities; and
preventing frequent pregnancies and domestic violence.
In turn, these tasks call for a multisystem design comprising Health, ICDS,
National Rural Livelihood Mission (NRLM) and other systems dealing with
homestead food production, water-sanitation programmes, and converging
Recommendations and
inputs in the identified “high risk” households. Unfortunately, however, the
multisystem design of the POSHAN Abhiyaan or the National Nutrition Mission
remains largely driven by the ICDS system or anganwadi services. Efforts should
be directed that such multisector convergence takes place at the family level
and is addressed through the plans of action of the panchayat and other micro-
level village and urban wards. (See Figure 21)
At the level of family
and community, there
is little recognition of
Conclusion
the ‘invisible’ chronic
undernutrition of many
young children.
35Figure 21
Immediate, Intermediate and
Underlying Causes: Nutrition-Specific
and Nutrition-Sensitive Interventions
Recommendations and
Conclusion
Source: Maternal, Infant, Young Child Nutrition (MIYCN)94
36Revisit and strengthen complementary feeding policy
and action plan of POSHAN Abhiyaan
India has a policy in place to protect, promote, and support appropriate Infant
and Young Child Feeding (IYCF) practices.95 However, as compared to the
promotion of breastfeeding, efforts to improve complementary feeding (CF)
have lagged behind. Indeed, exclusive breastfeeding has gained much attention
in India in recent years, more than the promotion of complementary feeding
practices by both the ICDS and health sectors. This is because of the widespread
appreciation for evidence that breastfeeding plays a critical role in reducing
infant mortality rate (IMR) and under-5 mortality rate (U5MR). There is also
growing evidence on the need to promote exclusive and effective breastfeeding
Recommendations and
to ensure ‘catch up growth’ in the first six months life.96
Complementary feeding has an extremely critical role. Scientific evidence
indicates that interventions that improve complementary feeding, including
education on appropriate feeding practices, with or without provision of food
supplements, are among the most effective measures to reduce stunting during
the first two years of life.97,98,99 In most middle- and low-income countries,
including India, much of the decline in height-for-age during the first two
years of a child’s life occurs during the complementary feeding period—i.e.,
between six and 23 months of age.100,101 An analysis of two models of coverage
of selected interventions found that appropriate complementary feeding
would prevent about half of all stunting cases. Insufficient quantities and
inadequate quality of complementary foods, together with poor young child
feeding practices and increased rates of infection during this period, are direct
risk factors for stunting.102,103 Adoption of appropriate CF is crucial since it is a
period of transition where the baby gradually becomes accustomed to eating
Conclusion
from the family pot while continuing to be breastfed. Eating patterns and habits
developed during these early years of life usually continue till later years.
Appropriate CF practices comprise two components: food and feeding. Poor
nutritional status in young children noted in this analysis is possibly associated
with poor diet adequacy of CF. Studies have established the association between
diet adequacyd and preventing stunting.104 Poor feeding practices cannot be
solely attributed to a lack of purchasing power. Studies in India have reported
that in families with cases of child undernutrition in the 1-3 age group, the
percentage of children consuming adequate calories and protein (at least 70
percent of the recommended daily allowance or RDA) is much lower than the
d Diet adequacy is a composite indicator of appropriate diet diversity and feeding the child the right
quantity of food, and with right frequency. Poor feeding practices cannot be solely attributed to a lack
of purchasing power.
37percentage of mothers with such level of RDA intake.105 This is also evident
from the analysis of NFHS 3 data of 2006 which showed that there were
substantial differences in nutritional status between mother and under-five
child in the same household.106 A 2018study in Delhi slums also found that while
mothers are reported to be overweight, their children below two years are often
undernourished or stunted.107 Faulty CF practices also possibly contributes to
the increasing trend in overweight that was noted in NFHS 5 in each and every
state.
Besides poor purchasing power or poverty—which cannot be ignored and
adversely influences access to quality diversified food—the primary reason for
food inadequacy appears to be lack of knowledge regarding what to feed, how
to feed, and how frequently to feed, as well as time availability with mothers
Recommendations and
and caregivers. Lack of correct information on appropriate young child feeding
practices is possibly the primary reason resulting in poor CF practices. A study
in the two northern Indian states—Uttar Pradesh (UP)108 and Bihar—109 reveals
that mothers are generally not aware of the implications of undernutrition nor
of the significance of appropriate child feeding practices. Studies110 undertaken
by an NGO in Madhya Pradesh and Gujarat concurred that lack of financial
resources per se is not the only cause of the lack of proper young child feeding
practices. Families with young children are observed to be spending as high as
INR 20 or more per day to purchase commercially produced packets of fried
spicy or sugary snacks, rather than quality nutrient dense food items such eggs,
milk and milk products, or pulses. This is also supported by data from NFHS
4,111 which showed that 20 percent of children under five, even in the highest
wealth index, were stunted.
Moreover, the current findings indicate a possible shift in the aspirations of
caregivers who use their meagre resources to buy processed snacks and other
Conclusion
items like mobile phones, rather than nutritionally dense food items like milk
and milk products, eggs, fish, vegetables or fruits. A systematic study is required
to probe this phenomenon, to determine if such decisions are made because
processed food items that are attractively packaged, or accessories like mobile
phones, are associated with a higher social status.
Appropriate CF practices need to combine the selection of suitable food
items with the recommended feeding practices. CF therefore is not limited
to interventions for ensuring access and availability of diversified quality food
items in adequate quantity; it should be coupled with measures to ensure that
caregivers adopt the appropriate feeding practices. The latter is measured by
indicators such as timely introduction of CF at six to eight months, as well as
ensuring a child is fed frequently as per the recommended frequency of two
to four times a day. POSHAN Abhiyaan, launched in 2018, aims to promote
38You can also read