ITALY'S FIFTH NATIONAL REPORT TO THE CONVENTION ON BIOLOGICAL DIVERSITY - (2009-2013) - Ministry for the Environment, Land and Sea
←
→
Page content transcription
If your browser does not render page correctly, please read the page content below
Ministry for the Environment, Land and Sea

ITALY’S FIFTH
NATIONAL REPORT TO
THE CONVENTION ON
BIOLOGICAL DIVERSITY

       (2009-2013)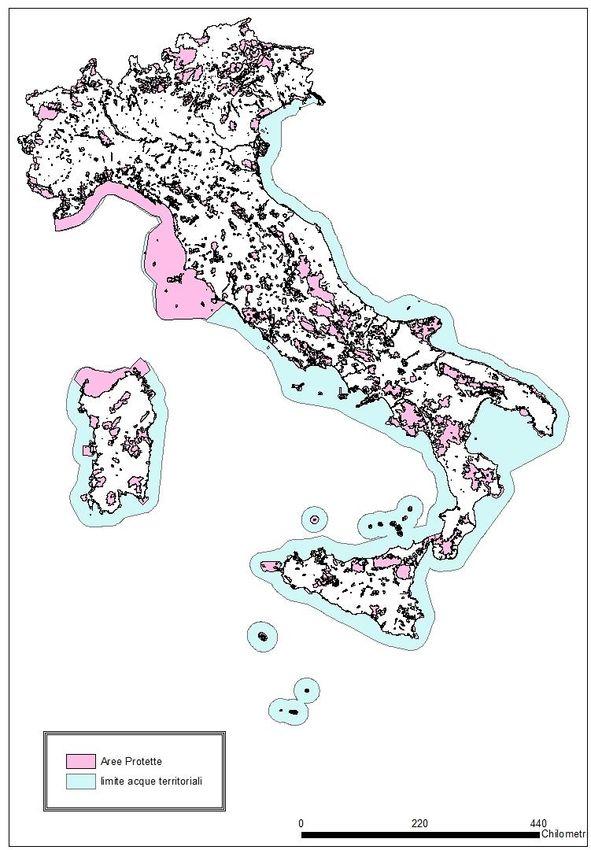
CONTENTS

THE EXECUTIVE SUMMARY ...................................................................................... 7

PART I: AN UPDATE ON BIODIVERSITY STATUS, TRENDS, AND THREATS AND
IMPLICATIONS FOR HUMAN WELL BEING ............................................................... 13

  Q1: WHY IS BIODIVERSITY IMPORTANT FOR YOUR COUNTRY? ............................ 13

  Q2: WHAT MAJOR CHANGES HAVE TAKEN PLACE IN THE STATUS AND TRENDS OF
  BIODIVERSITY IN YOUR COUNTRY? .................................................................... 15

  Q3: WHAT ARE THE MAIN THREATS TO BIODIVERSITY? ...................................... 22

  Q4: WHAT ARE THE IMPACTS OF THE CHANGES IN BIODIVERSITY FOR ECOSYSTEM
  SERVICES AND THE SOCIO-ECONOMIC AND CULTURAL IMPLICATIONS OF THESE
  IMPACTS? .......................................................................................................... 32

PART II: THE NATIONAL BIODIVERSITY STRATEGY AND ACTION PLAN, ITS
IMPLEMENTATION, AND THE MAINSTREAMING OF BIODIVERSITY ........................... 33

  Q5: WHAT ARE THE BIODIVERSITY TARGETS SET BY YOUR COUNTRY? ................ 33

  Q6: HOW HAS YOUR NATIONAL BIODIVERSITY STRATEGY AND ACTION PLAN BEEN
  UPDATED TO INCORPORATE THESE TARGETS AND TO SERVE AS AN EFFECTIVE
  INSTRUMENT TO MAINSTREAM BIODIVERSITY? .................................................. 33

  Q7: WHAT ACTIONS HAS YOUR COUNTRY TAKEN TO IMPLEMENT THE CONVENTION
  SINCE THE FOURTH REPORT AND WHAT HAVE BEEN THE OUTCOMES OF THESE
  ACTIONS?.......................................................................................................... 35

  Q8: HOW EFFECTIVELY HAS BIODIVERSITY BEEN MAINSTREAMED INTO RELEVANT
  SECTORAL AND CROSS-SECTORAL STRATEGIES, PLANS AND PROGRAMMES? ........ 44

  Q9. HOW FULLY HAS YOUR NATIONAL BIODIVERSITY STRATEGY AND ACTION PLAN
  BEEN IMPLEMENTED?......................................................................................... 50

PART III: PROGRESS TOWARDS THE 2020 AICHI BIODIVERSITY TARGETS AND
CONTRIBUTIONS TO THE RELEVANT 2015 TARGETS OF THE MILLENNIUM
DEVELOPMENT GOALS ........................................................................................... 52

  Q10: WHAT PROGRESS HAS BEEN MADE BY YOUR COUNTRY TOWARDS THE
  IMPLEMENTATION OF THE STRATEGIC PLAN FOR BIODIVERSITY 2011-2020 AND ITS
  AICHI BIODIVERSITY TARGETS? ......................................................................... 52

     Strategic Goal A: Address the underlying causes of biodiversity loss by
     mainstreaming biodiversity across government and society. ................................ 53

                                                                                                                      2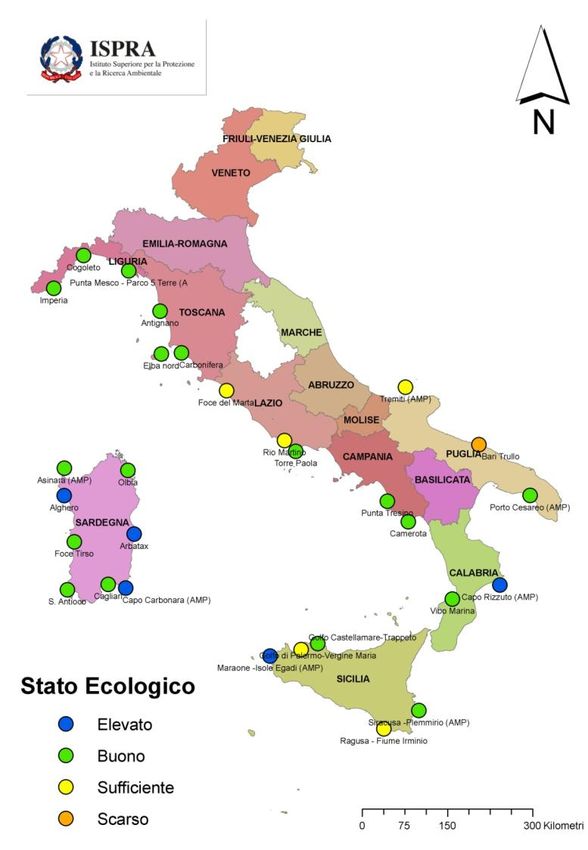
Strategic Goal B: Reduce the direct pressures on biodiversity and promote
      sustainable use ............................................................................................... 55

      Strategic Goal C: To improve the status of biodiversity by safeguarding ecosystems,
      species and genetic diversity ............................................................................ 60

      Strategic Goal D: Enhance the benefits to all from biodiversity and ecosystem
      services .......................................................................................................... 64

      Strategic Goal E: Enhance implementation through participatory planning,
      knowledge management and capacity building .................................................. 65

   Q11: WHAT HAS BEEN THE CONTRIBUTION OF ACTIONS TO IMPLEMENT THE
   CONVENTION TOWARDS THE ACHIEVEMENT OF THE RELEVANT 2015 TARGETS OF
   THE MILLENNIUM DEVELOPMENT GOALS IN YOUR COUNTRY? ............................. 68

   Q12: WHAT LESSONS HAVE BEEN LEARNED FROM THE IMPLEMENTATION OF THE
   CONVENTION IN YOUR COUNTRY?...................................................................... 70

APPENDIX I - INFORMATION CONCERNING THE REPORTING PARTY AND
PREPARATION OF THE FIFTH NATIONAL REPORT.................................................... 72

APPENDIX II - FURTHER SOURCES OF INFORMATION.............................................. 73

ANNEX 1. CORRESPONDANCE AMONG SNB, AICHY TARGETS AND EUROPEAN UNION
BIODIVERSITY STRATEGY...................................................................................... 77

ANNEX 2. INDICATORS USED IN THE FIFTH REPORT ............................................... 80

ANNEX 3. UNESCO: ITALIAN CONTRIBUTION TO THE IMPLEMENTATION OF "AICHI
TARGET"............................................................................................................... 83

LIST OF FIGURES
Figure 1. Variation in forested areas and in forestry coefficient (1985-2013). ............................. 16
Figure 2. Provisional ranking of ecological status for coastal waters in Italy using EQB for
Angiospermae (PREI Index). .......................................................................................................... 17
Figure 3. Percentages of threat categories for Italian vertebrates. .............................................. 18
Figure 4. Species of Flora: status and outlook (from 3rd Report Habitat Directive). ..................... 20
Figure 5. Species of Fauna: status and outlook (from 3rd Report Habitat Directive). ................... 20
Figure 6. Habitat: status and outlook (from 3rd Report Habitat Directive). .................................. 21
Figure 7. Yearly average of new alien species in Italy, from 1990, calculated on 778 species with
proved introduction year (update 2007)....................................................................................... 24
Figure 8. Waterproofed area in coastal belt (10km), data 2009. .................................................. 26

                                                                                                                                      3
Figure 9. Percentage of soil consumed in Italy and by geographical area. ................................... 27
Figure 10. Trend of nutrients per hectare of compostable area. .................................................. 28
Figure 11. Trend in the number of companies and UAA under organic farming. ......................... 29
Figure 12. Eco-efficiency in agriculture, expressed as an integrated index of value added at basic
prices in agriculture, energy use and emissions of pollutants. ..................................................... 30
Figure 13. Trend of harvest timber for building and for fuel. ....................................................... 30
Figure 14. Certified forest areas in Italy according to the schemes PEFC and FSC. ...................... 31
Figure 15. Pillars of NBS................................................................................................................. 33
Figure 16. Structure of the National Biodiversity Strategy. .......................................................... 34
Figure 17. Extension of onshore and offshore system of PAs more Natura 2000 network. ......... 42
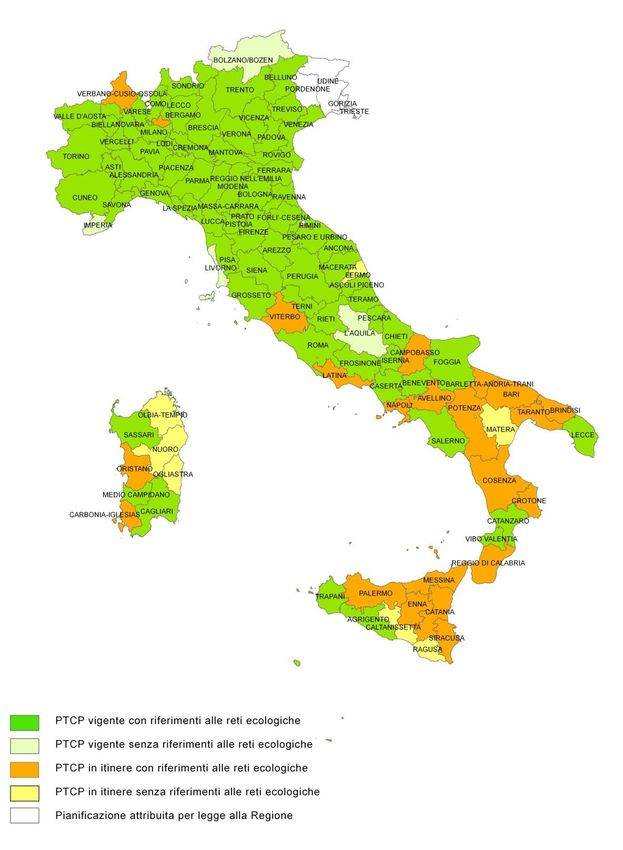
Figure 18. Presence/absence of references to the ecological network in the Provincial Territorial
Coordination Plan (December 2012). ............................................................................................ 45
Figure 19. Implementation of priorities in 15 working areas of NSB: Synthesis of evaluation. WA:
Working area; 1 SH: Species and habitats; 1L Landscape; 2PA: Protected areas; 2N2000: Natura
2000; 3: Genetic resources; 4: Agricolture; 5: Forests; 6: Inland waters; 7: Marine environment;
8: Infrastrucres and transports; 9: Urabn areas; 10: Health; 11: Energy; 12: Tourism; 13:
Research and innovation; 14: Education, communication, public awareness and participation;
15: Italy and biodiversity in the world........................................................................................... 50
Figure 20. UNESCO sites. ............................................................................................................... 88
LIST OF TABLES
Table 1. Employements, direct and indirect, generated by PAs system. Source: Federparchi on
ISTAT data., 2011. .......................................................................................................................... 14
Table 2. Threat categories for Italian Flora (modified from Rossi et al., 2013). ........................... 19
Table 3. Bird population trends comparison in short period (2000-2012) and in long period
(1980-2012). Conservation status: Favourable (increase of more than 10%); stable (variation
between -10% and +10%); bad (decrease of more than 10%; unknown (missing data). ............. 21
Table 4. Main threats for habitat and specie conservation, according to 3rd Report to Habitat
Directive. ....................................................................................................................................... 22
Table 5. Percentage of fires/origin. ............................................................................................... 24
Table 6. Use of plant protection products. ................................................................................... 28
Table 7. Fisheries (source: IREPA – Institute of Economic surveys for fisheries and aquaculture –
MIPAAF – Ministry of Agrculture, Forestry and fisheries)............................................................. 31
Table 8. Information on the Availability of Financial Resources in Italy in 2010 (“Biodiversity
protection” and “Sustainable use and management”). ................................................................ 36
Table 9. International Flows of Financial Resources (2010-2012)................................................. 37
Table 10. Rural Development Program 2007-2013- Axe 2 “Environment”: State of progress for
measure of public expenditure and comparison with total RDP. Update at 31-12-13. ................ 38
4
Table 11. Italian LIFE+ projects (2007-2013). ................................................................................ 39
Table 12. Summary of National system of protected areas at land and sea. ............................... 40
Table 13. Natura 2000 network (SCIs/SACs and SPAs). ................................................................. 40
Table 14. Wetlands of International imposrtance (Ramsar Convention). .................................... 41
Table 15. PAs system with Natura 2000 addition: land and sea coverage/total land and national
territorial waters. .......................................................................................................................... 41
Table 16. Web pages related to the activities of the Regions and Autonomous Provinces. ........ 74
Table 17. Correspondence between Main targets in NBS, those included in Strategic Plan CBD
(CBD SP) and those included in the European Union Biodiversity Targets (EU BS). T: target; A:
Action. ........................................................................................................................................... 77
Table 18. Synopsis of the indicators used in the V Report. ........................................................... 80
Table 19. From: “Box 1: Contributions of UN Agencies and Conventions to the Aichi targets” – in
bold areas UNESCO. ...................................................................................................................... 83
Table 20. Variation 2009-2013: ha in Italy recognized by UNESCO. ............................................. 87

LIST OF BOXES
Box 1. Conservation of brown bear (Ursus arctos) ....................................................................... 21
Box 2. LIFE Programme in Italy ...................................................................................................... 39
Box 3. National Parks: form natural assets to environmental accountability. .............................. 43
Box 4. Global Strategy for Plant Conservation (2011-2020) ......................................................... 47
Box 5. Communal green ................................................................................................................ 48

                                                                                                                                                    5
ACRONYMS
CT: Consultation Table

DPNM: Nature Protection Directorate

EEA: Environmental Effects Assessment

EIA: Environmental Impact Assessment

EU: European Union

FLEGT: Forest Law Enforcement, Governance and Trade

ISPRA: National Institute for Environmental Protection and Research

MATTM: Ministry for the Environment Land and Sea

NBC: National Biodiversity Committee

NBO: National Biodiversity Observatory

NBS: National Biodiversity Strategy

PAs: Protected Areas

PCTP: Provincial Coordination Territorial Plan

SACs: Special Areas of Conservation

SCIs: Sites of Community Importance

SEA: Strategic Environmental Assessment

SPAs: Special Protection Areas

                                                                      6
THE EXECUTIVE SUMMARY
The period covered by the fifth report CBD (2009-2013) is particularly rich and
meaningful to the definition of new objectives and actions that are projected from the
global level to the regional (EU) and national levels.
In fact, in 2010, “International Year of Biodiversity”, was adopted by the COP X the
Strategic Plan 2011-2020 with the 20 Aichi Targets and the Nagoya Protocol on Access
to Genetic Resources and the Fair and Equitable Sharing of Benefits Arising from Their
Utilization.
Italy has faced this time of change with great commitment and consistent with
international processes, approving the National Biodiversity Strategy 2011-2020 (NBS)
result of a shared and participated process.

Importance of biodiversity
Italy is probably the most bio diverse country in Europe. On all species in Europe, about
30% of animal and 50% of plants are present in Italy, on a surface that just represent
1/30 of the whole continent.
Taking into account that Italy has a highly human modified territory, biodiversity and the
ecosystem services it provides are at the same time threatened by human activities and
represent a great resource for human activities and wellbeing.

Key changes in the status and trends of biodiversity
Both red lists either assessments of conservation status of species and habitats
protected under European Union Directives show a complex picture with many species
and habitats at risk, but also positive or improved situations.

    100%     5%       9%                                       10%     12%
     90%                              16%
             18%                              23%
                     15%
     80%                              10%                              16%
                                               6%              28%
     70%
     60%     33%     32%                                                        Unknown
                                      40%                              41%
     50%                                      41%                               Bad
     40%                                                       40%
                                                                                Inadequate
     30%                                                                        Favourable
     20%     44%     44%
                                      34%     30%                      31%
     10%                                                       22%
      0%
            Fauna Outlook             Flora Outlook          Habitat Outlook
             2012 fauna               2012   flora            2012 habitat

                                                 rd
  Species and habitats: status and outlook (from 3 Report Habitat Directive).

                                                                                             7
Data also show the central role of the protected area system in conserving biodiversity,
covering more than 21% of the Italian territory and more than 19% of territorial waters.

The protected territory (national system of protected areas, Natura 2000 Network sites,
Ramsar sites) showed a slight increase, and is higher than requested by the Aichy Target
11.

   PAs system with Natura 2000 addition: land and sea coverage/total land and national territorial
   waters.

                                                                           ha        %
             Italy’s land surface                                        30130244   100,0
             Surface of Land Protected Area                              6523072     21,6
             Italy’s territorial waters surface                          15436412   100,0
             Surface of territorial waters included in protected areas   2951271     19,1

Main direct and indirect threats to biodiversity and ecosystems
In analyzing indicators and outcome of the 3rd Report for Habitat Directive, anthropic
threats are stable in number and trends, and they are expected to stand in a short and
medium term.
Impacts are mainly generated by ecosystem changes due to humane activities (pollution
of surface runoff, habitat fragmentation, use of biocides hormones and chemical
products), together with forestry and agriculture not properly managed, abandonment
of pastoral activities, leading to reduction of semi-natural habitats, to urbanizations and
anthropic disturbance. Anthropic disturbance is the main threat to habitats of Union
interest, together with the building of infrastructures, alien species and change in
ecosystems; moreover intentional fires have high impact on some habitats.
For marine species, fisheries rank first among threats, followed by pollution, anthropic
disturbance and change of ecosystems. For marine habitats the impact of pollution rank
first, followed by change in ecosystems, anthropic disturbance, fisheries, transport and
change in coastal and littoral habitats.
Introduction of invasive alien species should also be considered, being responsible for
local extinction, in particular for fish and decapods, and being a potential major threat in
a near future.

National Biodiversity Strategy
Italy adopted on October 2010 the National Biodiversity Strategy (NBS), as a reference
document in order to stick to commitments accepted with the ratification of the
Convention on Biological Diversity.
NBS aims to merge and integrate biodiversity conservation targets and sustainable use
of natural resources within sectorial policies, and as a consequence the implementation

                                                                                                     8
of the vision of the Strategy itself: “Biodiversity and ecosystem services, our natural
capital, are valued, preserved and where possible restored, for their intrinsic value and
in order to underpin economic prosperity and humane well-being in spite of deep
changes occurring at local and global level”.
In order to implement it, Strategy has been organized in three main pillars, linked
likewise with strategic targets.

         Biodiversity and       Biodiversity and climate          Biodiversity and
        ecosystem services              change                   economic policies
    •STRATEGIC TARGET;          •STRATEGIC TARGET:           •STRATEGIC TARGET:
     within 2020 guarantee       within 2020 substancially    within 2020 integrate
     biodiversity                reduce in Italy climate      biodiversity conservation
     conservation, as variety    change impact on             in sectorial economic
     of live organisms, their    biodiversity, settling       policies, also to bust new
     genetic variability and     suited measure to adapt      jobs and social cohesion,
     ecosystems to which         to changes and to            reinforcing
     they belong, and to         mitigate their effects,      comprehension of
     secure protection and       enhancing resilience of      assetts of ecosystem
     restoration of ecosystem    natural and semi-natural     services, and awareness
     services in order to        ecosystems.                  of economic loss when
     guarantee key roles for                                  damaged.
     life on Earth and ofr
     humane well-being

Pillars of NBS.

In order to reach this targets, 15 working areas have been identified: 1. Species, habitat
and landscape; 2. Protected areas; 3. Genetic resources; 4. Agriculture; 5. Forests; 6.
Inland water; 7. Marine environment; 8. Infrastructures and transportation; 9. Urban
areas; 10. Health; 11. Energy; 12. Tourism; 13. Research and innovation; 14. Education,
information, communication and participation; 15. Italy and global biodiversity.
Threats, main targets to tackle and intervention priorities are indentified within all
working areas.
NBS implementation is in line with EU policies dealing with biodiversity, and with
European Union Biodiversity Strategy, whose targets are also consistent with Aichi
Biodiversity targets. Hence a good match between the three strategies.
The governance of the Strategy is guaranteed by a Committee composed of
representatives of all Ministries and Regions, supported by an Observatory of technical-
scientific experts and a Consultation Table with all the stakeholders.
The Strategy covers the period from 2011 to 2020. In 2015, there will be a in-depth
assessment and review of the Strategy.

                                                                                           9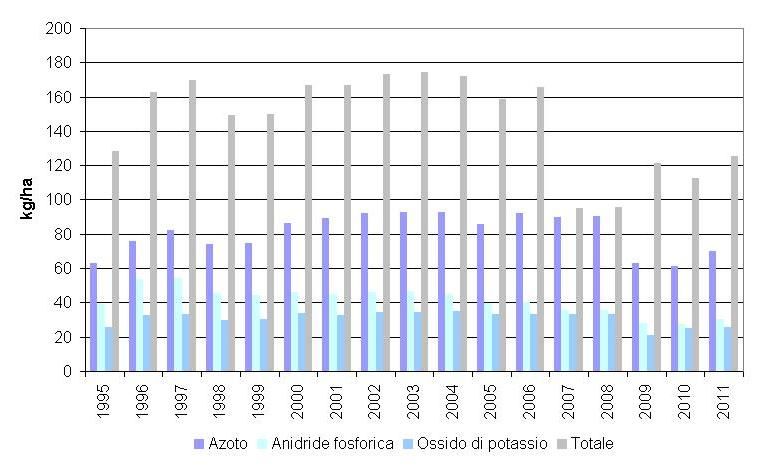
A report on the implementation of the strategy will be issued every two years; analyzing
the progress towards the achievement of strategic objectives and specific goals in all
work areas.
In the First Report, regarding the period 2011-2012, the main actions, results and
assessment of SNB implementation were described.
There is good perception of the impact of human activities on biodiversity and the
ecosystem services it delivers, on the other hand there is increasing awareness
regarding the importance and value of biodiversity, and the strategic need to preserve
it, see for example the theme of Expo 2015, “Feeding the planet, energy for life”.
This resulted in the decision to act in synergy between the various sectorial policies to
ensure that the natural capital is preserved and used in a sustainable manner to
contribute to human welfare.
The flexibility of NBS, and the assessment of the first two years of activity (2011-2012),
has allowed to identify critical issues to overcome and to enlarge the number of
involved parties.
The institutions are activating positive partnerships with social partners, enterprises,
universities and research institutes, with the aim to build on the positive experiences of
protected areas and the opportunities of the Green Economy.
A contribution to this came also by the National Conference on "The Nature of Italy.
Biodiversity and Protected Areas Green Economy for the revival of the country" held in
Rome in December 2013. The Conference and the preparatory workshops and activities
focused on:
       Protected Areas and Natura 2000 network as a means to combine conservation
       and economic development.
       The scientific research for the conservation and enhancement of natural capital.
       Green jobs, youth employment and new entrepreneurship: the role of training in
       developing innovative skills in support of the green economy and development
       of territories.
       The green infrastructure and ecosystem services in Italy as a tool for
       environmental policies and green economy: potential, problems and proposals.

Implementation of National Biodiversity Strategy and progress towards Aichy
target
A global picture on implementing status of National Biodiversity Strategy turns out
mainly from the First Report for period 2011-2012.
In Figure below a synthesis on implementing status of National Strategy is recorded.
Concerning 15 working areas implementing status has been ranked going from green to
red.

                                                                                       10
implemented in progress started not evalued not yet started
100%
90%
80%
70%
60%
50%
40%
30%
20%
10%
0%
Implementation of priorities in 15 working areas of NSB: Synthesis of evaluation. WA: Working area; 1
SH: Species and habitats; 1L Landscape; 2PA: Protected areas; 2N2000: Natura 2000; 3: Genetic
resources; 4: Agriculture; 5: Forests; 6: Inland waters; 7: Marine environment; 8: Infrastructures and
transports; 9: Urban areas; 10: Health; 11: Energy; 12: Tourism; 13: Research and innovation; 14:
Education, communication, public awareness and participation; 15: Italy and biodiversity in the world.
The analysis of results shows that biodiversity conservation needs to be further
integrated into sectorial policies. To date there are several guidelines but to obtain
concrete conservation results these should be translated into policy actions. Indeed
several local experiences have been successfully completed.
Hence the need to strengthen information swap and increase efforts in defining
systemic actions that would allow to have more efficient, consistent and coordinated
guidelines and implementation performed by Central Administration, Regions and local
Administrations.
In this framework Italy is strongly committed to the implementation of the Strategic
Plan and is making significant progress to achieve all Aichi targets, with encouraging
results as:
Interministerial activity for national strategy for resource mobilization for
biodiversity.
Protected areas system is actually really wide-ranging. For the time being our
engagement is directed in increase managing efficiency, with the aim to
maximize biodiversity conservation, including ecosystem services.
Create operational databases and dedicated portals; these are tools that make
possible to steer policies, provide up to date figures in environmental
assessment procedures, enhance and spread knowledge, and increase level of
awareness on biodiversity. In this respect the portal Naturaitalia is identified as
11National biodiversity Clearing House Mechanism that will play a pivotal role in
the exchange of information among different sectors that contribute to the
conservation and sustainable use of biodiversity in Italy.
A significant contribution to mainstreaming comes from the governance system
of the National Strategy for Biodiversity, that aims to enhance cross-cutting
approach, widening opportunities and procedures of spreading and
communicating about significant initiatives on-going in our country.
12PART I: AN UPDATE ON BIODIVERSITY STATUS, TRENDS,
AND THREATS AND IMPLICATIONS FOR HUMAN WELL BEING
Q1: WHY IS BIODIVERSITY IMPORTANT FOR YOUR COUNTRY?
Italy is probably the most bio diverse country in Europe. This condition is mainly due to
geography, morphology and pedology, with a territory spanning from Alps and boreo-
alpine environment, to temperate woodland, to Mediterranean scrubs, and to extreme
and sub-desert condition in some of southern archipelagos. History has also shaped
environment, and numbers of endemics is relevant. Moreover Italy is the core of the
Mediterranean Basin, one of world’s 33 biodiversity hotspot.
On all species in Europe, about 30% of animal and 50% of plants are present in Italy, on
a surface that just represent 1/30 of the whole continent.
Taking into account that Italy has a highly modified territory, biodiversity and ecosystem
services provided by it are both threatened by human activities and represent the added
value of such activities.
Protected Areas
In Italy, the system of Protected Areas (Pas) now covers 1,748 municipalities (22% of
Italian municipalities) of which 68% with less than 5,000 inhabitants; 283 mountain
communities (79% of the total); 98 provinces (95% of the total) and all regions. The only
national parks involving 462 municipalities, 82 mountain communities, 39 provinces and
18 regions.
The Italian experience has innovative features as regards its ability to meet the parks
with the territorial specificities and for this to become the tools of conservation parks
and at the same time local development.
Pas, either at national and regional level, play a pivotal role in protecting precious
environment and species, but also in raise awareness among people, creating direct and
indirect employment (Table 1).
PAs are now being visited for leisure and/or for specific interests by an increasing
number of people. In this respect dedicated initiatives conducted by public schools
together with those managing protected areas have produced synergies that allow new
generations to become familiar with concepts as biodiversity, endangered species,
ecosystem balance, etc. It is worth to note that recent economic crisis has impacted less
on tourism in PAs than in other place devoted to tourism.
13Table 1. Employements, direct and indirect, generated by PAs system. Source: Federparchi on ISTAT
data., 2011.
Direct employment: PAs employed
Employed
Local Administrations (Regional PAs) 6.143
National Parks 756
Surveillance in national parks (State Forestry Corps) 828
Total employed 7727
Closely linked employments Employed
Services: employed in 1,242 companies providing services in environment, culture
5.874
and tradition in Communes included in National Parks (2950 Communes)
Tourism: employed in 17,411 accommodation facilities and in 7,720 catering
48.912
facilities in PAs
Agriculture and trade in PAs (953 companies and farms to produce and trade
2766
agricultural products produced in PAs):
Total employed 57.552
Wider linked employements
Employed
Employed outside PAs with clear linkage to products and services within PAs 16350
General total 81629
Green economy
Occupation and new jobs are increasingly becoming relevant, not only in agriculture,
fisheries, forestry, and nature tourism, but also in fields like production of energy
generated by alternative sources.
To date in whole Italian economy (both public and private), “green” employed – or so
called green jobs – are more than 3 million. Beside other 3 million and 700000 are those
triggered by green economy. Without considering agriculture, 328,000 companies in
Italy, with more than one employed, will invest in 2014 in green technologies in order to
save energy and to mitigate environmental impacts, representing about 22% of national
companies. This should generate 38% of new jobs anticipated (216,500 on a total of
563,400)(Fondazione Symbola - Unioncamere, 2013).
Agriculture
Another peculiarity of Italy is found in its food culture and legacies; in this respect more
and more people is involved in agricultural and farming activities where old and
14traditional plant and animal varieties, kicked out from the productive system in recent
years, have been “rescued” from the oblivion. New ways to produce food is now
furthering the sustainability of the production itself, dimming the impact on the
environment, supplying better quality food, and last but not least, improving life
condition for farmed animals. Furthermore traditional agriculture and farming activities
normally avoid to use large areas for monoculture, differentiate plants and land use,
allowing the persistence of marginal areas and ecotones, enhancing preservation of
biodiversity, and providing necessary connection between areas serving as dispersal
corridors. The use of pesticides tends to be reduced, and the promotion of local market
at 0km favors the consumption of local and seasonal food, limiting the use of fossil fuels
for distribution and energy use for greenhouses.
The World Expo "Feeding the Planet, Energy for Life", to be held in Milan in 2015, has as
its main theme the sustainable agricultural production and the particularity of local
production, with the aim of promoting a different way of producing and consuming
food.
Q2: WHAT MAJOR CHANGES HAVE TAKEN PLACE IN THE STATUS AND
TRENDS OF BIODIVERSITY IN YOUR COUNTRY?
To secure consistency with IV CBD Report, analysis of status and trends of biodiversity,
and related threats, has been conducted using the same indicators set, and adding state
indicators of National Biodiversity Strategy (NBS) (see Part II), partially overlapping
(Table 18).
The Table 18 shows a snapshot of the parameters measured by various indicators in the
period between the fourth and fifth Report. In the case of the NBS status indicators that
do not correspond with those used for the Fourth Report the trend may also refer to a
longer period.
Concerning Natura 2000, results contained in 3rd Report have been used (drafted
according to art. 17 in Habitat Directive for period 2007-2013
(http://cdr.eionet.europa.eu/it/eu/art17/envupyjhw) and Report drafted according to
art. 12 in Birds Directive, for period 2008-2013
(http://cdr.eionet.europa.eu/it/eu/art12/envurl48a).
Both updating of red lists either assessments of conservation status of species and
habitats in 3rd Report show a complex picture with many species and habitats at risk,
but also positive or improved situations (Figure 3, Figure 4, Figure 5, Figure 6).
Data also show the pivotal role of Protected Areas system in biodiversity conservation,
including about 70% of land of Ecological Value medium, high or very high. Altogether
protected areas at various levels are slightly increasing, at an higher level of what
required in Aichi Target 11 (including National Protected Areas, Ramsar sites and Natura
200 sites).
A synthetic description for used indicators is reported below.
15Forested areas: status and trends
Italian forested area went till now through a gradual and constant increase, spanning
from 8,765,000 ha in 1985 to 10,987,805 ha in 2013, with an increase of 26.7%. This has
been confirmed in recent years (Figure 1), and is partially linked to forestation activities,
and in more importantly to natural forest colonization of abandoned agricultural land in
hilly and mountainous areas.
11.000.000 40
10.000.000
35
9.000.000
8.000.000 30
7.000.000 25
6.000.000
20
5.000.000
4.000.000 15
3.000.000 10
2.000.000
5
1.000.000
0 0
ha 1985 1990 2000 2005 2010 2013
%
Superficie forestale Coefficiente di boscosità
Figure 1. Variation in forested areas and in forestry coefficient (1985-2013).
Ecological value of the territory according to “Carta della Natura”
“Ecological value” is an indicator worked out within “Carta della Natura” at 1:50,000
scale. In ten Regions surveyed for the time being the “Ecological Value” is medium, high
or very high in Natural Protected Areas system, with a surface totaling about 70%.
On the contrary surveys on Ecological Value distribution outside PAs show that parcels
at medium high or very high Ecologcial Value vary from low percentages (for Lazio,
Molise,Puglia, Veneto) to medium (around 50% in Friuli Venezia Giulia, Sardegna and
Valle d’Aosta). An analysis of these data can pride useful advice in order to reconsider
already existing PAs and eventually to pinpoint new ones.
PREI (Posidonia Rapid Easy Index) – CW
The PREI is a multimetric index based on univariate statistics. It is based on five different
describers of Posidonia oceanica beds surveyed: density of beds, leaves surface/stem;
epiphytic biomass and leaves biomass ratio, the depth of the lower limit and the type of
the limit.
16From the extent of deviation from a given baseline (Environmemtal Qaulity Ratio, EQR)
PREI index bring back information in “ecological status” of water body, and the inclusion
in one the 5 status categories: “high”, “good”, “average”, “insufficient”, “bad”.
In Figure 2 the ecological status of Italian coastal waters has been represented. Major
values of EQR, for high Ecological status, has been mostly detected in Marine Protected
Areas, or in area with a low humane activities, as coastal areas in Sardinia.
Figure 2. Provisional ranking of ecological status for coastal waters in Italy
using EQB for Angiospermae (PREI Index).
Size and level of threat of animal species
Italian fauna comprises more than 58,000 species, with about 55,000 invertebrates and
1,812 Protozoa (98% of species), and 1,258 Vertebrates species (2%). Recent studies on
certain groups of insects, suggest that the number of animal species that are part of the
17Italian fauna should be increased by at least 15%, bringing the number of species
reported in Italy to more than 65,000.
ISPRA Database on Ungulates show a positive trend for many species, with Abbruzzi’s
chamois increasing by 72,3% between 2000 and 2005.
Among 672 vertebrates species, assessed in recent “IUCN Red List of Italian
Vertebrates” (Rondinini et al., 2013), of 576 terrestrial species and 96 marine species, 6
result extinct in recent times. It has been calculated that about 31% of Italian
vertebrates is threatened, with about 50% of least concern (Figure 3).
Recently extinct Critically endangered Endangered Vulnerable
Near threatened Least concern Data deficient
Mammalia
Aves (only breeding)
Reptilia
Amphibia
Osteichthyes (only freshwater)
Agnatha
Chondrichthyes
0% 10% 20% 30% 40% 50% 60% 70% 80% 90% 100%
Figure 3. Percentages of threat categories for Italian vertebrates.
Size and level of threat of plant species
Bryological flora in Italy are among the richest in species in Europe with 1,156 species of
which 292 liverworths and 864 mosses. Furthermore Italy, with 2,328 taxa surveyed,
may be included among the European countries with highest lichen diversity. Vascular
plants numbers 6,711 species, with 144 Pteridophyta, 39 species of Gymnosperms and
6,528 Angiospermes.
Overall 42% of “policy species” (IUCN Red List of Italian Flora. Policy and other
threatened species) (protected according to Bern Convention and Habitat Directive) are
threatened at various level, more or less in line with what is reported on the Red List of
the Vascular Plants of the European Union of 27 Member States (Bilz et al. 2011); while
for 24% data are insufficient to make a proper assessment (comprising mostly mosses)
(Rossi et al., 2013.).
18Table 2. Threat categories for Italian Flora (modified from Rossi et al., 2013).
Categoria Red List IUCN Vascular plants Briophytes Lichens Fungi
Estinta (EX) 2 0 0 0
Estinta a livello regionale (RE) 1 0 0 0
Estinta in natura (EW) 1 0 0 0
Probabilmente estinta CR (PE) 11 4 0 0
Probabilmente estinta in natura CR
1 0 0 0
(PEW)
Gravemente minacciata (CR) 96 10 4 3
Minacciata (EN) 76 11 8 5
Vulnerabile (VU) 22 0 7 2
Quasi a rischio (NT) 31 3 0 1
A minor Rischio (LC) 40 0 4 0
Dati insufficienti (DD) 16 33 2 2
Totale 297 61 25 13
Natura 2000: results of reporting activities
3rd National Report (Genovesi et al., 2014), drafted according to art.17 of Habitat
Directive, which refers to years 2007-2012, has been realized with a collaboration
between Ministry of the Environment, Regions and Autonomous Provinces, ISPRA,
Scientific and Academic Organizations, and single experts.
This is the base for un updated and robust knowledge, useful to direct and orient
management, and to prioritize more urgent conservation measures.
In 3rd Report 113 plant species, 225 animal species and 132 habitats have been
reported, totaling 802 synthetic sheets for three terrestrial biogeographical regions and
for marine region. Results depict lights and shadows.
Conservation status seems bad for about 50% of species of European Union (EU)
interest, and for more than half of habitats (68%). This percentage are mirrored in
future perspectives for their conservation (Figure 4, Figure 5,Figure 6).
Most critical conditions for plant species (number of taxa in unfavorable conditions) are
in Mediterranean Biogeographic Region; 14 species are in a bad conservation status (7
in the Mediterranean region, 5 in Continental Region and 1 in Alpine region); moreover
one species (Marsilea quadrifolia) is sharply declining either in the Mediterranean and
Continental Regions.
19100%
90% 16%
23%
80% 10%
6%
70%
60% Unknown
40% Bad
50% 41%
40% Inadequate
Favourable
30%
20%
34% 30%
10%
0%
Flora 2012 Outlook flora
rd
Figure 4. Species of Flora: status and outlook (from 3 Report Habitat Directive).
Even conservation status of animal species (except Birds) of EU interest shows
significant problems; 18% is in a bad conservation status, and 15% has a negative
outlook (Figure 5).
100% 5% 9%
90%
18% 15%
80%
70%
60% 33% 32% Unknown
50% Bad
40% Inadequate
Favourable
30%
20% 44% 44%
10%
0%
Fauna 2012 Outlook fauna
rd
Figure 5. Species of Fauna: status and outlook (from 3 Report Habitat Directive).
Concerning habitats, overall picture rank 27% in bad conservation status and 40% with
an inadequate conservation status (Figure 6).
20100%
10% 12%
90%
80% 16%
28%
70%
60% Unknown
50% 41% Bad
40% 40% Inadequate
Favourable
30%
20%
31%
10% 22%
0%
Habitat 2012 Outlook habitat
rd
Figure 6. Habitat: status and outlook (from 3 Report Habitat Directive).
Future perspectives for species and habitats, that actually match with overall
conservation status, are linked to persistence of threats and humane pressure on the
environment.
Concerning bird species, Table 3 shows the data that emerge from the last Report
prepared according to article 12 of the Birds Directive. It is worthy to underline that this
is the first report produced throughout Europe with criteria similar to those used in the
Habitat Directive.
Table 3. Bird population trends comparison in short period (2000-2012) and in long period (1980-2012).
Conservation status: Favourable (increase of more than 10%); stable (variation between -10% and +10%); bad
(decrease of more than 10%; unknown (missing data).
Favourable Stable Bad Unknown
Birds species 2000-2012 23% 26% 18% 33%
Birds species 1980-2012 25% 22% 16% 37%
Box 1. Conservation of brown bear (Ursus arctos)
Among threatened species, brown bear in certainly one of the flag species, and indeed an
umbrella species, as its conservation cannot be considered without granting to a large part of
territory a special regime of protection. Italy hosts two distinct population on Apennines and on
Alps, each counting approximately 50 specimens (http://www.minambiente.it/pagina/orso-
bruno).
In Central Apennines situation is very critical, as population is not increasing despite all efforts
and action undertaken to favor it. An exceptional and active initiative involving central and local
21authorities and management of PAs is trying to achieve the result and to reduce level of
mortality.
On Alps, where brown bear was on the verge of extinction, a reintroduction initiative has been
undertaken starting in 1999 with a Life project, with 10 specimens originating in Slovenia being
released in the wild in Trentino (http://www.orso.provincia.tn.it/index.php?lang=2).
Following a strong commitment by all Administration and stakeholders, together with a careful
consideration of humane-bear conflict, brow bear’s population is on constant increase, and
widening area of distribution. Even considering the increase in conflicts certainly difficult to
manage, their reintroduction project can be considered a success for conservation, bringing
back a species absent since centuries.
Q3: WHAT ARE THE MAIN THREATS TO BIODIVERSITY?
In analyzing indicators and outcome of the 3rd Report for Habitat Directive, anthropic
threats are stable in number and trends, and they are expected to stand in a short and
medium term (Figure 4, Figure 5, Figure 6).
In Table 4 main threat categories for animal and plant species have been listed and
categorized according to their occurrence in reporting data-sheet.
rd
Table 4. Main threats for habitat and specie conservation, according to 3 Report to Habitat Directive.
Threats Number of occurrence
Fauna Change in ecosystem 638
Agriculture 372
Forestry 214
Urbanization 179
Anthropic disturbance 164
Flora Change in ecosystem 95
Agriculture 92
Natural processes 87
Anthropic disturbance 76
Hunting, fishing, plant harvest 60
Habitat Anthopic disturbance 258
Transports 243
Change in ecosystems 231
Forestry 189
Urbanization 179
22In particular impacts are generated by changes in ecosystem from humane activities
(pollution of surface runoff, habitat fragmentation, use of biocides hormones and
chemical products), together with forestry and agriculture not properly managed,
abandonment of pastoral activities, leading to reduction of semi-natural habitats, to
urbanizations and anthropic disturbance. Anthropic disturbace is the main threat to
habitats of Union interest, together with the building of infrastructures, cultivation of
alien species and change in ecosystems; moreover intentional fires are one of other
important threat for conservation of some habitats.
For plant species (and at a less important scale for animal species) direct harvest,
despite national and local rules, is still an important threat to conservation.
For marine species, analysis provided in the 3rd Report pointed out that fisheries
mortality rank first among threats, followed by pollution, anthropic disturbance and
change of ecosystems. For marine habitats pollution rank first, followed by change in
ecosystems, while anthropic disturbance, fisheries mortality, transport and change in
coastal and littoral habitats having the same impact.
Introduction of invasive alien species should also be considered, being responsible for
local extinction, in particular for fish and decapods, and being a potential major threat in
a near future.
Here below a brief description of indicators used is reported.
Spreading of alien animal and plant species
Number of alien species in Italy is constantly growing (Figure 7). Available data show
that alien species introduced from 1500 are 2,029. On 778 species for which
introduction year is known, more important are vascular plants with 13.4% and
vertebrates. For this group freshwater fish rank first, followed by Reptiles 11.9%,
Mammals 10.6%, Amphibians 9.5% and Birds 9%.
This data are certainly underestimated, lacking an adequate survey activity and late
inclusion in the list. Beyond this, species alien for a part of Italy but belonging to another
part, have not been included.
Alien insect species number 700 as of 2007 (Zapparoli M., 2007). Terrestrial
invertebrates, according to official and grey literature, number more than 1,200 alien
species in Italy.
For freshwater fauna, the update in 2007 counts 112 alien species, among those 64
invertebrates and 48 vertebrates (Gherardi et al., 2008.).
According to (Occhipinti et al., 2010.), 165 alien species in marine habitat have been
detected between 1945 and 2009 mostly in North Adriatic Sea and Venice Lagoon.
23Figure 7. Yearly average of new alien species in Italy, from 1990, calculated
on 778 species with proved introduction year (update 2007).
Forest fires
Overall data analysis show a dwindling trend of phenomenum, with peak and mild
years. Anyhow a critical period in mid ’80 has been noted, with following years always at
high level of fires, and then with a progressive diminution till 2006, a sharp rise in 2007,
again a decrease in 2008 – 2010 period (46.537 ha), and 2011 (72.007 ha) and new
increase in 2012 (130.799 ha).
Most of fires have been confirmed as intentional (Table 5), emphasizing the need of
more stringent and effective prevention tools, and certainty of conviction and penalties.
Table 5. Percentage of fires/origin.
Natural Accidental Negligent Arson Not defined
Anno
%
2000 0,9 0,5 11,8 57,7 29,1
2008 0,7 0,9 22,2 65,2 11
2009 1 0,8 17,4 67,2 13,6
2010 1 0,6 19,6 67,9 10,9
2011 0,2 0,2 13,7 71,9 14
24Water erosion
Different areas of the country are subject to loss of soil due to water erosion, with
relevant economic loss in a hilly areas where valuable agricultural activities are in place.
It is not actually possible to define trends, but a constant increase of woodland in
respect of agricultural land, will make possible a diminution in mountain areas. On the
contrary, increase in use of mechanical means to cultivate hilly areas may foresee an
increase of phenomenon, also taking into account an increase strength of rains in later
years. Fires in forested areas make the situation even more critical.
The first data on the effectiveness of agri-environmental measures introduced by the
new Common Agricultural Policy (CAP) and set out in the National Strategic Plan for
Rural Development, showed a significant reduction of erosion as a result of their
application.
Urbanization in coastal areas
This indicator provides a picture of the percentage of waterproofing of coastal areas in
2006 and in 2009. Waterproofing in the area within 10km from the shoreline is
increasing at a faster rate than at national level. The soil sealing span from 5.3% in 2006
to 5.7 in 2009 in coastal areas, with an increase of 0.4%, while at national basis in the
same period percentage increase from 2.8% to 3.0%. In Figure 8 waterproofed areas in
costal belt are represented for 2009. More important rates are noted in Liguria,
northern Tuscany, in Provinces of Rome and Latina, in Campania and Sicily, in Bari,
Taranto and in Adriatic coast from Pescara to Ravenna.
25Figure 8. Waterproofed area in coastal belt (10km), data 2009.
Waterproofing and consumption of soil
Data show a continuous increase in consumption of soil, and the importance of
progressive decrease in land assets, especially in metropolitan areas, where percentage
of land surface covered is higher, and in suburban areas where land id used to built
industrial, commercial and transport facilities.
Even the main roads are subject to rapid urbanization and vast agricultural areas are
being invaded with vacation houses, shopping centres, industrial hovels, also in areas at
high idro-geological risk. Change in land use for humane activities but agriculture is
more intense and important in Northern Italy, with the rest of the country showing
26lower percentages (Figure 9). Indicator underlines anyhow a continuous increase in land
coverage since the end of Second World War.
Figure 9. Percentage of soil consumed in Italy and by geographical area.
Land use
(updated to 2006 as in IV Report)
Farms and Utilized Agricultural Area (UAA)
Italian farms and animal husbandries are 1,620,884 and relate to 12,856,048 ha of UAA.
With respect to year 2000 an overall decrease of 775,390 farms has been noted (-
32.4%). National UAA slightly decreased with respect to 2010 (-2.5%). Note that
decrease in numbers of farms did not correspond to decrease in SAU.
Agricultural use of fertilizers (fertilizers, amenders, correctives)
Analyzing trend in period 2000 – 2011 a general decrease is showed, with different
trend for various substances, with a sharp increase in organic components as part of
organic fertilizers and in organomineral fertilizers (Figure 10).
27Figure 10. Trend of nutrients per hectare of compostable area.
Agricultural use of plant protection products (herbicides, fungicides, insecticides,
acaricidal, and various)
In period 2001-2011, an overall decrease in use of chemical substances has been noted
(-7.4%), with patterned and irregular trend for various categories (Table 6). Products
allowed in organic farming grew sharply both in percentage and in quantities, with a
total amount close to 385t. Herbicides show a negative but dwindling trend. Fungicides
show a light decrease in last two years. This trend mirrors new technical and agricultural
options, but also new commercial strategies adopted by productive factories.
Table 6. Use of plant protection products.
CATEGORIE 2001 2009 2010 2011
Fungicides 76.629.871 75.147.425 67.707.464 69.891.334
Insecticides, 34.022.720 27.541.774 28.160.013 27.571.407
acaricidal
Herbicides 26.672.643 25.679.730 28.128.764 24.086.210
Various 10.337.279 20.694.291 19.911.550 20.876.075
Organic 108.894 410.584 - -
TOTALI 147.771.407 147.473.784 143.907.791 142.425.026
Farms that have joined ecological approach and practicing organic farming
Italian organic agriculture is growing since the 90’ at a level significantly more important
than in other EU countries, both in agricultural surface than in number of employed.
This positive trend however reversed in period 2002-2004 with a reduction of both
indicators. After 2005 a new increase was boosted with the approval of new rural plans
28that in many Regions have been oriented towards organic productions. Surface
converted to organic production in 2011 totaled 1,089,889 ha, with a decrease of 1.5%
in respect of 2010. Organic production stand for 8.5% of national UAA. Trend seem
therefore rather stable.
Figure 11. Trend in the number of companies and UAA under organic farming.
Eco-efficiency in agriculture
Evolution of variables witnesses an enhancement of eco-efficiency in Italian agriculture
in the period 2005-2010.
This is evident considering the slight recovery of the economic variable, represented by
the value added at basic prices, accompanied by the decline of most of the pressure
(Figure 12). Actual situation is therefore neatly improving with reference to recent
years, even if energy’s utilization show discrepancy between the economic growth and
decrease of large part of pressures that seems to be insignificant.
29Figure 12. Eco-efficiency in agriculture, expressed as an integrated index of value added at basic prices
in agriculture, energy use and emissions of pollutants.
Wood production
Percentage of timber harvest (ration between harvest and forested areas) show a
decrease since the 90’ (with a ratio of 1.1 m3/ha), going to 0.7 m3/ha in 2010.
The rate of utilization of wood is about one fifth of the increase of the current woody
volume (40 million m3).
Figure 13. Trend of harvest timber for building and for fuel.
30Certification of sustainable forest management
At the end of 2009 about 12% of national forested areas have been acknowledged
under at least one of the two certification schemes, PEPC (Programme for the
Endrosement of Forest Certification) or FSC (Forest Stewardship Council). By the end of
2012 forested areas with the double certification totalled to 34,725 ha, with 5,800 in
Tuscany, 16,347 in Lombardia and 12,578 in Trentino.
Figure 14. Certified forest areas in Italy according to the schemes PEFC and FSC.
Fisheries
In 2011 decrease trend initiated in 2000 went on, with a shrinking of fishing fleet both in
term of number of vessels (-1.2% with respect to 2010) and in fishing capacity (-2.6%
with respect to 2010. Also tonnage went through a negative trend (-4% with respect to
2010). Fishing efforts, in a negative trend since 2005, increased from 25.2 in 2008 to
26.5 in 2009, and again decreased from 2009 to 2011 reaching to 23.9; Catch Per Unit of
Effort (CPUE) with 8.8 kg/die, are on the same place as last two years (Table 7).
Table 7. Fisheries (source: IREPA – Institute of Economic surveys for fisheries and aquaculture – MIPAAF – Ministry
of Agrculture, Forestry and fisheries).
2009 2010 2011 2012
Fishing effort (Gross tonnage x 26,5 25,5 23,9 22,8
average days of fishing)
CPUE (Catch Per Unit of Effort,) 8,8 kg/die 8,7 kg/die 8,8 kg/die 8,8 kg/die
31Q4: WHAT ARE THE IMPACTS OF THE CHANGES IN BIODIVERSITY FOR
ECOSYSTEM SERVICES AND THE SOCIO-ECONOMIC AND CULTURAL
IMPLICATIONS OF THESE IMPACTS?
Humane well-being is strongly linked to the state of the environment, and to the
stability and abundance in available natural resources. As a consequence, to guarantee
and increase actual and future well-being of people, is of paramount importance to
satisfy humane needs promoting development that would not hamper balance and
condition of natural ecosystems.
In Italy contradictory data for quality of soil and land: in particular PAs and green space
in cities are increasing, but hydrogeological instability still represents an overall natural
threat. In addition risks for humane health and natural environment by pollution in
several areas of our Country should be put in a safer state and decontaminated.
Ecceptional atmospheric events, more and more frequent in latter years, emphasized
how well managed wetlands and river basins are important to mitigate these
phenomena. Whereas change in land use concern areas nearby rivers, or coastal and
mountain areas, resilience capacity to intense rains is significantly reduced. Balance
between settlements, industrial plans, cultivated lands, natural areas and wetlands
should be driven back to a point that would allow to manage heavy rainfall. Economic
loss have been important where preventive intervention were not in place, and above
all where settlement and construction have been placed in naturally flooding. To this
end is not an easy task to quantify economic needs to restore land and compare to
those necessary to compensate damages following catastrophic atmospheric events.
Drinking water consumption are more or less at the same value of 1999, but with a
constant and important leakage in the distribution web; in some Region water supply
disruption is rather frequent.
Consumption of renewable energy are on increase, and in 2010 use of green energy in
Italy is above EU average. Consumption of local prime resources dims, even it is
probably too early to affirm that we are going towards a de-materializaion of Italian
economy. Trends in anthropogenetic emissions of gas that halter climate is decreasing ,
but this is probably linked to the recent economic crisis
(http://www.minambiente.it/sites/default/files/archivio/biblioteca/bes_2013.pdf).
32PART II: THE NATIONAL BIODIVERSITY STRATEGY AND
ACTION PLAN, ITS IMPLEMENTATION, AND THE
MAINSTREAMING OF BIODIVERSITY
Q5: WHAT ARE THE BIODIVERSITY TARGETS SET BY YOUR COUNTRY?
Q6: HOW HAS YOUR NATIONAL BIODIVERSITY STRATEGY AND ACTION
PLAN BEEN UPDATED TO INCORPORATE THESE TARGETS AND TO SERVE
AS AN EFFECTIVE INSTRUMENT TO MAINSTREAM BIODIVERSITY?
Italy adopted on October 2010 the National Biodiversity Strategy (NBS), as a reference
document in order to stick to commitments accepted with the ratification of the
Convention on Biological Diversity.
NBS aims to merge and integrate biodiversity conservation targets and sustainable use
of natural resources within sectorial policies, and as a consequence the implementation
of the vision of the Strategy itself: “Biodiversity and ecosystem services, our natural
capital, are valued, preserved and where possible restored, for their intrinsic value and
in order to underpin economic prosperity and humane well-being in spite of deep
changes occurring at local and global level”.
In order to implement it, Strategy has been organized in three main pillars, linked
likewise with strategic targets (Figure 15).
Biodiversity and Biodiversity and climate Biodiversity and
ecosystem services change economic policies
•STRATEGIC TARGET; •STRATEGIC TARGET: •STRATEGIC TARGET:
within 2020 guarantee within 2020 substancially within 2020 integrate
biodiversity reduce in Italy climate biodiversity conservation
conservation, as variety change impact on in sectorial economic
of live organisms, their biodiversity, settling policies, also to bust new
genetic variability and suited measure to adapt jobs and social cohesion,
ecosystems to which to changes and to reinforcing
they belong, and to mitigate their effects, comprehension of
secure protection and enhancing resilience of assetts of ecosystem
restoration of ecosystem natural and semi-natural services, and awareness
services in order to ecosystems. of economic loss when
guarantee key roles for damaged.
life on Earth and ofr
humane well-being
Figure 15. Pillars of NBS.
33You can also read