April 2013 - Impact Analysis of Transoeste Bus Rapid Transit System in Rio de Janeiro
←
→
Page content transcription
If your browser does not render page correctly, please read the page content below
Impact Analysis of
Transoeste Bus Rapid
Transit System in
Rio de Janeiro

ITDP
  Brazil

April
  2013

Authors: Colin Hughes and Eleanor Leshner

Acknowledgments

The authors would like to give special thanks to Clarisse Linke for her guidance and
critical review of this report and to Jacob Mason and Ramiro Alberto Ríos for their
excellent data analysis. In addition, they would like to thank the ITDP Brazil team,
especially Pedro Torres, Marina Corrêa and Connor Cox for their participation in the
Transoeste user survey. This report also could not have been produced without the
support of Walter Hook, Aimee Gauthier, Ulises Navarro, Helena Orenstein de
Almeida, Marcos Tognozzi and Eric Agar.

                                                                                       2
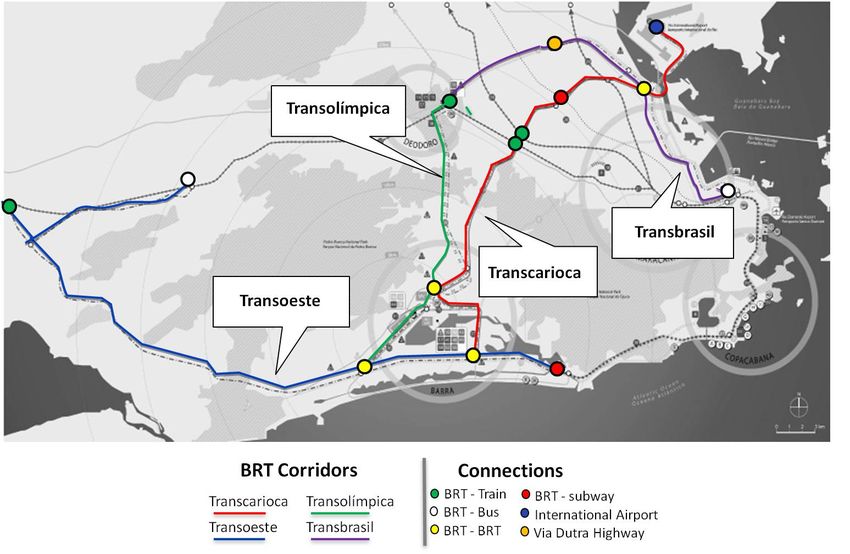
Table of Contents
Sumário Executivo ................................................................................ 5
Executive Summary ............................................................................... 6
I. Introduction and background ................................................................. 7
    1.1 Objective ................................................................................... 7
    1.2 Methodology ............................................................................... 7
    1.3 Transport Trends in Rio .................................................................. 7
    1.4 Transoeste Project Development and Implementation ............................. 9
    1.5 Transoeste Service Implementation ................................................... 10
    1.6 Bus Line Optimization ................................................................... 12
    1.7 Feeder lines ............................................................................... 14
II: Impacts of First Phase of Transoeste ...................................................... 16
    2.1 Ridership ................................................................................... 16
    2.2 Modal Shift ................................................................................ 18
    2.3 Bus Speed and Travel-Time Savings ................................................... 21
    2.4 Waiting Time, Capacity and Overcrowding .......................................... 22
    2.5 Impact of Transfers ...................................................................... 23
    2.6 Impact on Cost to Users ................................................................. 25
    2.7 Comfort .................................................................................... 26
    2.8 Public Opinion ............................................................................ 28
    2.9 Emissions .................................................................................. 29
III: Recommendations for Improvement ...................................................... 33
    3.1 Increase bus frequency to improve capacity and waiting times .................. 33
    3.2 Address Peaking Problem with Variable Fares ...................................... 36
    3.3 Address Peaking Problem with Transit-Oriented Development ................... 37
    3.4 Improve Pedestrian and Bicycle Access and Safety ................................. 38
References ........................................................................................ 42
Annex I: Transoeste Survey Results ........................................................... 43
Annex II: Transoeste Survey .................................................................... 56
Annex III: TEEMP Model Methodology for BRT ............................................... 58
Annex IV: Transoeste BRT Standard Scorecard .............................................. 60

                                                                                                      3
List of Figures
Figure 1. BRT corridors by 2016 ................................................................ 8
Figure 2. Transoeste infrastructure Campo Grande – Santa Cruz – Jardim Oceânico .. 9
Figure 3. Transoeste current station map, March 2013 .................................... 11
Figure 4. Transoeste final services map, in progress ....................................... 11
Figure 5. Pre-Transoeste bus lines altered or removed — route map .................... 13
Figure 6. Transoeste feeder bus route map .................................................. 14
Figure 7. Transoeste feeder buses ............................................................ 15
Figure 8. Transoeste ridership growth (July 2012–March 2013) ........................... 16
Figure 9. Average daily ridership by hour for Transoeste, March 2013 .................. 17
Figure 10. Modal shift: How did you make this trip before Transoeste existed? ...... 18
Figure 11. Previously used bus services ...................................................... 18
Figure 12. Motorization trends, Rio de Janeiro municipality .............................. 19
Figure 13. Historical modal split, 1994 versus 2003 ........................................ 20
Figure 14. Transoeste fare integration ....................................................... 25
Figure 15. Passenger capacity rating ......................................................... 27
Figure 16. Transoeste bus comfort rating compared to “before” scenario ............. 27
Figure 17. Transoeste station comfort rating compared to “before” scenario ......... 28
Figure 18. Transoeste service rating compared to “before” scenario ................... 28
Figure 19. Public recommendations ........................................................... 29
Figure 20. Calculated CO2 emissions .......................................................... 30
Figure 21. Calculated PM emissions ........................................................... 30
Figure 22. Calculated NOx emissions .......................................................... 31
Figure 23. Annual vehicle kilometers traveled .............................................. 31
Figure 24. Fuel savings due to Transoeste BRT .............................................. 32
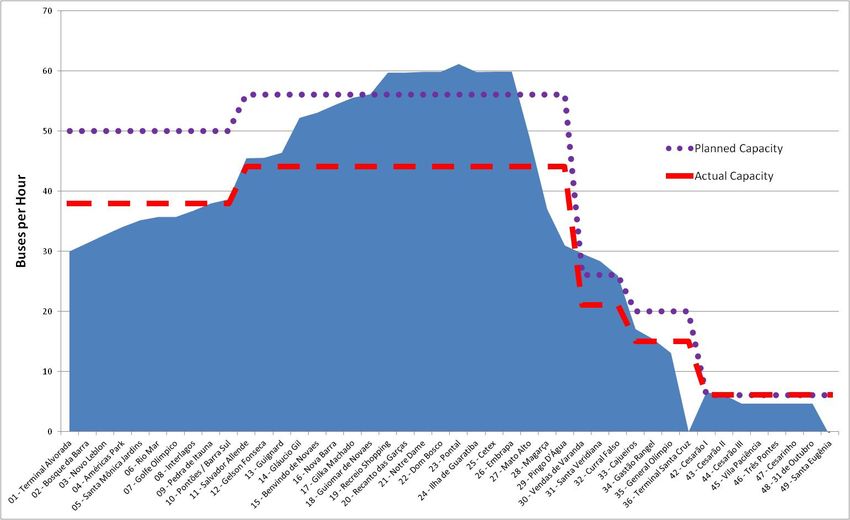
Figure 25. PM ridership demand versus observed and planned capacities .............. 34
Figure 26. Daily trips by bicycle in Rio de Janeiro, 2003 .................................. 38
Figure 27. Transport mode used to access/egress Transoeste ............................ 39
List of Tables
Table 1. Transoeste implementation phases ................................................ 10
Table 2. Pre-Transoeste bus lines with highest mode shift to Transoeste .............. 12
Table 3. Pre-Transoeste bus lines altered or removed (February 2013) ................ 13
Table 4. Transoeste feeder bus lines ......................................................... 14
Table 5. Observed bus speed and travel times .............................................. 21
Table 6. Travel-time savings and value calculations ....................................... 21
Table 7. Planned versus observed peak hour bus frequency, January 2013 ............ 22
Table 8. Percent of buses with air-conditioning and low emissions technology ....... 26
Table 9. TEEMP Model results .................................................................. 32
4
Sumário Executivo
O corredor de Bus Rapid Transit (BRT) Transoeste, no Rio de Janeiro, não é somente um
corredor com reconhecimento internacional e certificação ouro, mas também o primeiro
de quatro corredores de grande capacidade a serem implantados na cidade. Quando
todos os corredores forem entregues, a cidade terá uma rede de mais de 150 km de
corredores de BRT de alta qualidade, integrados aos sistemas de metrô, trens urbanos e
bicicleta pública, entre outros serviços de transporte. Este grande investimento em
infraestrutura é fundamental para a transformação do Rio de Janeiro em direção a uma
cidade mais sustentável, com ar mais limpo, pessoas mais saudáveis, tempos de viagem
mais curtos, e custo de viagem mais acessível à população.

O objetivo deste relatório é examinar os ganhos do Transoeste em seus primeiros nove
meses de operação, de modo a compreender o impacto para os passageiros; informar o
público sobre o resultado da implementação deste novo sistema na cidade; fazer
recomendações aos operadores sobre como melhorar o desempenho e ao mesmo tempo
lidar com o aumento da demanda; assim como fazer recomendações sobre como
melhorar o sistema como um todo, com lições para os outros corredores a serem
implementados na cidade do Rio de Janeiro.

Os resultados encontrados na análise são claros: o Transoeste melhorou drasticamente a
mobilidade, as emissões e o nível do conforto de viagem, e apresenta um precedente de
sucesso para o sistema de BRT que está sendo implementado na cidade. Com estas
considerações feitas, no entanto, é preciso alertar para o fato de que o corredor
Transoeste tem questões críticas: os tempos de espera dos passageiros ainda são
significativos, devido a procedimentos de embarque ineficientes, e as frequências de
ônibus estão 25% mais baixas do que as planejadas. Ambos estes aspectos devem ser
resolvidas para manter os impactos positivos da Transoeste no tempo de viagem, no
conforto e na sua imagem do sistema como parte de um novo paradigma de mobilidade
do Rio de Janeiro.

Estas melhorias também serão necessárias para lidar com o rápido crescimento no
número de passageiros, como o que temos visto desde junho de 2012, assim como com a
estimativa futura de demanda quando o corredor for integrado à estação de metrô do
Jardim Oceânico.

Os indicadores impactos do Transoeste, conforme descritos neste relatório, estão listados
abaixo:

Média de tempo reduzido por viagem                          40 minutos/viagem
Média de tempo reduzido de viagem por passageiro            14 dias/pessoa/ano
Valor de tempo reduzido para todas as viagens               R$ 70 milhões/ano
Redução dos quilômetros percorridos pelos veículos          38.4 milhões km/ano*
Redução de uso de combustível                               44 milhões litros/ano*
Redução de emissões de dióxido de carbono (CO2)             107,000 toneladas/ano*
Redução de emissões de material particulado (PM)            6.0 toneladas/ano*
Redução de emissões de óxidos de nitrogênio (NOx)           206 toneladas/ano*
*Estimativa anual considerando vinte anos

                                                                                         5

Executive Summary
The Transoeste Bus Rapid Transit (BRT) line in Rio de Janeiro’s West Zone is not only
an internationally recognized gold-standard BRT in and of itself, it is also the first of
four major gold-standard BRT corridors to be built in the city. When all corridors are
built, the city will have a network of more than 150 km of high-quality BRT lines to
further complement its subway, commuter rail, bike-share and other alternative
transport services. These investments are crucial for shifting Rio de Janeiro onto a
more sustainable path, with cleaner air, healthier people, shorter travel times and
improved access for lower travel cost.

The objective of this analytical report is to look at the achievements of Transoeste in
its first nine months of operations to understand the impacts it is having on users and
within the corridor; to inform the public on the impacts of this new system and
inform the operators on ways of bolstering its performance as demand increases; and
to further development of high-quality BRT corridors within Rio de Janeiro.

The overall results of the analysis are clear: Transoeste has drastically improved
mobility, emissions and comfort within its corridor and presents a successful
precedent to carry forward as BRT expands both within the corridor and across Rio.

With these successes noted, Transoeste is not in the clear completely: Significant
waiting times for passengers due to inefficient boarding procedures and bus
frequencies 25 percent lower than planned must be addressed in order to maintain
Transoeste’s beneficial impacts on travel time, comfort and its positive image as Rio
de Janeiro’s new form of mobility.

Such improvements will also be necessary to cope with the rapid growth of ridership
experienced thus far and forecasted to continue over the next two years as the line
extends to the new Jardim Oceânico subway line.

A summary of the Transoeste’s impacts as found in this analysis are presented below:

Impacts on corridor:

Average Time Saved per Trip                            40 minutes / trip
Average Time Saved per Commuter                        14 days / person / year
Value of Time Saved for all trips                      R$ 70 million / year
Vehicle Travel Reduction                               38.4 million kilometers / year*
Fuel Use Reduction                                     44 million liters / year*
Carbon Dioxide (CO2) Emission Reduction                107,000 tons / year*
Particulate Matter (PM) Emission Reduction             6.0 tons/year*
Nitrogen Oxides (NOx) Emission Reduction               206 tons / year*
*Estimate over 20 year period

                                                                                         6
I. Introduction and background
1.1 Objective
The objective of this study is to investigate the impacts that Transoeste, the
first BRT implemented in Rio de Janeiro, has provided to its users over the
previous bus lines servicing the corridor and potentially over driving a private
car.

1.2 Methodology
Transoeste’s impacts were assessed through the lenses of mobility, comfort
and environmental indicators.

To identify changes in mobility and comfort on the corridor following
Transoeste’s implementation, the ITDP Brazil office conducted a sample
survey of Transoeste users in October 2012. The survey sought to provide
quantifiable data on users’ travel behavior and level of satisfaction with
Transoeste compared to previous bus service. A complete description of the
methodology and results of the user survey, including the survey itself, can be
found in Appendices I and II of this report. The report also draws on municipal
data on bus frequencies, fleet size, travel times and ridership to further
assess mobility and comfort. This information, along with ITDP observations of
the system, was used to calculate travel time savings, as well as ridership
demand and service capacity at stations along the corridor.

To assess the environmental impacts of the project, the above data was also
analyzed with the Transportation Emissions Evaluation Model for Projects
(TEEMP), a methodology developed by ITDP and recommended by the Global
Environment Facility (GEF). This process uses project inputs to estimate the
impact on vehicle distance traveled along the corridor, carbon emissions and
pollution, and fuel consumption over a 20-year period. For more detailed
information on the TEEMP Model, please see Appendix III.

1.3 Transport Trends in Rio
As incomes in Rio de Janeiro have risen over the last decade, motorization has
increased such that the city is now facing widespread issues with traffic
congestion and other adverse social, economic and environmental impacts
from this growth in automobile use. Rio de Janeiro’s automobile fleet has
grown steadily at an average rate of 5 percent per year, from around 1.7
million light-duty vehicles (LDVs) in 2001 to about 2.8 million in 2011, which

                                                                                   7
represents a total increase in motorization of 61 percent during the ten-year
period. 1
In the streets of Rio, traffic congestion has also increased significantly. In
2003 the average speed for private vehicles in the most important
transportation corridors in the city was 27 km/hr. By 2012 the average speed
had declined by 35 percent to just 20 km/hr.2 By 2032 the average speed in
the city is expected to decrease to 16 km/hr.
Given these patterns in motorization and decrease in average speeds, the city
of Rio de Janeiro adopted an aggressive plan to improve public transportation
options in the city and metropolitan area. The plan includes investment in
the expansion of the city’s subway system as well as the construction of
segregated busway systems that will help the city alleviate some of the
pressing mobility problems and aid its preparation for two major sporting
events: the 2014 Soccer World Cup and the 2016 Olympics. Transoeste is the
first of four Bus Rapid Transit (BRT) corridors to be constructed by 2016,
which will total 150 km of busways when complete (Figure 1). City officials
expect that these corridors will accommodate demand for approximately
1,700,000 daily trips.
Figure 1. BRT corridors by 2016
Source: Secretary of Transportation, Rio de Janeiro, January 2013.
1
Observatório
das
Metrópoles
(2013).
2
O
Globo,
http://oglobo.globo.com/transito/cariocas-‐convivem-‐cada-‐vez-‐mais-‐com-‐engarrafamentos-‐
3471657
8
1.4 Transoeste Project Development and Implementation
In the face of growing congestion, pollution and cost of motorized mobility,
the city of Rio de Janeiro is investing in a BRT network because of BRT’s
ability to transport high passenger volumes at relatively high speeds with good
service quality, all at a fraction of the cost of a rail
project. “This
is
the
first
BRT,
with
others
to
come.
It
is
a
cultural
The first phase of the Transoeste corridor opened in change
around
how
people
June 2012 and runs from Santa Cruz neighborhood, in
move
about
in
the
city.
It’s
like
the northwestern part of the municipality, to Alvorada
a
subway
train
on
wheels,
at
Terminal in the heart of Barra da Tijuca neighborhood,
much
lower
costs.”
—Eduardo
in the southern part of Rio’s West Zone (Figure 2). For
Paes,
Mayor
of
Rio
de
Janeiro
the most part, this section of the corridor runs through
Avenida das Américas, the main thoroughfare in Barra da Tijuca and Recreio
dos Bandeirantes neighborhoods. The extension of the corridor to Campo
Grande neighborhood east of Santa Cruz has been under limited operations
since early 2013, with expected service expansion during the remainder of
2013.
The final implementation phase, wich will link Alvorada Terminal to Jardim
Oceânico Station, located at the far eastern end of Barra da Tijuca, is set to
be completed by 2016, in time for the Summer Olympic Games. The Jardim
Oceânico station will be a key intermodal station, linking the Transoeste BRT
to the expanded subway system. By the time Transoeste is completed in its
entirety, it will feature approximately 60 km of BRT infrastructure with a
total of 68 stations and an expected total demand of 220,000 passengers per
day by 2016.3
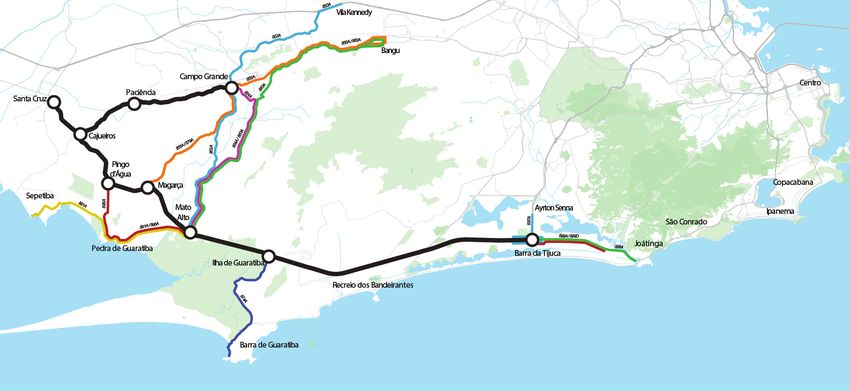
Figure 2. Transoeste infrastructure Campo Grande – Santa Cruz – Jardim
Oceânico
The green line shows the 38.6 km section of Transoeste in operation since June 2012. The yellow
section from Santa Cruz to Campo Grande has been under construction and beginning limited
3
Secretary
of
Transportation,
Rio
de
Janeiro,
2013.
9
operations as of early 2013. The red section will connect Alvorada Terminal to the future Jardim
Oceânico subway station at the eastern edge of Barra da Tijuca neighborhood by 2016.
Table 1. Transoeste implementation phases
CORRIDOR OPENING EXTENSION TOTAL
DATE STATIONS
Santa Cruz–Alvorada June 2012 38.6 km 34 (March ’13)
36 ( total
planned)
Santa Cruz–Campo 2013 16.3 km (Santa Cruz–Campo 8 (Feb. ’13)
Grande (scheduled Grande) 24 (total planned)
completion) 15.8 km (Campo Grande–Santa
Cruz)
Alvorada–Jardim 2016 5.7 km 8 (planned)
Oceânico (scheduled
completion)
Source: Secretary of Transportation, Rio de Janeiro, February 2013.
1.5 Transoeste Service Implementation
As of March 2013, Transoeste operates 34 stations between Santa Cruz and
Alvorada terminals, on 38.6 km of continuously separated busway, on which it
operates 91 articulated Euro V diesel buses. Its operations have also expanded
to 8 out of 24 total stations along the 16 km section of busway that arcs north
and east from Santa Cruz Terminal to Campo Grande Terminal, which is still
under construction (Figure 3).
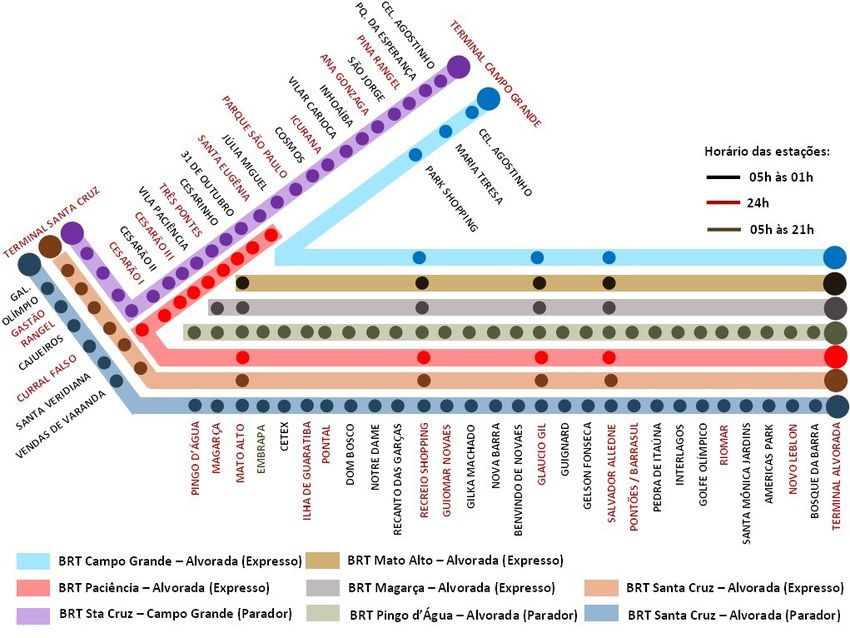
Transoeste was operating five services as of March 2013, with expected
service expansions (Figure 4). These five services include local and express
service between Alvorada and Santa Cruz terminals as well as local and
express services between Alvorada Terminal and Pingo d’Água station in
Guaratiba neighborhood, which services Mato Alto, Magarça and Pingo d’Água
stations (transfer points for several BRT feeder lines with a high number of
boardings and alightings). Transoeste’s newest service is an express service
between Salvador Allende station in the Recreio neighborhood and Santa
Eugênia station in the Paciência neighborhood (note: this station was not yet
open during the Transoeste user survey in October 2012). As of March 2013,
there are also 11 feeder lines for the BRT, which are discussed in section 1.7.
10
Figure 3. Transoeste current station map, March 2013

 Source: Transoeste Ligeirão website, March 2013.

 Figure 4. Transoeste final services map, in progress

Source: Transoeste Ligeirão website, March 2013.

                                                        11
1.6 Bus Line Optimization
During the planning stage of the corridor, the Rio de Janeiro Transport
Department identified 48 bus lines that had at least an indirect impact on the
Transoeste corridor. About 30 to 35 of those lines have been or are planned to
be reduced or eliminated for the implementation of 36 feeder bus lines to be
completed once the corridor is finished in its entirety. The Transoeste user
survey identified that approximately 65 percent of all Transoeste riders
previously rode one of four main bus routes, as shown in Table 2 below.
Transoeste gained riders from at least a dozen other routes, but no other
single route than the four mentioned above accounted for more than 2
percent of Transoeste riders.

Table 2. Pre-Transoeste bus lines with highest mode shift to Transoeste

LINE                                                                             ORIGIN/DESTINATION                                                                                                                                                 DAILY    FLEE   FLEET WITH/
                                                                                                                                                                                                                                                    DEMAND   T      AC
853                                                                              Vila Kennedy–Barra                                                                                                                                                 8,275    22     2
SV853                                                                            Vila Kennedy–Barra                                                                                                                                                 4,645    12     0
854                                                                              Campo Grande–Barra                                                                                                                                                 8,485    19     0
SV854                                                                            Campo Grande–Barra                                                                                                                                                 809      4      1
855                                                                              Bangu–Barra                                                                                                                                                        14,600   25     2
882                                                                              Santa Cruz–Barra                                                                                                                                                   1,967    32     6
                                                                                 TOTAL                                                                                                                                                              38,781   114    10

According to Rio de Janeiro’s Secretary of Transportation (SMTR), as of
February 2013, five bus lines had been removed from the Transoeste corridor
(lines 387, 877, 878, 882 and 897). Of the remaining lines, only three will be
maintained (lines 853, 853SV, 876), and the rest will be consolidated. Some
lines will be turned into feeder lines to the BRT to maintain service to areas
adjacent to the BRT corridor (Table 3). The bus fleet is expected to be
reduced by 57 percent, from approximately 350 to 150 buses.4


4

  Secretary
  of
  Transportation,
  Rio
  de
  Janeiro,
  2013.


                                                                                                                                                                                                                                                                                  12
Table 3. Pre-Transoeste bus lines altered or removed (February 2013)
LINE ORIGIN-DESTINATION SITUATION NEW SERVICE
878 Santa Cruz–Alvorada Removed Transoeste + 899 Feeder
882 Santa Cruz–Barra da Tijuca Removed Transoeste + 899 Feeder
897 Pingo d’Água –Alvorada Removed Transoeste + 899 Feeder
877 Campo Grande–Alvorada Removed 879 Feeder + Transoeste + 899
Feeder
387 Marambaia–Centro Removed 874 Feeder + Transoeste + Regular
Bus
854 Campo Grande–Barra da Altered 854 Feeder + Transoeste + 899
Tijuca Feeder
883 Bangu–Barra da Tijuca Altered 883 Feeder + Transoeste + 899
Feeder
896 Pingo d’Água–Barra da Tijuca Altered 896 A Feeder + Transoeste + 899
Feeder
855 Bangu–Barra da Tijuca Altered 855 Feeder + Transoeste + 899
Feeder
879 Campo Grande–Alvorada Altered 879 Feeder + Transoeste
891 Sepetiba–Barra da Tijuca Altered 891A Feeder + Transoeste + 899
Feeder
Source: Secretary of Transportation, Rio de Janeiro, February 2013.
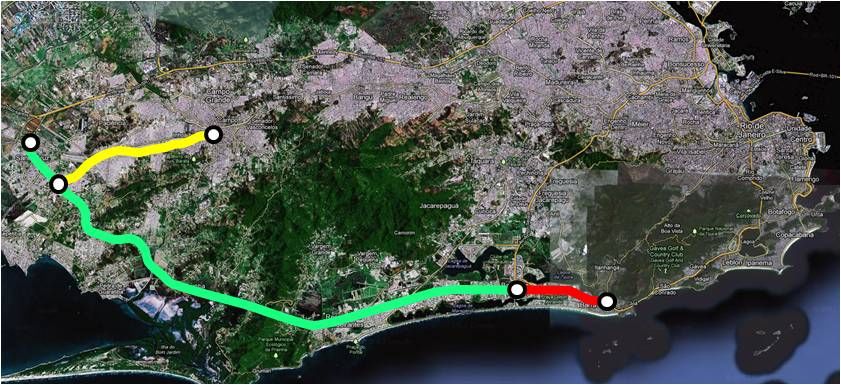
Figure 5. Pre-Transoeste bus lines altered or removed — route map
13
1.7 Feeder lines
Service previously provided by 11 regular bus routes on and adjacent to the
Transoeste corridor has been replaced by 11 feeder lines as of March 2013 (Figure 6).
As of March 2013, average weekday feeder bus ridership was approximately 41,000.
As BRT service expands, other regular bus lines will be altered and formed into
feeder bus lines.

Table 4. Transoeste feeder bus lines

LINE                                                         ORIGIN                                                                                                                                                                         DESTINATION            AVERAGE WEEKDAY
                                                                                                                                                                                                                                                                   RIDERSHIP (MARCH
                                                                                                                                                                                                                                                                   2013)5
853A Vila Kennedy                                                                                                                                                                                                                                   Mato Alto      2,272
854A Campo Grande                                                                                                                                                                                                                                   Mato Alto      3,499
855A Bangu                                                                                                                                                                                                                                          Magarça        6,693
874A Ilha                                                                                                                                                                                                                                           Marambaia      274
879A Campo Grande                                                                                                                                                                                                                                   Magarça        3,138
883A Mato Alto                                                                                                                                                                                                                                      Bangu          6,788
891A Sepetiba                                                                                                                                                                                                                                       Mato Alto      1,789
896A Pedra de                                                                                                                                                                                                                                       Pingo d’Água   2,996
     Guaratiba
897A Alvorada                                                                                                                                                                                                                               Ayrton Senna (via      1,283
                                                                                                                                                                                                                                            Barra Shopping)
899A                                                               Alvorada                                                                                                                                                                  Joatinga              7,249
899D                                                               Alvorada                                                                                                                                                                  Downtown              4,954
                                                                                                                                                                                                                                            TOTAL                  40,935

Figure 6. Transoeste feeder bus route map


5

  BRT
  Report
  March
  2013
  (operational
  data),
  Secretary
  of
  Transportation,
  Rio
  de
  Janeiro.

                                                                                                                                                                                                                                                                                      14
Feeder buses are all Euro V, non-articulated buses with A/C and require no transfer
fare to the BRT service (Figure 7). The impact of feeder bus lines on transfers is
discussed in Section 2.5.

Figure 7. Transoeste feeder buses

Source: Transoeste Ligeirão website, 2013.

                                                                                      15
II: Impacts of First Phase of Transoeste
2.1 Ridership
After significant and steady ridership growth in Transoeste’s first nine months
of operation, average weekday daily ridership on Transoeste as of March 2013
was approaching 100,000 passengers (Figure 8). In addition, ridership
surpassed 104,000 daily passengers on March 15, 20136. It is difficult to say
exactly how much bus ridership the corridor accommodated before the
implementation of Transoeste for comparison, because so many routes had
partial coverage of the corridor and route ridership data was only collected in
aggregate, not by station. However, ITDP’s September study shows that 15
percent of Transoeste riders previously did not ride the bus (see Section 2.2.).
Also, even the minority of routes that now require a transfer have high total
travel-time savings (see Section 2.5), meaning it is unlikely the
implementation of the BRT lost riders. These factors suggest that ridership
has grown considerably on the corridor following BRT implementation.
Furthermore, ridership is only more likely to grow as Transoeste improves and
expands operations and when it links to the subway system.

Figure 8. Transoeste ridership growth (July 2012–March 2013)

              100,000


                      90,000
                                                                                                                                                                                                                                                                                       97,557

                                                                                                                                                                                                                                                                                                        91,473

                      80,000
                                                                                                                                                                                                                                                             85,776

                                                                                                                                                                                                                                                                              81,297

                      70,000
                                                                                                                                                                                                                                   76,614

                                                                                                                                                                                                                                                    72,033

                      60,000
                                                                                                                                                                                                    63,915


                      50,000
                                                                                                                                                    56,951


                      40,000

                                                                                                                                    38,462

                      30,000


                      20,000


                      10,000


                                                            0

                                                                                       July
  2012
   Aug
  2012
  Sept
  2012
   Oct
  2012
   Nov
  2012
   Dec
  2012
   Jan
  2013
   Feb
  2013
   Mar
  2013


Source: BRT Reports July 2012–March 2013 (operational data), Secretary of Transportation,
Rio de Janeiro.


6

  BRT
  Report
  March
  2013
  (operational
  data),
  Secretary
  of
  Transportation,
  Rio
  de
  Janeiro.

                                                                                                                                                                                                                                                                                                                                  16
One item of concern for the system is that it exhibits extremely high peaks in
travel activity for only one hour in each direction per day (Figure 9). This is a
classic “peaking problem” of the corridor’s existing travel demand due to
regional land use and transportation demand patterns. Peak travel hours of 6
am and 5 pm were attracting over 9,000 — and at times 10,000 — boardings
per hour in March 2013. This peaking issue, combined with underachievement
in bus frequency at peak hour, is currently resulting in long wait lines at
several stations at peak hour. The implications of this and potential solutions
are discussed in Sections 2 and 3, respectively.

Figure 9. Average daily ridership by hour for Transoeste, March 2013

                                                                      6h
                                                                       17h

                       10000

                                                                     9768
                                                                      9960

                        9000

                                                                                           7h

                        8000
                                                            8458
                                          16h

                                                               5h
                                                                                                     18h

                                                              7631
                                                                      7780
                        7683

                        7000


                        6000

       Ridership


                        5000


                        4000


                        3000


                        2000


                        1000


                             0

                                     0h
   1h
   2h
   3h
   4h
   5h
   6h
   7h
   8h
   9h
  10h
  11h
  12h
  13h
  14h
  15h
  16h
  17h
  18h
  19h
  20h
  21h
  22h
  23h

                                                                                                         Time
  of
  day


Source: BRT Report March 2013 (operational data), Secretary of Transportation, Rio de
Janeiro.

Ridership is expected to increase as the Campo Grande section is completed,
yielding 110,000 total passengers per day. After expansion to Jardim
Oceânico station by 2016, linking Transoeste to the subway, ridership is
predicted to double, reaching 220,000 passengers per day. Beyond pure
ridership increases, off-peak demand is also anticipated to increase once the
corridor is completed, though peak demand should also remain strong. Off-
peak demand is especially expected to pick up for passengers traveling within
the Barra da Tijuca neighborhood and those integrating with the subway to
travel to the South Zone and city center for educational and leisure activities.

                                                                                                                                                                                                           17
2.2 Modal Shift
Projects that encourage mode change from cars and taxis to public transport
are important both within the city of Rio to lower air pollution and
greenhouse gases as well as on the Avenida das Américas in particular, to
improve travel time, and to reduce vehicle congestion and cost of travel. The
October survey of Transoeste passengers identified that the large majority of
users (85 percent) used regular buses to make the same trip before
Transoeste, 7 percent used vans or kombis — informal shared transportation —
while 2 percent made the trip by car or taxi. Merely 1 percent of passengers
previously made their trip by bicycle or on foot (Figure 10). Of the 85 percent
of users who previously used regular bus service, 44 percent identified using
bus line 882 alone and 60 percent said they used either bus line 882, 885, 854
or 853 (Figure 11).

Figure 10. Modal shift: How did you make this trip before Transoeste

existed?

Source: ITDP Survey, October 2012.

Figure 11. Previously used bus services

                                                                             18
Source: ITDP Survey, October 2012.
While modal shift from cars and taxis to BRT appears initially low at 2
percent, it is expected to increase considerably over the coming months and
once the bus and subway are integrated at Jardim Oceânico station.
Increasing bus ridership is also a significant achievement in a city where
automobile ownership has grown rapidly (Figure 12) and bus modal share has
fallen (Figure 13). If Transoeste catalyzes bus ridership and mode share
growth in the corridor, this would represent a significant improvement over a
scenario in which the BRT was not built and bus ridership continued to decline
in future years. The BRT will make public transit far more competitive with
cars and taxis in this corridor in future years.
Figure 12. Motorization trends, Rio de Janeiro municipality
Car
Fleet
Growth
(1994-‐2011)
3
000
000
2
500
000
2
000
000
1
500
000
1
000
000
500
000
0
1995
1997
1998
1999
2001
2005
2007
2008
2009
2011
1994
1996
2000
2002
2003
2004
2006
2010
Source: DENATRAN (1994–2011).
19
Figure 13. Historical modal split, 1994 versus 2003

                                      1994
         Ferry
                              2003
               Ferry

        Metro
   Train
                                           Metro
   Train
                          0.4%

                                                     0.7%

        2.3%
   3.1%
                                             1.8%
   1.5%
                            Other

                                                     Other

       Bicycle
                                     0.5%
      Bicycle
                                     2.3%

        1.3%
                                                    3.2%

                         Cars/

                                                                               Van

                         Taxis

                                                                               8.2%
                       Bus

                        11,5%

                                                                                                           33.1%

                                                                           Cars/

                     Pedestrian
                 Bus
                    Taxis

                       19,7%
                   61.0%
                   15,6%

                                                                                          Pedestrian

                                                                                            33,9%


Source: Plano de Transporte de Massa da Região Metropolitana do Rio de Janeiro (RMRJ)
(1995), Plano Diretor de Transporte Urbano (PDTU) da RMRJ (2003).

                                                                                                                           20
2.3 Bus Speed and Travel-Time Savings
Table 5. Observed bus speed and travel times

                                                                                                                                                                                                                                                                 REGULAR BUS         TRANSOESTE
                                                                                                                                                                                                                                                                 SERVICE             (EXPRESS)
                                                                                                                                                                                                                                                                 (BEFORE)
Average travel time from end to end
(minutes)
Peak hours                                                                                                                                                                                                                                                       2:25                0:52
Nonpeak hours                                                                                                                                                                                                                                                    2:25                0:52
Average bus speed from end to end
(km/h)
Alvorada–Santa Cruz                                                                                                                                                                                                                                              16                  44
Santa Cruz–Alvorada                                                                                                                                                                                                                                              16                  46
Source: Operational data, Secretary of Transportation, October 2012.

Transoeste’s Bus Rapid Transit infrastructure and operational design have cut
the average travel time for a bus trip within the corridor by 62 percent over
the traditional bus service. Based on BRT boarding data provided by the
Secretaria Municipal de Transportes, station distances, mode shift, and
corridor speeds before and after BRT implementation, Transoeste saves each
passenger 40 minutes per trip on average (including express and local
services), which adds up to 14 days per year for the average commuter who
makes two trips per day. With 104,000 daily trips, this translates to an
aggregate time savings of 21 million hours per year for all passengers along
the corridor. This is not only more convenient for bus passengers, it also has a
real value for economic productivity in the region. The value of time saved for
transportation is usually conservatively calculated by taking one third of the
average hourly wage rate in the city (ten Reais) 7 and multiplying it by the
number of hours saved for users. This means that the time the Transoeste is
currently saving its users is valued at 70 million Reais per year.

Table 6. Travel-time savings and value calculations

Avg.                                                                                         Total Hours                                                                                                     Annual Time                            Total          Annual Time      Annual Time
Time                                                                                         Saved Daily                                                                                                     Savings for a                          Yearly         Savings Value    Savings Value
Savings                                                                                                                                                                                                      Commuter**                             Hours          (USD)            (Reais)
per Trip*                                                                                                                                                                                                                                           Saved
40 min.                                                                                      68,000 hrs.                                                                                                     14 days                                21 million     USD 35 million   BRL 70 million

* Based on average trip distance, not including difference in wait times.
** Based on average commuter who makes two trips per weekday


7

  Rio
  de
  Janeiro
  Municipality,
  Average
  Wage,
  Brazilian
  Census
  IBGE
  (2010).


                                                                                                                                                                                                                                                                                                    21
2.4 Waiting Time, Capacity and Overcrowding
Transoeste’s BRT infrastructure has greatly improved bus speeds and travel
times. However, it is currently operating without a sufficient number of
vehicles to meet demand, particularly at peak hours. This creates significant
waiting times for users at these hours, specifically at terminal stations. At the
busiest periods, surveys indicate riders must wait for up to four buses to pass
before they were able to board. The average user reported waiting in line for
1.4 buses to pass before being able to board and reported an average
perceived waiting time of 13 minutes.

Waiting times are a function of demand, bus capacity and bus headways. Bus
headways refer to the length of time between buses and can be halved to find
the average waiting time for a bus route that is not above capacity, since
riders will generally arrive at an equal distribution throughout the time
between buses. While it varies depending on the station, during off-peak
hours, Transoeste buses for all lines at the Alvorada station were scheduled to
operate at headway of six minutes for express buses (a three-minute average
wait time) and 8 minutes for local buses (a four-minute average wait time) in
early 2013. Peak-hour headways are much shorter and were scheduled to be
three minutes for express service and six minutes for local service.

However, in an audit of the actual bus headways achieved at Alvorada station,
the peak-hour headways observed are approximately 25 percent longer than
the bus operator’s target. This may be due to long boarding times at terminal
stations and/or other operational issues with bus circulation described below,
which restrict the number of loaded buses that can exit the station per hour.
For ITDP’s recommendations on how to improve bus frequencies, see Section
3.1.

Table 7. Planned versus observed peak hour bus frequency, January 2013
Line                         Service     Bus/Hr             Bus/Hr
                                         Planned            Observed
Alvorada–Santa Cruz          Express     20                 15
                             Local*      n/a                n/a
Alvorada–Pingo               Express     20                 15
d’Água
                             Local       10                 8
Recreio–Paciência            Express     8.6                8.6**
TOTAL                                    58.6               46.6
*Alvorada–Santa Cruz local service only runs during evening off-peak hours.
** Assumed frequency, not observed.
Source: Rio Ônibus, January 2013 and Observations March 28, 2013.

                                                                               22
At terminal stations and some intermediate stations, buses fill to beyond their
capacity during peak hours. This creates long boarding lines, which also
increase wait times. Of the passengers surveyed, 73.2 percent of express
passengers reported waiting more than 7 minutes and 42.5 percent of local
passengers reported waiting more than 12 minutes. Wait times for peak-hour
service have been as much as 40 minutes based on headway times, survey
reports and observations.

In addition, during peak hours at terminal stations, Transoeste has two and
sometimes three separate lines for passengers to board the bus at the
terminal stations, which affects waiting time. In the “sitting line” riders
queue up to be allowed to enter the bus first for a guaranteed seat. The
“sitting line” takes longer (approximately 20 to 40 minutes at peak) as most
riders are going from one terminal station to the other and seats for an hour-
long bus ride are preferred. Users who are in a hurry or do not need a seat
can enter a faster line for a standing position on the bus (approximately ten
to 20 minutes at peak hour). After enough passengers from the “sitting line”
have entered the bus and the seats are filled, riders from the “standing line”
are allowed to enter and fill a portion of the standing space. Some stations
have a third line for “priority” passengers, including elderly, disabled and
pregnant passengers, who are allowed to board before everyone else and are
allocated a fixed number of reserved seats per bus. In completing this two- to
three-step loading process, the bus must advance between lines in the
station, adding delay to the process.

2.5 Impact of Transfers
Transoeste’s significant savings in speed and bus vehicle miles traveled were
made possible through significant bus route rationalizing. Bus route
rationalization reduces overlap and redundancy, and can improve bus route
frequency and speed, but they also often impose transfers for users who
previously did not have them. In the case of Transoeste, it appears that
approximately 41,000, or 39 percent, of users now experience a transfer
(based on feeder route ridership, see Section 1.7). However, as discussed
below, for a third of these passengers these transfers are only temporary due
to sections of Transoeste that are not yet completed. Also, for all or nearly all
passengers, the increase in bus speeds from Transoeste more than makes up
for any time spent transferring.

Currently 12,000, or 29 percent, out of the 41,000 daily feeder riders use the
899 feeder line, which is a temporary feeder until the BRT trunk line is
extended to Jardim Oceânico in 2016. Additional riders on the 854 and 879
feeder lines with origins/destinations near the Campo Grande BRT trunk line
(currently under construction) may alter their trips to travel directly on the
BRT trunk line when it is extended to Campo Grande, depending on travel and

                                                                               23
transfer times for the feeder routes. The elimination of these temporary
transfers alone, when the corridor is completed in its entirety, would
decrease the proportion of Transoeste riders that experience a transfer to
approximately 25 percent. Additionally, taking into consideration that
Transoeste’s ridership is expected to double as it becomes more competitive
with private modes when it is linked to the subway in Jardim Oceânico, and it
is expected that a lower proportion of these riders will require transfers, the
proportion of Transoeste riders who face transfers would further decrease
upon corridor completion.

While approximately 39 percent of current Transoeste riders and 25 percent
of future riders face transfers, the time impact of transfers is still important
to consider. Currently the maximum average transfer waiting time is five
minutes for a local bus in the off-peak period (which runs on a ten-minute
frequency). Current low bus frequencies mean that passengers at some
stations have to wait up to 15 minutes to stand, or longer to sit on a bus, at
peak period. However, even if it is assumed that the average peak-hour
traveler has to wait 15 minutes for a transfer, this wait time is still more than
offset by the average time savings per trip of 40 minutes (see Section 2.3) on
the Transoeste trunk line.

Further, since 63 percent of all current transfers and 93 percent of transfers
post-2016 take place west of Ilha de Guaratiba station and the vast majority
of users boarding at stations west of Ilha de Guaratiba station exit at Alvorada
terminal, these users are assured that even a maximum 15-minute transfer
time would be made up four times over by the estimated 60-minute travel-
time improvement of the BRT service over the direct normal bus just between
Ilha de Guaratiba station and Alvorada terminal. Even passengers beginning
their trip on the 854 or 879 feeder lines and ending in Barra da Tijuca, whose
route will require two transfers up until 2016, would spend a maximum of 30
minutes transferring buses but save 60 minutes on the BRT trunk line, for a
net travel-time savings of 30 minutes minimum. The only riders who may have
a slower total transfer time would be the very small number or riders who use
Transoeste for very short trips and whose origin/destination station is so close
to their transfer station on the BRT trunk line that the speed increase on the
BRT does not make up for the transfer time. Since most Transoeste users are
traveling a significant distance on the system, this is likely to affect only a
very small number of riders.

                                                                               24
2.6 Impact on Cost to Users
For the 85 percent of transportation users who shifted from regular bus
service to BRT Transoeste, trip cost has not changed significantly.
Transoeste’s R$2.75 fare (approx. USD 1.38) is the same as regular bus fare.

Unlike on regular bus service, all transactions on Transoeste require using an
electronic fare card, which yields faster boarding and increased operational
transparency and facilitates transfers. Transoeste’s single fare covers up to
two feeder bus trips — or a combination of one feeder bus trip and one
regular bus trip — within a two-hour period (Figure 14).

Transoeste passengers using the Bilhete Único smart card, typically granted by
employers, would have also been able to use one single fare to make two
regular bus trips within a 2-hour period before Transoeste. However, out of
the 44 percent of Transoeste users who currently do not use the Bilhete Único
smart card8, those who used to make transfers between regular buses before
Transoeste without Bilhete Único are now offered more mobility at a reduced
cost.

Figure 14. Transoeste fare integration

Source: Rio Ônibus, January 2013.


8

  BRT
  Report
  March
  2013
  (operational
  data),
  Secretary
  of
  Transportation,
  Rio
  de
  Janeiro.


                                                                                                                                                                                                                                                    25
2.7 Comfort
Comfort is one of the key service qualities that can attract “choice” riders
from other modes and maintain them, reversing the trend of lower bus
ridership and increased car use over time. For bus passengers with relatively
long travel times, such as on the Avenida das Américas corridor, comfort on
the bus (as well as in the stations) is a significant factor of the mode’s
competitiveness. Transoeste not only cut travel times by half, it also made it
easier for passengers who need seats to find them, reduced crowding on
buses, made stations more comfortable and brought air-conditioning from 9
percent of buses to 100 percent of buses — all important features for work
commuters in a subtropical location. Transoeste also utilizes diesel buses with
the highest emissions standards (Euro V) to reduce unpleasant and unhealthy
air pollution from buses. The fleet currently uses B5 biodiesel and intends to
move to B20 biodiesel in the future.

Table 8. Percent of buses with air-conditioning and low emissions
technology

Rolling stock                                      Before       After
                                                   Transoeste   Transoeste
Percent of buses with air-conditioning (%)         9%           100%
Percent of buses with Proconve7/Euro V             0%           100%
technology
Source: Operational data, Secretary of Transportation, 2012.

The “sitting” and “standing” line system acts as a service innovation, allowing
users to make a choice based on their priorities: comfort (sitting) versus
speed (standing). Ideally this system also allows bus line attendants to ensure
buses leaving terminal stations will not be filled to or over capacity at peak
periods so that passengers can travel comfortably and buses can pick up
additional riders at intermediate stations. However, this is not always the
case. With demand at the stations exceeding the supply of buses, some
people enter “full” buses, causing crowding. Passenger surveys showed that
about 50 percent of passengers found the capacity of the buses comfortable
despite some complaints of overcrowding and an additional 32 percent of
passengers rated bus capacity as only “okay” (Figure 15).

                                                                             26
Figure 15. Passenger capacity rating

Source: ITDP Survey, October, 2012.

These comfort-oriented developments are not unnoticed among users. Of the
bus riders surveyed, 81 percent responded that bus comfort either
“improved” or “highly improved” with the introduction of Transoeste
compared to previous bus service (Figure 16). Similarly, 86 percent of
respondents identified station comfort as being either “improved” or “highly
improved” after Transoeste (Figure 17).

Figure 16. Transoeste bus comfort rating compared to “before” scenario

Source: ITDP Survey, October 2012.

                                                                          27
Figure 17. Transoeste station comfort rating compared to “before”
scenario

Source: ITDP Survey, October 2012.

2.8 Public Opinion
When asked to compare Transoeste’s service to previous bus service, surveyed
riders were positive on a whole, with 82.6 percent responding that public
transportation service, in general, either “improved” or “highly improved”
with the introduction of Transoeste (Figure 18).

Figure 18. Transoeste service rating compared to “before” scenario

Source: ITDP Survey, October 2012.

From the user survey, the majority of recommendations related to addressing
the low bus headways and subsequent overcrowding—45 percent of passengers
surveyed recommended increasing the bus fleet and/or improving bus
frequency (Figure 19). An additional 5 percent of surveyors complained
specifically about overcrowding. Another common recommendation was to
install bathrooms in stations.

                                                                          28
Figure 19. Public recommendations

Source: ITDP Survey, October 2012.

2.9 Emissions
An analysis of the Transoeste project over its first 20 years of operation shows
that it will create a dramatic reduction in emissions and fuel consumption
along the corridor. This analysis was completed using the Transportation
Emissions Evaluation Model for Projects (TEEMP), a methodology developed by
ITDP and recommended by the Global Environment Facility (GEF). The model
calculates transportation projects’ emissions over a 20-year period using a
variety of inputs, ranging from the length of the corridor and BRT ridership to
the fuel efficiency of vehicles. The analysis compares the BRT scenario to
business as usual, assuming the regular introduction of more efficient buses
and other vehicles over time in both scenarios.

Emissions in the Transoeste corridor would decrease in the BRT scenario
primarily due to more efficient transit vehicles and operations along the
corridor and to a lesser extent due to a shift of riders from private motor
vehicles to BRT. The modal shift calculations are based on the modal shift
observed in an October 2013 survey and projections of future modal shift,
which doubled the percentage of trips shifted from motor vehicle trips to BRT
every ten years. Compared to business as usual, the BRT scenario shows an
average reduction of 107,380 tons of carbon dioxide (CO2) emissions per year
and a 95 percent reduction in bus and paratransit (i.e., vans and kombis)
emissions along the corridor over 20 years. Particulate matter (PM) and
nitrogen oxides (NOx) emissions also are shown to be reduced by 6.0 and 206
tons per year, respectively. Yearly emission for CO2, PM and NOx are shown in
Figures 20–22.

                                                                              29
Figure 20. Calculated CO2 emissions
160,000
CO2
Emissions
(tons)
140,000
120,000
100,000
80,000
60,000
40,000
20,000
-‐
2012
2017
2022
2027
Cars
Taxi
Bus
Mini-‐bus
BRT
Note:
Solid-‐area
porIons
refer
to
modes
in
a
no
BRT
scenario
the
impacts
of
the
BRT
are
depicted
by
the
line
Figure 21. Calculated PM emissions
12
PM
Emissions
(tons)
10
8
6
4
2
-‐
2012
2017
2022
2027
Cars
Taxi
Bus
Mini-‐bus
BRT
Note:
Solid-‐area
porIons
refer
to
modes
in
a
no
BRT
scenario;
the
impacts
of
the
BRT
are
depicted
by
the
line
30
You can also read