JBC Papers in Press. Published on January 2, 2020 as Manuscript RA119.011083
←
→
Page content transcription
If your browser does not render page correctly, please read the page content below
JBC Papers in Press. Published on January 2, 2020 as Manuscript RA119.011083
       The latest version is at http://www.jbc.org/cgi/doi/10.1074/jbc.RA119.011083

 Mass spectrometry-based selectivity profiling identifies a highly selective inhibitor of the kinase MELK
                                that delays mitotic entry in cancer cells

   Ian M. McDonald1,2, Gavin D. Grant2,3, Michael P. East1,2, Thomas S. K. Gilbert1,4, Emily M.
   Wilkerson1,4, Dennis Goldfarb5,6, Joshua Beri1,4, Laura E. Herring1,4, Cyrus Vaziri2,7, Jeanette
                  Gowen Cook2,3, Michael J. Emanuele1,2, and Lee M. Graves1,2,4*

 From the 1Department of Pharmacology, University of North Carolina at Chapel Hill, Chapel Hill, NC
27599; 2Lineberger Comprehensive Cancer Center, University of North Carolina at Chapel Hill, Chapel
 Hill, NC 27599; 3Department of Biochemistry and Biophysics, University of North Carolina at Chapel
  Hill, Chapel Hill, NC 27599; 4UNC Michael Hooker Proteomics Core Facility, University of North
     Carolina at Chapel Hill, Chapel Hill, NC 27599; 5Department of Cell Biology and Physiology,
Washington University School of Medicine, St. Louis, MO 63110; 6Institute for Informatics, Washington
    University School of Medicine, St. Louis, MO 63110; 7Department of Pathology and Laboratory
             Medicine, University of North Carolina at Chapel Hill, Chapel Hill, NC 27599

                      Running title: MELK inhibition causes delayed mitotic entry

                                                                                                                Downloaded from http://www.jbc.org/ by guest on October 1, 2020
*To whom correspondence should be addressed: Lee M. Graves: Department of Pharmacology,
University of North Carolina at Chapel Hill, Chapel Hill, NC 27599; lmg@med.unc.edu; Tel.(919) 966-
0915.

Keywords: maternal embryonic leucine zipper kinase (MELK), multiplexed kinase inhibitor beads/mass
spectrometry (MIB/MS), kinome profiling, inhibitor selectivity, NVS-MELK8a, mitotic delay, G2/M
checkpoint, cell cycle, AMPK family, cell proliferation

ABSTRACT                                                  and immunoblotting, we observed that MELK
         The maternal embryonic leucine zipper            inhibition delays mitotic entry, which was
kinase (MELK) has been implicated in the                  associated with delayed activation of Aurora A,
regulation of cancer cell proliferation. RNAi-            Aurora B, and cyclin-dependent kinase 1 (CDK1).
mediated MELK depletion impairs growth and                Following this delay, cells entered and completed
causes G2/M arrest in numerous cancers, but the           mitosis. Using live-cell microscopy of cells
mechanisms underlying these effects are poorly            harboring fluorescent proliferating cell nuclear
understood. Furthermore, the MELK inhibitor               antigen (PCNA), we confirmed that 8a significantly
OTSSP167 has recently been shown to have poor             and dose-dependently lengthens G2 phase.
selectivity for MELK, complicating the use of this        Collectively, our results provide a rationale for
inhibitor as a tool compound to investigate MELK          using 8a as a tool compound for functional studies
function. Here, using a cell-based proteomics             of MELK and indicate that MELK inhibition delays
technique called multiplexed kinase inhibitor             mitotic entry, likely via transient G2/M checkpoint
beads/mass spectrometry (MIB/MS), we profiled             activation.
the selectivity of two additional MELK inhibitors,
NVS-MELK8a (8a) and HTH-01-091. Our results
revealed that 8a is a highly selective MELK                       The maternal embryonic leucine zipper
inhibitor, which we further used for functional           kinase (MELK), also known as MPK38 or pEg3, is
studies. Resazurin and crystal violet assays              a highly conserved member of the AMPK family of
indicated that 8a decreases triple-negative breast        kinases (1, 2). The proposed role of MELK in
cancer cell viability, and immunoblotting revealed        regulation of cell growth has been controversial.
that impaired growth is due to perturbation of cell       MELK expression is increased in cancer relative to
cycle progression rather than induction of                normal tissue (3), and high levels of MELK are
apoptosis. Using double thymidine synchronization

                                                      1
MELK inhibition causes delayed mitotic entry

correlated with tumor grade, poor prognosis,                the need for a more comprehensive understanding
radioresistance, and recurrence in multiple cancers         of MELK function. MELK has been reported to
(4–10). RNAi-mediated depletion of MELK has                 function in a multitude of processes including cell
been shown to cause impaired proliferation in a             cycle progression (3, 4, 28), maintenance of cancer
variety of cancers, including basal-like breast (4),        cell stemness (5, 29, 30), protein synthesis (31), and
glioma (5), acute myeloid leukemia (11), high-risk          apoptosis, (8, 32–34). Many of the functional
neuroblastoma (10), and hepatocellular carcinoma            studies of MELK have focused on the role of this
(9). In triple-negative breast cancer (TNBC),               kinase in the cell cycle. MELK mRNA is cell cycle
knockdown of MELK caused shrinking and                      regulated, and accordingly, protein levels of MELK
radiosensitization    of     xenografts    (4,    7).       oscillate throughout the cell cycle, with expression
Significantly, numerous studies have shown that             reaching a maximum in G2/mitosis (M) phase,
RNAi effects on growth are due specifically to              before declining upon mitotic exit (4, 35, 36).
MELK depletion by demonstrating rescue with                 Depletion of MELK has been shown to cause a
ectopic MELK expression (4, 5, 8, 9, 12, 13).               G2/M arrest in cells (3, 4, 17, 37). Some studies
Complicating the interpretation of these findings,          have attributed this effect to a role for MELK in the
the requirement of MELK for cancer cell                     G2/M DNA damage checkpoint, potentially
proliferation has been challenged by studies                mediated through interaction with CDC25B, a

                                                                                                                     Downloaded from http://www.jbc.org/ by guest on October 1, 2020
showing that genomic deletion of MELK with                  phosphatase that regulates CDK1 activity at the
CRISPR/Cas9 caused no growth effects (14–16).               G2/M checkpoint (38). Additionally, loss of
Other studies contend that genomic MELK deletion            MELK activity may cause activation of the
does cause impaired proliferation of cancer cells           ATM/Chk2 DNA damage response (39). Other
(17), although this effect may only manifest under          studies indicate that MELK knockdown
certain growth conditions (18).                             specifically impairs mitotic progression. A circular
         The discordant results between acute               relationship between MELK and FoxM1 has been
MELK knockdown and longer-term genetic                      described, whereby MELK expression is both
inactivation is reminiscent of other key cell cycle         regulated by this mitotic transcription factor, and
proteins whose essential roles are evident in               phosphorylation by MELK regulates the activity
experiments following acute inactivation by RNAi            and expression of FoxM1 (28, 39). MELK may
or with small-molecules, but less clear in knockout         also regulate synthesis of the anti-apoptotic protein
experiments. Two examples in particular illustrate          MCL1 in M via interaction with eIF4B (31).
this phenomenon. First, the cyclin D-CDK4/6                 Overall, while a number of studies have uncovered
complex is non-essential for proliferation in               putative functions of MELK at G2/M, a
knockout cell lines and virtually all mouse tissue          comprehensive understanding of the role of MELK
(19, 20), but chemical inhibitors halt progression          at these phases of the cell cycle remains elusive.
into S phase in cell lines with a functional                         One of the key challenges in studying the
retinoblastoma protein (21). This example is                biological functions of MELK has been the lack of
particularly relevant given the growing clinical use        a selective inhibitor. The most commonly used
of CDK4/6 inhibitors for the treatment of cancer            MELK inhibitor, OTSSP167 (OTS), also referred
(22). Second, recent results using CRISPR/Cas9              to as OTS167, has shown potent antiproliferative
gene editing suggest Bub1 is non-essential for              and apoptotic effects against multiple cancer types,
mitotic spindle checkpoint function in humans (23,          including TNBC, acute myeloid leukemia, and
24), but it was later shown that these “knockout”           high-risk neuroblastoma (4, 10, 11, 40, 41).
cells express low levels of a truncated Bub1 protein,       Consequently, OTS is currently in multiple phase I
accounting for the negative results and lack of a           clinical trials for the treatment of patients with
phenotype (25–27).         Together, these results          advanced TNBC and refractory or relapsed
highlight the importance of examining protein               leukemia       (NCT01910545,           NCT02795520,
function using multiple, orthogonal approaches and          NCT02768519, NCT02926690).                 While an
for using caution in interpreting negative results          effective inhibitor of cancer cell viability, OTS is
from gene knockout experiments.                             poorly selective for MELK. Recent publications
         The recent controversy concerning the              have shown that OTS is a broad-spectrum inhibitor
requirement of MELK in cancer has underscored               that inhibits numerous kinases that are vital for

                                                        2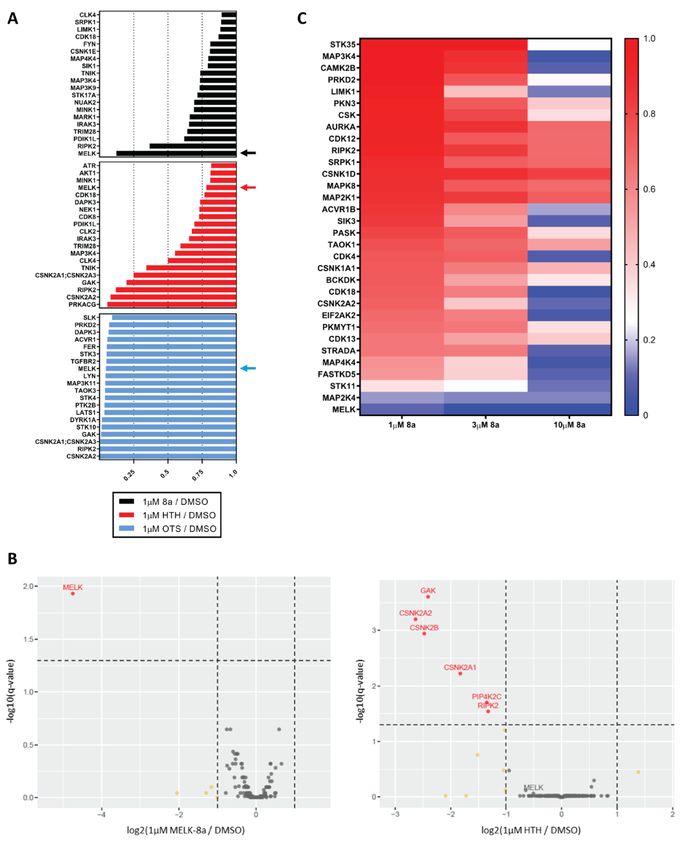
MELK inhibition causes delayed mitotic entry

proliferation, including multiple mitotic kinases          comprehensively define the selectivity of all
(42, 43). A number of studies have relied upon             clinical and FDA-approved kinase inhibitors,
OTS as a means to investigate the biological               validating the use of this approach for measuring
function of MELK; however, these results must be           inhibitor selectivity in cells (42). We used the
interpreted with caution due to the poor selectivity       competition MIB/MS approach to profile the
of this inhibitor. More recently, additional MELK          selectivity of 8a and HTH in an effort to identify a
inhibitors have been developed, including MELK-            highly selective MELK inhibitor suitable for
T1 (39), NVS-MELK8a (8a) (44), HTH-01-091                  functional studies.
(HTH) (15), IN17 (45), and others (8, 46). 8a and                   We first determined the kinase target
HTH in particular appear to have more favorable            landscape of OTS, HTH, and 8a at a single
selectivity profiles than OTS based upon kinase            concentration. MDA-MB-468 cells were selected
activity profiling assays (15, 44).                        for initial experiments, as many previous studies
         The key objectives of this study were to          utilized this and other TNBC cell lines. MDA-MB-
evaluate the selectivity profiles of three MELK            468 cells were treated with 1 μM of each putative
inhibitors, 8a, HTH, and OTS, using a cell-based           MELK inhibitor or DMSO for 30 minutes. Lysates
assay, in order to identify a highly selective             from DMSO- or inhibitor-treated cells were flowed
inhibitor to subsequently investigate MELK                 over columns packed with MIBs. Kinases bound to

                                                                                                                   Downloaded from http://www.jbc.org/ by guest on October 1, 2020
function. To this end, we utilized a chemical              MIBs in the absence or presence of inhibitors were
proteomics approach called multiplexed kinase              eluted and quantified by MS using label-free
inhibitor beads/mass spectrometry (MIB/MS) to              quantification in MaxQuant with integrated
characterize the selectivity of these MELK                 Andromeda search engine. The specificity of each
inhibitors in TNBC cells (47, 48). OTS was                 inhibitor was analyzed for a total of 235 protein
observed to be highly non-selective, in agreement          kinases quantified in this assay (Fig. S1).
with previous studies, and HTH did not effectively         Examining the 20 protein kinases detected in lowest
inhibit MELK in cells. In contrast, we found the           abundance after OTS, HTH, or 8a treatment of cells
inhibitor 8a to be highly selective for MELK,              (i.e. most prevented from binding to MIBs), relative
providing the first reliable alternative to OTS for        to DMSO treatment, revealed stark differences in
functional MELK studies. Using 8a as a tool                the selectivity and potency of these three
compound to probe the function of MELK, we                 compounds (Fig. 2A). As previously reported, OTS
observed that MELK inhibition perturbed cell cycle         exhibited broad specificity, with 52 protein kinases
progression by delaying entry into M, without an           including MELK captured by MIBs with at least 4-
induction of apoptosis. Collectively, our results          fold decreased abundance relative to DMSO (OTS
provide a rationale to utilize 8a for functional           / DMSO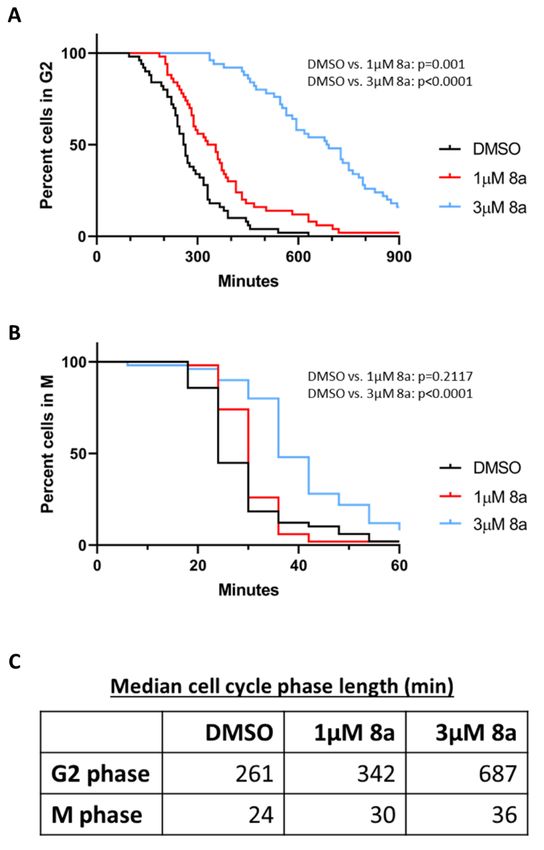
MELK inhibition causes delayed mitotic entry
MIB/MS. While STK11 and MAP2K4 appear to
Due to the striking specificity and potency exhibit decreased binding in a somewhat dose-
differences between 8a and HTH, we sought to dependent manner, it should be noted that neither
further validate these results in biological triplicate, exhibited significantly reduced binding with 1 μM
again at a single concentration of 1 μM. 8a treatment in biological triplicate (Fig. 2B). We
Subsequent competition MIB/MS results are further tested the binding affinity of 8a for these
displayed as volcano plots to assess both kinase kinases using the Eurofins DiscoverX
fold-change magnitude and significance (Fig. 2B). KINOMEscan™ assay, which quantitatively
With 8a treatment, MELK was the only kinase that measures the ability of an inhibitor to compete with
displayed statistically significant decreased binding a kinase ligand. 8a was found to have no detectable
to MIBs, confirming the high selectivity of this binding affinity for STK11 (Kd > 30 μM) or
compound. As observed previously (Fig. 2A), MAP2K4 (Kd = 17 μM) at 3 μM or lower, while
HTH treatment did not significantly decrease high affinity for MELK was observed (Kd = 14 nM)
MELK capture, whereas binding of GAK, (Fig. S4). Taken together, results from this cell-
CSNK2A2, CSNK2B, CSNK2A1, PIP4K2C, and based selectivity profiling assay indicate that
RIPK2 were significantly decreased. These results treatment of cells with 8a at 1 μM to 3 μM
further confirm that 8a is a highly selective MELK concentrations are sufficient for moderately strong
Downloaded from http://www.jbc.org/ by guest on October 1, 2020
inhibitor in cells, and underscore the importance of levels of inhibition to near-total inhibition of
determining compound selectivity in a cellular MELK, respectively, while maintaining high
context prior to biological studies. selectivity for this kinase.
Competition MIB/MS was next used to
profile the selectivity of 8a at 10, 100, and 1000 nM. Effects of MELK inhibition on TNBC cell viability
As expected, we observed a dose-dependent MELK has been reported to play a role in
decrease in MELK binding to MIBs, with no major TNBC proliferation and radioresistance (4, 6, 7). In
off-target inhibition over this concentration range TNBC and other cancers, RNAi-mediated
(Fig. S2). While high selectivity was maintained at depletion of this kinase impairs growth, an effect
1 μM 8a, we did not observe greater than 90% loss that can be reversed with exogenous MELK rescue,
of MELK binding to MIBs, suggesting incomplete indicating MELK may be an attractive therapeutic
inhibition. Since the percent inhibition of MELK target (4, 5, 7, 8, 12, 13). Recent results
required to elicit a phenotype is not well-defined, demonstrating that genetic knockout of MELK may
we tested higher concentrations of 8a (3 and 10 cause no growth phenotype have called into
μM), with the goal of assessing selectivity at question the approach of inhibiting this kinase as a
concentrations required for near-total inhibition of cancer monotherapy (14, 15). In light of these
binding to MIBs. Following MIB/MS, 221 protein disparate results, we sought to test whether
kinases were quantified by label-free quantification selective MELK inhibition with 8a impaired the
as above (Fig. S3), and the data were filtered to proliferation of two TNBC cell lines. Treatment of
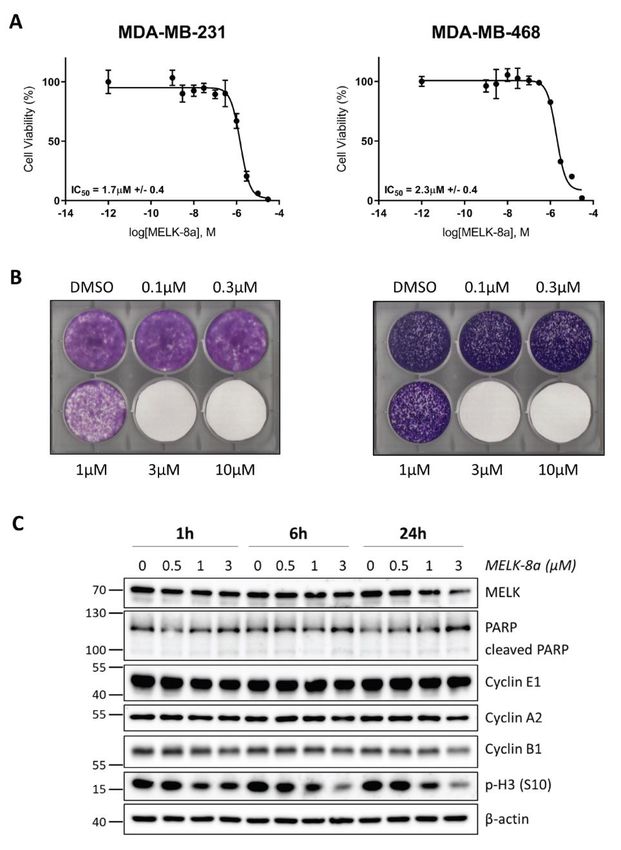
remove any protein kinases that did not exhibit MDA-MB-231 and MDA-MB-468 cells with 8a for
reduced binding at all three concentrations, in a 72 hours caused decreased cell viability, as
dose-dependent manner. The 32 protein kinases measured by resazurin assay, with an IC50 of 1.7
that met these criteria are displayed in a heat map μM +/- 0.4 and 2.3 μM +/- 0.4, respectively (Fig.
(Fig. 2C). At 1 μM, 8a was again observed to be 3A). We further measured the viability effects of
highly selective for MELK, with only MELK, 8a using long-term crystal violet cell staining
STK11, and MAP2K4 captured with 4-fold less assays. MDA-MB-231 and MDA-MB-468 cells
abundance, relative to DMSO. Notably, were treated with 8a for 8 or 14 days, respectively,
competition MIB/MS results indicated that MELK prior to staining with crystal violet. Similar IC50
was not detected at quantifiable levels following 3 values of between 1 and 3 μM were obtained for
μM 8a treatment, suggesting total loss of MELK both cell lines (Fig. 3B), in agreement with shorter-
binding to MIBs, while maintaining a high level of term resazurin assay results. Notably, this
selectivity at this concentration. At 10 μM, inhibition of cell viability was observed at the same
however, the specificity of 8a was decreased, with concentrations found to result in selective,
robust off-target kinase inhibition observed. moderately strong to near-total inhibition of MELK
4MELK inhibition causes delayed mitotic entry
(Fig. 2C). characterized response to cell cycle
We next examined whether reduced cell synchronization methods. We first confirmed that
viability was mediated through the induction of HeLaS3 cells exhibit similar sensitivity to 8a (IC50
apoptosis or perturbation of cell cycle progression. of 1.9 μM +/- 0.5) as TNBC cell lines (Fig. S6A).
MDA-MB-468 cells were treated with 0.5, 1, or 3 We further observed that 8a treatment caused the
μM 8a, or DMSO vehicle control, and cells were same dose-dependent decrease in p-H3 (S10), with
collected over a 24h time course. Samples were no effect on PARP cleavage or abundance of the
immunoblotted for PARP/cleaved PARP, cyclins measured cyclins, in HeLaS3 cells as in MDA-MB-
E1, A2, and B1, and p-Histone H3 (S10), to 468 cells (Fig. S6B). MELK expression levels were
measure effects on apoptosis and cell cycle found to be similar between HeLaS3, U2OS, and
distribution (Fig. 3C). PARP cleavage was not TNBC cell lines as well (Fig. S6C).
observed at any concentration or timepoint, To specifically examine effects on
indicating that 8a did not induce apoptosis. 8a progression through G2 and M, HeLaS3 cells were
treatment also had no effect on the abundance of the synchronized with double thymidine block and
measured cyclins, but there was a dose-dependent released into media containing DMSO, 1 μM, or 3
decrease in p-H3 (S10), a marker of M that is μM 8a, and harvested every 2h over a 12h time
induced in G2 and dephosphorylated upon mitotic course. Samples were immunoblotted for cell cycle
Downloaded from http://www.jbc.org/ by guest on October 1, 2020
exit. This decrease was observed as early as 1h markers to determine the effect of 8a treatment on
post-treatment and maintained through 24h. progression through S phase and into M (Fig. 4A).
Histone H3 is phosphorylated at Ser10 by No differences in cyclin E1 or A2 abundance were
Aurora B (50). To be certain that the observed observed after 8a treatment from 0h to 8h,
decrease in p-H3 (S10) was not due to direct indicating that S phase progression was unaffected
inhibition of the Aurora kinases, we utilized the by MELK inhibition. At 8h post-release, p-H3
Thermo Fisher SelectScreen kinase assay to test the (S10) abundance was lower in 3 μM 8a-treated cells
effects of 8a on Aurora A and B activity. relative to DMSO- and 1 μM 8a-treated cells.
Concentrations below 10 μM 8a did not inhibit Further, at 10h post-release, cyclins A2 and B1, and
Aurora A. The IC50 for inhibition of Aurora B was p-H3 (S10) abundances were greater with 3 μM 8a
24 μM, and only 10% and 21% inhibition was treatment, indicating that entry into and progression
observed with 1.2 and 3.7 μM 8a treatment, through M was delayed (Fig. 4B). At the 12h
respectively. The potency of 8a for the Aurora timepoint, cells appeared to have completed M,
kinases was 1000-fold lower than that observed for evident by major decreases in signal for cyclins E1,
MELK (IC50 = 17 nM) (Fig. S5), indicating that 8a A2, and B1, and p-H3 (S10). Cyclin E1 abundance
does not significantly inhibit Aurora A and B. It was decreased by 3 μM 8a at 12h, relative to other
should also be noted that these data were from a conditions, suggesting the effects of mitotic delay
cell-free enzymatic assay, so inhibition in cells is may persist after M. Treatment with 1 μM 8a had
likely to be considerably weaker at these little effect on cell cycle progression as measured
concentrations. In agreement with this, we did not using this thymidine synchronization technique.
observe substantial decreases in Aurora A or B Therefore, 3 μM 8a was used in subsequent
binding to MIBs with 3 μM 8a or lower (Figs. S1 synchronization experiments.
and S3). Collectively, these results show that To further investigate this apparent delay in
MELK inhibition with 8a caused decreased mitotic entry, we completed another double
viability through impaired cell cycle progression, thymidine synchronization experiment with more
specifically in G2/M phases. frequent collections around M (8-12h post-release).
Cells were not collected between 0h and 6h post-
MELK inhibition results in delayed mitotic entry release, as no differences were observed with 8a
mediated through delayed activation of Aurora A, over this timeframe in the previous experiment
Aurora B, and CDK1 (Fig. 4A). Additionally, we sought to investigate
Our results prompted further investigation the mechanism underlying this mitotic delay further
into the effects of MELK inhibition on cell cycle by expanding the number of cell cycle proteins that
progression. For subsequent experiments, HeLaS3 were measured by immunoblotting. Aurora A and
cells were used because of their robust and well- B have critical roles in mitotic entry and
5MELK inhibition causes delayed mitotic entry
progression, and their activity is regulated by of multiple kinases essential for this process,
autophosphorylation at T288 and T232, namely Aurora A and B, and CDK1.
respectively (51, 52). CDK1, regarded as the key
kinase for promoting M, is activated by cyclin MELK inhibition does not impair mitotic
binding and dephosphorylation of Y15 and T14. completion
These regulatory sites are phosphorylated by Wee1 After observing that MELK inhibition
and Myt1 in interphase, respectively, and are results in a delay in mitotic entry, we next asked
dephosphorylated by CDC25B (53). We whether it also had an effect on mitotic progression
immunoblotted for Aurora A and B and their and completion. Following the previously
regulatory phosphorylation sites, CDK1 and its described synchronization/release approach, cells
regulatory phosphorylation sites, Myt1, Wee1, were collected over a 20h time course and
CDC25B, and the cell cycle markers used immunoblotted for the same cell cycle markers
previously (Fig. 5). (Fig. 6). Again, degradation of cyclins A2 and B1,
With more frequent timepoints, the delay in and induction of p-H3 (S10) were delayed by 3 μM
onset of M caused by 3 μM 8a was even more 8a treatment, correlating with delayed activation of
apparent than in the previous experiment. This was Aurora A and B and CDK1. Despite this delay,
evident by delayed degradation of cyclins A2 and cells treated with 3 μM 8a appeared to progress
Downloaded from http://www.jbc.org/ by guest on October 1, 2020
B1, delayed accumulation of the mitotic marker p- through and complete M in a similar amount of
H3 (S10), delayed phosphorylation and activation time, once M began. This was evident by a return
of Aurora A and B, and delayed activation of CDK1 of p-H3 (S10) to steady-state levels at 14h,
by dephosphorylation of Y15 and T14. In control compared to 12h for DMSO, and
cells, cyclin A2 accumulation peaked at 7h post- dephosphorylation of Myt1, resulting in a faster
release and persisted through 8.5h, after which it migrating band relative to hyperphosphorylated
was rapidly degraded. In 3 μM 8a-treated cells, mitotic Myt1. MELK expression also decreased
cyclin A2 accumulated similarly, but expression rapidly immediately following completion of M, as
persisted through 11h. Cyclin B1 accumulation described in other studies (4, 35). HeLaS3 cells
was also unaffected by 8a, but its degradation upon treated with 3 μM 8a re-entered the subsequent cell
mitotic exit was delayed by approximately 3h, cycle, as observed by an induction of cyclin E1 at
beginning at 9h in control cells and 12h in 8a- 14h, compared to 12h for DMSO. Levels of this
treated cells. Consistent with this, p-H3 (S10) G1/S phase cyclin peak at ~16-18h with 3 μM 8a
accumulation began at 8h and decreased after 10h treatment, which is 2h later than control cells,
in control cells, compared to accumulation where cyclin E1 peaks at 14-16h. These results
beginning at 9h, peaking at 11h, and persisting at indicate that the length of M appears to be largely
high levels through 12h in 8a-treated cells. The unaffected by MELK inhibition, despite mitotic
activation of Aurora A and B by entry being delayed. These observations, along
autophosphorylation was also delayed, correlating with delayed activation of Aurora A and B and
precisely with p-H3 (S10) patterns. CDK1 CDK1 are consistent with activation of the G2/M
activation by dephosphorylation of Y15 and T14 checkpoint (54). Since M occurs quite rapidly (~30
began at 8.5h in control cells, compared to 11h in min), we sought to further examine these results
8a-treated cells, while CDK1 expression was using live-cell imaging for greater temporal
unaffected. Interestingly, the dynamics of Wee1 resolution.
expression appeared mostly unchanged between
control and 8a conditions, while inactivation of Live-cell imaging quantifies the mitotic entry
Myt1 by hyperphosphorylation (slower migrating delay caused by MELK inhibition
band on gel) mirrors the delayed dephosphorylation To more precisely measure the lengths of
pattern observed with CDK1 T14 and Y15. Finally, G2 and M phases in response to 8a treatment, we
the accumulation pattern of CDC25B may also be conducted live-cell imaging of U2OS osteosarcoma
unaffected by MELK inhibition, though peak levels cells stably expressing a fluorescent cell cycle
of CDC25B may be decreased relative to control. reporter based on PCNA localization (55). U2OS
These results indicate that MELK inhibition results cells are routinely used for cell cycle studies,
in delayed mitotic entry due to a delay in activation particularly with imaging methods, and our results
6MELK inhibition causes delayed mitotic entry
indicate that MELK expression is similar between being investigated is likely complex, rather than
U2OS and TNBC cells (Fig. S6C). This live-cell evidence that one set of results is incorrect in its
imaging approach employs tracking of individual entirety. It is quite possible that the total loss of
cells from an unperturbed, asynchronous protein expression and activity, via knockout, could
population. Fluorescent PCNA delineated the start have different effects than partial inhibition of
and end of S phase, while nuclear envelope activity with unperturbed expression, via
breakdown and cytokinesis delineated the start and pharmacological inhibition. Further, and because
end of M. Cells were treated with DMSO, 1 or 3 of the inherent differences between these
μM 8a, and G2 length was measured. We observed techniques, it is also possible that genomic
significant, dose-dependent G2 lengthening in cells knockout could result in cellular reprogramming of
treated with either 1 μM or 3 μM 8a, compared to signaling networks such that compensation for
DMSO-treated cells (Fig. 7A). In contrast to the growth defects occurs, whereas partial inhibition or
lower time resolution immunoblotting experiments depletion of the same enzyme may not result in the
with synchronized cells (Fig. 4), the increased same changes. As described in the introduction,
sensitivity of live-cell imaging revealed that G2 divergent phenotypes have been observed, but not
was indeed significantly lengthened by 1 μM 8a yet fully explained, between cyclin D-CDK4/6
treatment (~30% increase, 81 min). Following 3 knockout and inhibition, demonstrating that this
μM 8a treatment, median G2 length was markedly
Downloaded from http://www.jbc.org/ by guest on October 1, 2020
phenomenon is not constrained solely to MELK
increased (>250% increase, 426 min) compared to (19–21). At this point, these potential explanations
untreated cells (Fig 7C). are purely speculative, but this will undoubtedly be
Live-cell imaging was next used to an important area of investigation for future MELK
quantify the length of M phase. While no studies.
significant difference in time to complete M was This controversy has underscored the fact
observed between cells treated with DMSO and 1 that our understanding of the function of MELK in
μM 8a, 3 μM 8a caused detectable lengthening of cancer is still lacking. As a further complication,
M in two of three replicates (Figs. 7B and S7). This functional studies of MELK have long relied upon
increase in mitotic length from 24 minutes in OTS, an inhibitor with a remarkable lack of
control cells to 36 minutes in 3 μM 8a-treated cells selectivity, to complement results obtained using
was much smaller in magnitude than the observed knockdown and other techniques. While RNAi-
increase in G2 (Fig. 7C), which likely explains why mediated knockdown and genomic knockout
it was not detected using synchronization methods. approaches obviously have their merits, the use of
An increase in G2 length appears to be the a pharmacological inhibitor has distinct advantages
predominant phenotype resulting from MELK as well. First, pharmacological inhibition generally
inhibition. Taken together, our results indicate that allows for much tighter temporal control than other
selective MELK inhibition causes a delay in mitotic techniques, such that effects can be measured on a
entry that is consistent with transient G2 arrest. short timescale before significant changes in
signaling networks occur. Second, inhibition of
Discussion kinase activity often does not directly affect
Currently, one of the main questions in the expression of the inhibited kinase, which allows for
MELK field is how to rectify the seemingly differentiation between activity-dependent and -
disparate observations that RNAi-mediated MELK independent functions. Thus, a selective MELK
depletion and pharmacological inhibition cause a inhibitor would clearly be a valuable addition to the
strong growth defect in cancer cells (3–5, 9, 12, 28, toolkit available for studying the mechanistic
31, 37, 39, 44), whereas CRISPR/Cas9 knockout of underpinnings of this kinase in cancer.
MELK may have conditional or no effect on In an effort to identify a selective MELK
proliferation (14–18). It is vital to recognize that inhibitor, we used competition MIB/MS
genomic knockout techniques are not identical to technology to evaluate the selectivity profiles of
RNAi-mediated knockdown or inhibition, but OTS, HTH, and 8a. Our results (Fig. 2A) are in
rather that all are valuable orthogonal approaches. agreement with other studies in demonstrating that
Thus, divergent results should be interpreted as OTS is highly non-selective, and therefore is
evidence that the functional role of the protein unsuitable for mechanistic studies of MELK
7MELK inhibition causes delayed mitotic entry
biology (42, 43). In contrast to published enzyme overexpression of MELK may induce a G2/M
assay data demonstrating HTH to be a potent accumulation of cells as well (3, 38). Other studies
MELK inhibitor, we found that this inhibitor did have used more specific techniques to differentiate
not significantly affect MELK binding to MIBs between G2 and M phase effects. MELK
(Fig. 2, A and B) (15). This illustrates the disparate knockdown has been reported to impair mitotic
results that can be observed between enzyme- and progression by varied mechanisms, including by
cell-based selectivity profiling methods, decreasing activity and expression of the oncogenic
emphasizing the importance of evaluating mitotic transcription factor FoxM1 (28, 39), by
compound selectivity in a cellular context. Our regulating MCL1 synthesis in M (31), by inducing
results indicating that 8a exhibits high selectivity mitotic catastrophe (8), and by causing cytokinetic
for MELK (Fig. 2, A-C) are the first to characterize defects (4, 58, 59). A role for MELK in G2, distinct
an exquisitely selective MELK inhibitor in cells, from M, has been described as well. Davezac et al.
and thus rationalize the use of 8a for future observed that ectopic expression of MELK
functional studies. Since thoroughly validated (formerly known as pEg3) caused an accumulation
MELK substrates are lacking, one intriguing of cells in G2, which could be rescued by co-
possibility is to use MS to compare the expression of CDC25B. MELK was found to
phosphoproteome of cells treated with 8a to control directly interact with CDC25B in Xenopus, and
Downloaded from http://www.jbc.org/ by guest on October 1, 2020
cells, in an effort to identify novel MELK phosphorylate this phosphatase in vitro, leading the
substrates. Such studies could serve to establish a authors to hypothesize that MELK negatively
much-needed cellular readout for MELK activity, regulates the G2/M checkpoint through interaction
and to further elucidate the role of MELK in the cell with CDC25B (38).
cycle and cancer. To date, MELK As there is no clear consensus as to whether
phosphoproteomics studies have only been MELK plays a role in G2, M, or both, we used 8a,
completed using a mutant null allele of the MELK as an alternative to RNAi knockdown, to further
homolog in Caenorhabditis elegans (pig-1) (56), or investigate the cell cycle function of MELK. Time-
with OTS treatment (13). lapse microscopy experiments (Fig. 7) indicated
As previously described, 8a treatment that MELK inhibition caused a major, significant
caused decreased viability of TNBC cells (Fig. 3, A lengthening of G2 phase. Of note, we observed
and B) at concentration ranges that significantly many cells that delayed in G2 phase after exposure
prevented MELK binding to MIBs (Fig. 2C) (44). to 8a within that same cell cycle, suggesting that the
We did not observe an induction of apoptosis with G2 delay phenotype is proximal to MELK
8a (Fig. 3C), despite some others describing this inhibition. An additional minor delay in mitotic
effect as a result of MELK knockdown (4, 9, 17, progression was observed, warranting further
31). It is possible that the longest time point used investigation in light of previous studies indicating
in our study (24h) is not sufficient for induction of that MELK has mitotic functions. However, we
apoptosis with 8a, and that the observed cell cycle focused on the more predominant delay in mitotic
perturbation precedes apoptosis. Both pro-survival entry. Using thymidine synchronization techniques
and pro-apoptotic roles have been attributed to (Figs. 4-6), we observed that MELK inhibition
MELK, and the specific contexts that determine caused delayed mitotic entry, likely mediated
these opposing functions remain to be elucidated through delayed activation of CDK1, which was
(34). ultimately overcome to allow cells to complete M
While many studies describe a role for and begin the subsequent cell cycle. These
MELK in cell cycle progression, the precise details observations are consistent with a transient
of this role are not well understood. In response to activation of the G2/M checkpoint (54). Further
MELK silencing with RNAi, numerous studies studies are required to elucidate the underlying
have reported an accumulation of cells in G2/M mechanism, though it is possible to speculate based
phases (3, 17, 37, 44, 57). It should be noted that upon the work of others.
due to the methods used (quantification of cellular One potential explanation for the observed
DNA by flow cytometry) these particular studies G2 delay phenotype is that MELK positively
were not able to differentiate between an regulates CDC25B in G2, such that inhibition of
accumulation in G2 versus M. Paradoxically, MELK causes CDC25B to be unable to
8MELK inhibition causes delayed mitotic entry
dephosphorylate and activate CDK1, thereby
delaying mitotic entry. MELK phosphorylates Cell culture and viability assays
multiple sites on CDC25B to regulate both MDA-MB-468 and MDA-MB-231 cells
progression through the G2/M checkpoint, and were kindly provided by Dr. Gary Johnson (UNC).
CDC25B localization to centrosomes during M (38, These cell lines were cultured in RPMI 1640
60). Importantly, this putative interaction has never (Gibco) supplemented with 10% fetal bovine serum
been examined in the context of cancer. A possible (FBS, Millipore) and 1% antibiotic-antimycotic
interaction with CDC25C, which has a critical role (Sigma). HeLaS3 cells were kindly provided by Dr.
at the G2/M checkpoint and shares high sequence Michael Emanuele (UNC), and were cultured in
homology with CDC25B, has not been explored Dulbecco’s Modified Eagle Medium (DMEM),
either. Additional studies are needed to more high glucose (Gibco) supplemented with 10% FBS
clearly define the interaction between MELK and and 1% antibiotic-antimycotic.
the CDC25 phosphatases in cancer. An alternative Resazurin assays were completed as
hypothesis is that MELK inhibition causes DNA described previously (62). Briefly, MDA-MB-231
damage, which subsequently activates the G2/M (1500 cells/well), MDA-MB-468 (4000 cells/well),
checkpoint. A study by Beke et al. found that or HeLaS3 (1000 cells/well) cells were plated on a
MELK inhibition with MELK-T1 caused 96-well plate. After 24h, media was aspirated and
Downloaded from http://www.jbc.org/ by guest on October 1, 2020
replication stress in MCF-7 cells, manifesting in replaced with fresh media containing 8a at
replication fork stalling and DNA double strand concentrations ranging from 1 nM to 30 µM, or
breaks. This resulted in activation of the DMSO (negative control). Each treatment
ATM/Chk2 DNA damage repair pathway, which condition was tested in technical quadruplicate.
stimulates the G2/M checkpoint (39, 61). While Cells were incubated in media with 8a or DMSO
this pathway would certainly explain the putative for 72h prior to addition of resazurin dye (0.6 mM,
checkpoint activation, one would also expect strong Acros Organics 62758-13-8). After color change
ATM activation to lengthen S phase, which was not was observed (3h for MDA-MB-231, 2h for MDA-
observed in our study (Fig. 4). MB-468, 0.75h for HeLaS3), signaling that
In conclusion, we have validated 8a as a measurable reduction of resazurin to resorufin had
highly selective MELK inhibitor suitable for occurred, fluorescence intensity was measured
functional studies, and have shown that MELK using a PHERAstar (BMG Labtech) plate reader
inhibition causes a mitotic delay consistent with with fluorescence module (FI: 540-20, 590-20).
activation of the G2/M checkpoint. Dose-response curves were created and IC50 values
calculated using GraphPad Prism version 8.
Experimental procedures For crystal violet assays, MDA-MB-231
Antibodies and reagents and MDA-MB-468 cells were seeded at a density
MELK-8a hydrochloride was purchased of 5000 and 10000 cells per well, respectively, on
from MedChemExpress (HY-100368A). HTH-01- each well of a cell culture-treated 6-well plate
091 was a generous gift from Dr. Nathanael Gray (Corning). The following day, media was aspirated
(Harvard). The following primary antibodies were from all wells and replaced with media
used in this study. Aurora A (14475, 1:1000), supplemented with either DMSO or 0.1, 0.3, 1, 3,
Aurora B (3094, 1:1000), CDC25B (9525, 1:1000), or 10 µM 8a. Every 2 days throughout the course
cyclin A2 (4656, 1:2000), cyclin E1 (4129, 1:2500), of the assay, media was replaced on all wells with
MELK (2274, 1:1000), Myt1 (4282, 1:1000), fresh media containing 8a or DMSO. Cells were
PARP (9532, 1:1000), p-Aurora A/B/C (2914, observed daily using a bright-field microscope and
1:1000), p-CDK1 (T14) (2543, 1:1000), p-CDK1 confluency was noted. The assay was continued
(Y15) (4539, 1:1000), and p-Histone H3 (S10) until cells in the DMSO well were observed to be
(9701, 1:1000) were purchased from Cell Signaling near-confluent (~8d for MDA-MB-231, and ~14d
Technology. β-actin (SC47778, 1:500) was for MDA-MB-468). Media was then aspirated
purchased from Santa Cruz Biotechnology. CDK1 from all wells, and cells were washed gently with
(MAB8878, 1:2000) was purchased from ice-cold phosphate buffered saline (PBS, Gibco).
Millipore. Cyclin B1 (ab32053, 1:10000) was Next, 2 mL crystal violet stain (0.5% crystal violet
purchased from Abcam. (w/v) (Sigma), 20% methanol (Fisher)) was gently
9MELK inhibition causes delayed mitotic entry
added to each well and plates incubated for 10 was added to each lysate (42 units/sample) and
minutes at room temperature. Wells were samples were incubated on ice for 10 minutes.
subsequently washed three times with water, Lysates were clarified by centrifugation at 21000
allowed to dry, and plates were imaged with a rcf, 4°C for 15 minutes. Protein concentrations
Canon LiDE 110 document scanner. were normalized by Bradford assay (Bio-Rad), and
prepared for SDS-PAGE by addition of 4x
Double thymidine synchronization Laemmli sample buffer (250 mM Tris pH 6.8, 40%
HeLaS3 cells were seeded on 6 cm plates glycerol, 8% sodium dodecyl sulfate, 8% β-
and allowed to adhere overnight. During this and mercaptoethanol, 0.4% bromophenol blue).
all subsequent incubation steps, cells were Samples (10-30 µg) were applied to a 10% SDS-
maintained in a humidified chamber with 5% CO2 PAGE gel for separation of proteins, after which
at 37°C. DMEM was aspirated from all plates proteins were transferred to a PVDF membrane
(except for asynchronous control plates, which (Bio-Rad). Membranes were blocked for 1h with
were maintained in an incubator until the end of the 5% non-fat dry milk or 5% bovine serum albumin
assay) and replaced with media supplemented with (BSA, for phospho-specific antibodies) in TBS-T
2 mM thymidine (Sigma). 16h after thymidine (20 mM Tris pH 7.6, 137 mM NaCl, 0.05% Tween-
block, media was aspirated, plates were washed 20). Membranes were incubated in primary
Downloaded from http://www.jbc.org/ by guest on October 1, 2020
with warm PBS (1x) and warm DMEM (2x), and antibody dilutions (described above) in 5% BSA
fresh media was added for release from block. made in TBS-T, at 4°C with gentle shaking.
Plates were incubated for 9h, at which point media Following overnight incubation, membranes were
was aspirated and again replaced with DMEM washed with TBS-T three times and incubated for
supplemented with 2 mM thymidine and incubated 1h at room temperature with anti-mouse or -rabbit
for 16h. Media was aspirated and cells washed as IgG-HRP conjugated secondary antibody
above, and released from thymidine block into (Promega) dilutions in 5% milk in TBS-T.
DMEM supplemented with 8a or DMSO. 0h Membranes were again washed three times in TBS-
timepoints were collected at the time of release, and T, and bands imaged using a Chemi-Doc Touch
subsequent collections were completed at the Imaging System (Bio-Rad) after addition of Clarity
timepoints shown in figures. Cells were collected ECL reagent (Bio-Rad).
by scraping in media and cell suspension was
transferred to a 15 mL conical. Cells were pelleted MIB/MS selectivity profiling sample preparation
at 3000 rcf in a centrifuge with swinging bucket The selectivity of MELK inhibitors for
rotor, washed with cold PBS, and stored at -80°C. kinase targets was profiled using competition
After all timepoints were collected, cell pellets were MIB/MS. MDA-MB-468 cells were treated with
lysed and prepared for immunoblotting as described MELK inhibitor, at concentrations listed in figure
below. legends, or DMSO for 30 minutes. This timepoint
is sufficient for kinase engagement and inhibition
Immunoblotting by compound, but insufficient for major
HeLaS3 cells were plated in 6-well plates expression-level changes. Cells were then washed
and treated with DMSO or 0.5, 1, or 3 µM 8a for twice with ice-cold PBS before being scrape-
1h, 2h, 4h, 8h, 12h, or 24h. Cells were collected as harvested in PBS. Cell lysis, sample preparation,
described above for double thymidine and MIB kinase enrichment was completed as
synchronization protocol. Pellets from previously described (63), with the exception of the
asynchronous and synchronized experiments were composition of the kinase inhibitor mix used for
lysed by addition of RIPA buffer (20 mM Tris pH enrichment. To enrich for kinases in each sample,
7.4, 137 mM NaCl, 10% glycerol, 0.5% sodium a 350 µL volume of the following kinase inhibitors,
deoxycholate, 1% Nonidet P-40 substitute (Fluka), immobilized on beads, was applied to one Poly-
0.1% sodium dodecyl sulfate, 2 mM EDTA) Prep® chromatography column (Bio-Rad) per
supplemented with protease and phosphatase sample: CTx-0294885, PP58, Purvalanol B,
inhibitors (2 mM Na(VO3)4, 10 mM NaF, 0.0125 UNC2147A, VI-16832, UNC8088A.
µM calyculin A, and cOmplete EDTA-free
Protease Inhibitor Cocktail (Roche). Benzonase LC-MS/MS Analysis
10MELK inhibition causes delayed mitotic entry
Samples were analyzed by LC-MS/MS quantified in all three replicates in at least one
using a Thermo Easy nLC 1200 coupled to an condition within each analysis were removed.
Orbitrap Q Exactive HF mass spectrometer Missing LFQ values were then imputed by
equipped with an EasySpray nano source. Samples randomly sampling from a normal distribution with
were loaded onto an EasySpray C18 column (75 a mean of 1.8 standard deviations lower than the
µm ID X 25cm, 2 µm particle size) and eluted over mean in the original data, and a standard deviation
a 120 min method. The gradient for separation of 0.3 times the standard deviation in the original
consisted 5-40% B at a 250 nL/min flow rate, where data. Data were Log2 transformed and moderated
mobile phase A [water, 0.1% formic acid] and t-tests were computed using the Limma package
mobile phase B [80% acetonitrile, 0.1% formic (67). Briefly, a linear model predicting signal
acid]. The Q Exactive HF was operated in data- intensity given treatment condition was fit for each
dependent mode where the 15 most intense kinase, followed by t-statistics calculated by
precursors were selected for subsequent empirical Bayes moderation of standard errors
fragmentation. Resolution for the precursor scan towards the standard error estimated from all
(m/z 350–1700) was set to 120,000 with a target kinases. Multiple test correction was performed
value of 3 × 10⁶ ions, 100 ms max IT. MS/MS using the Benjamini-Hochberg method to control
scans resolution was set to 15,000 with a target for a 5% FDR (68). The mass spectrometry
Downloaded from http://www.jbc.org/ by guest on October 1, 2020
value of 1 × 10⁵ ions, 75 ms max IT. The proteomics data have been deposited to the
normalized collision energy was set to 27% for ProteomeXchange Consortium via the PRIDE (69)
HCD. Dynamic exclusion was set to 30 s and partner repository with the dataset identifier
precursors with unknown charge or a charge state PXD016022.
of 1 and ≥ 8 were excluded.
Live-cell imaging
MS data analysis U2OS cells were a gift from Dr. Michael
Data was processed using the MaxQuant Whitfield (Dartmouth College) and maintained in
software suite (version 1.6.1.0) (64, 65). The data DMEM (Sigma) supplemented with 10% FBS
were searched against a reviewed Uniprot human (Sigma), 1x penicillin-streptomycin, and 4 mM L-
database (downloaded in February 2018) glutamine and incubated at 5% CO2. Cells were
containing 20,245 sequences. Precursor mass transduced with fluorescent PCNA (pLenti-Hyg-
tolerance was set to 4.5 ppm and fragment mass turq2-PCNA) and histone H2B (pBabe-Puro-mCh-
tolerance was set to 20 ppm. A maximum of two H2B) using standard techniques, as described
missed tryptic cleavages were allowed. The fixed previously (55). One day prior to imaging, cells
modification specified was carbamidomethylation were plated on #1.5 glass-bottom plates (Cellvis) in
of cysteine residues. The variable modification FluoroBrite DMEM (Gibco) supplemented with
specified was oxidation of methionine. A default FBS, penicillin-streptomycin, and L-glutamine, as
protein false discovery rate (FDR) of 1% was used above. Imaging was performed on a Nikon Ti
to filter all data within MaxQuant. Proteins were Eclipse inverted microscope using a 40x (NA 0.95)
quantified across all samples using MaxLFQ (66). Plan Apochromat dry objective lens and the Nikon
Matching between runs was allowed with the Perfect Focus System. Still images were captured
default retention time window. Kinases were using an Andor Zyla 4.2 sCMOS detector with 12-
parsed from the dataset and those with >1 unique bit resolution. During imaging cells were
peptide were quantified using label-free maintained in a humidified chamber with 5% CO2
quantification (LFQ). Kinases with >50% missing at 37°C. Filter sets were CFP - 436/20 nm; 455 nm;
values were removed and LFQ intensities for the 480/40 nm (excitation; beam splitter; emission
missing values were imputed using a constant value filter) and mCherry - 560/40 nm; 585 nm; 630/75
(average lower 10% of all LFQ intensities). The nm (Chroma). Images were obtained every 6
ratio of the LFQ intensity for each kinase in MELK minutes using NIS-Elements AR software. No
inhibitor conditions to that kinase in DMSO control photobleaching or phototoxicity was observed in
was computed. GraphPad Prism version 8 was used cells imaged with this protocol.
to generate bar plots and heat maps. For data used 8a or DMSO (negative control) was added
to generate volcano plots, kinases that were not 24 hours after the beginning of the imaging run as
11MELK inhibition causes delayed mitotic entry
described in the figure legends. Cells were Three individual biological replicates were imaged
manually tracked and scored. The onset and end of with 50 cells counted per condition per replicate.
S phase were determined visually using the DNA Cells that traveled out of the field of view or did not
replication associated patterns of PCNA complete a cell cycle (S phase to cytokinesis) were
localization in the nucleus. Mitosis length was excluded from the analysis.
defined visually by the length of time between
nuclear envelope breakdown and cytokinesis.
Downloaded from http://www.jbc.org/ by guest on October 1, 2020
12MELK inhibition causes delayed mitotic entry
Acknowledgments: We would like to thank Thomas Bonacci for sharing protocols and reagents with us,
as well as Emily Fennell and Lucas Aponte-Collazo for assistance with experimental troubleshooting. We
would also like to thank Dr. Nathanael Gray for the generous gift of the compound HTH-01-091.
Data availability: The mass spectrometry proteomics data have been deposited to the ProteomeXchange
Consortium via the PRIDE (69) partner repository with the dataset identifier PXD016022.
Conflict of interest: The authors declare that they have no conflicts of interest with the contents of this
article. The content is solely the responsibility of the authors and does not necessarily represent the official
views of the National Institutes of Health.
Downloaded from http://www.jbc.org/ by guest on October 1, 2020
13MELK inhibition causes delayed mitotic entry
References
1. Heyer, B. S., Warsowe, J., Solter, D., Knowles, B. B., and Ackerman, S. L. (1997) New member
of the Snf1/AMPK kinase family, Melk, is expressed in the mouse egg and preimplantation
embryo. Mol. Reprod. Dev. 47, 148–156
2. Ganguly, R., Mohyeldin, A., Thiel, J., Kornblum, H. I., Beullens, M., and Nakano, I. (2015)
MELK-a conserved kinase: Functions, signaling, cancer, and controversy. Clin. Transl. Med.
10.1186/s40169-014-0045-y
3. Gray, D., Jubb, A. M., Hogue, D., Dowd, P., Kljavin, N., Yi, S., Bai, W., Frantz, G., Zhang, Z.,
Koeppen, H., de Sauvage, F. J., and Davis, D. P. (2005) Maternal Embryonic Leucine Zipper
Kinase/Murine Protein Serine-Threonine Kinase 38 Is a Promising Therapeutic Target for
Multiple Cancers. Cancer Res. 65, 9751–61
4. Wang, Y., Lee, Y.-M., Baitsch, L., Huang, A., Xiang, Y., Tong, H., Lako, A., Von, T., Choi, C.,
Lim, E., Min, J., Li, L., Stegmeier, F., Schlegel, R., Eck, M. J., Gray, N. S., Mitchison, T. J., and
Zhao, J. J. (2014) MELK is an oncogenic kinase essential for mitotic progression in basal-like
breast cancer cells. Elife. 3, e01763
5. Nakano, I., Masterman-Smith, M., Saigusa, K., Paucar, A. A., Horvath, S., Shoemaker, L.,
Watanabe, M., Negro, A., Bajpai, R., Howes, A., Lelievre, V., Waschek, J. A., Lazareff, J. A.,
Downloaded from http://www.jbc.org/ by guest on October 1, 2020
Freije, W. A., Liau, L. M., Gilbertson, R. J., Cloughesy, T. F., Geschwind, D. H., Nelson, S. F.,
Mischel, P. S., Terskikh, A. V, and Kornblum, H. I. (2008) Maternal embryonic leucine zipper
kinase is a key regulator of the proliferation of malignant brain tumors, including brain tumor stem
cells. J. Neurosci. Res. 86, 48–60
6. Pickard, M. R., Green, A. R., Ellis, I. O., Caldas, C., Hedge, V. L., Mourtada-Maarabouni, M., and
Williams, G. T. (2009) Dysregulated expression of Fau and MELK is associated with poor
prognosis in breast cancer. Breast Cancer Res. 10.1186/bcr2350
7. Speers, C., Zhao, S. G., Kothari, V., Santola, A., Liu, M., Wilder-Romans, K., Evans, J., Batra, N.,
Bartelink, H., Hayes, D. F., Lawrence, T. S., Brown, P. H., Pierce, L. J., and Feng, F. Y. (2016)
Maternal embryonic leucine zipper kinase (MELK) as a novel mediator and biomarker of
radioresistance in human breast cancer. Clin Cancer Res. 22, 5864–75
8. Minata, M., Gu, C., Joshi, K., Nakano-Okuno, M., Hong, C., Nguyen, C.-H., Kornblum, H. I.,
Molla, A., and Nakano, I. (2014) Multi-kinase inhibitor C1 triggers mitotic catastrophe of glioma
stem cells mainly through MELK kinase inhibition. PLoS One. 9, e92546
9. Xia, H., Kong, S. N., Chen, J., Shi, M., Sekar, K., Seshachalam, V. P., Rajasekaran, M., Goh, B.
K. P., Ooi, L. L., and Hui, K. M. (2016) MELK is an oncogenic kinase essential for early
hepatocellular carcinoma recurrence. Cancer Lett. 383, 85–93
10. Guan, S., Lu, J., Zhao, Y., Yu, Y., Li, H., Chen, Z., Shi, Z., Liang, H., Wang, M., Guo, K., Chen,
X., Sun, W., Bieerkehazhi, S., Xu, X., Sun, S., Agarwal, S., Yang, J., Guan, S., Lu, J., Zhao, Y.,
Yu, Y., Li, H., Chen, Z., Shi, Z., Liang, H., Wang, M., Guo, K., Chen, X., Sun, W., Bieerkehazhi,
S., Xu, X., Sun, S., Agarwal, S., and Yang, J. (2018) MELK is a novel therapeutic target in high-
risk neuroblastoma. Oncotarget. 9, 2591–2602
11. Alachkar, H., Mutonga, M. B., Metzeler, K. H., Fulton, N., Malnassy, G., Herold, T.,
Spiekermann, K., Bohlander, S. K., Hiddemann, W., Matsuo, Y., Stock, W., and Nakamura, Y.
(2014) Preclinical efficacy of maternal embryonic leucine-zipper kinase (MELK) inhibition in
acute myeloid leukemia. Oncotarget. 5, 12371–12382
12. Hebbard, L. W., Maurer, J., Miller, A., Lesperance, J., Hassell, J., Oshima, R. G., and Terskikh, A.
V. (2010) Maternal embryonic leucine zipper kinase is upregulated and required in mammary
tumor-initiating cells in vivo. Cancer Res. 70, 8863–8873
13. Janostiak, R., Rauniyar, N., Lam, T. K. T., Ou, J., Zhu, L. J., Green, M. R., and Wajapeyee, N.
(2017) MELK Promotes Melanoma Growth by Stimulating the NF-κB Pathway. Cell Rep. 21,
2829–2841
14. Lin, A., Giuliano, C. J., Sayles, N. M., and Sheltzer, J. M. (2017) CRISPR/Cas9 mutagenesis
invalidates a putative cancer dependency targeted in on-going clinical trials. Elife. 6, e24179
14MELK inhibition causes delayed mitotic entry
15. Huang, H.-T., Seo, H.-S., Zhang, T., Wang, Y., Jiang, B., Li, Q., Buckley, D. L., Nabet, B.,
Roberts, J. M., Paulk, J., Dastjerdi, S., Winter, G. E., McLauchlan, H., Moran, J., Bradner, J. E.,
Eck, M. J., Dhe-Paganon, S., Zhao, J. J., and Gray, N. S. (2017) MELK is not necessary for the
proliferation of basal-like breast cancer cells. Elife. 6, e26693
16. Giuliano, C. J., Lin, A., Smith, J. C., Palladino, A. C., and Sheltzer, J. M. (2018) MELK
expression correlates with tumor mitotic activity but is not required for cancer growth. Elife. 7,
e32838
17. Zhang, Y., Zhou, X., Li, Y., Xu, Y., Lu, K., Li, P., and Wang, X. (2018) Inhibition of maternal
embryonic leucine zipper kinase with OTSSP167 displays potent anti-leukemic effects in chronic
lymphocytic leukemia. Oncogene. 37, 5520–5533
18. Wang, Y., Li, B. B., Li, J., Roberts, T. M., and Zhao, J. J. (2018) A conditional dependency on
MELK for the proliferation of triple-negative breast cancer cells. iScience. 9, 149–160
19. Malumbres, M., Sotillo, R., Santamaría, D., Galán, J., Cerezo, A., Ortega, S., Dubus, P., and
Barbacid, M. (2004) Mammalian cells cycle without the D-type cyclin-dependent kinases Cdk4
and Cdk6. Cell. 118, 493–504
20. Malumbres, M., and Barbacid, M. (2009) Cell cycle, CDKs and cancer: A changing paradigm.
Nat. Rev. Cancer. 9, 153–166
Downloaded from http://www.jbc.org/ by guest on October 1, 2020
21. Choi, Y. J., Li, X., Hydbring, P., Sanda, T., Stefano, J., Christie, A. L., Signoretti, S., Look, A. T.,
Kung, A. L., von Boehmer, H., and Sicinski, P. (2012) The requirement for cyclin D function in
tumor maintenance. Cancer Cell. 22, 438–451
22. Otto, T., and Sicinski, P. (2017) Cell cycle proteins as promising targets in cancer therapy. Nat.
Rev. Cancer. 17, 93–115
23. Currie, C. E., Mora-Santos, M., Smith, C. A., McAinsh, A. D., and Millar, J. B. A. (2018) Bub1 is
not essential for the checkpoint response to unattached kinetochores in diploid human cells. Curr.
Biol. 28, R929–R930
24. Raaijmakers, J. A., van Heesbeen, R. G. H. P., Blomen, V. A., Janssen, L. M. E., van Diemen, F.,
Brummelkamp, T. R., and Medema, R. H. (2018) BUB1 is essential for the viability of human
cells in which the spindle assembly checkpoint is compromised. Cell Rep. 22, 1424–1438
25. Rodriguez-Rodriguez, J. A., Lewis, C., McKinley, K. L., Sikirzhytski, V., Corona, J.,
Maciejowski, J., Khodjakov, A., Cheeseman, I. M., and Jallepalli, P. V. (2018) Distinct Roles of
RZZ and Bub1-KNL1 in Mitotic Checkpoint Signaling and Kinetochore Expansion. Curr. Biol.
28, 3422-3429.e5
26. Zhang, G., Kruse, T., Guasch Boldú, C., Garvanska, D. H., Coscia, F., Mann, M., Barisic, M., and
Nilsson, J. (2019) Efficient mitotic checkpoint signaling depends on integrated activities of Bub1
and the RZZ complex. EMBO J. 38, 1–18
27. Meraldi, P. (2019) Bub1 - the zombie protein that CRISPR cannot kill. EMBO J. 38, 1–2
28. Joshi, K., Banasavadi-Siddegowda, Y., Mo, X., Kim, S. H., Mao, P., Kig, C., Nardini, D., Sobol,
R. W., Chow, L. M. L., Kornblum, H. I., Waclaw, R., Beullens, M., and Nakano, I. (2013) MELK-
dependent FOXM1 phosphorylation is essential for proliferation of glioma stem cells. Stem Cells.
31, 1051–1063
29. Nakano, I., Paucar, A. A., Bajpai, R., Dougherty, J. D., Zewail, A., Kelly, T. K., Kim, K. J., Ou, J.,
Groszer, M., Imura, T., Freije, W. A., Nelson, S. F., Sofroniew, M. V., Wu, H., Liu, X., Terskikh,
A. V., Geschwind, D. H., and Kornblum, H. I. (2005) Maternal embryonic leucine zipper kinase
(MELK) regulates multipotent neural progenitor proliferation. J. Cell Biol. 170, 413–427
30. Gu, C., Banasavadi-Siddegowda, Y. K., Joshi, K., Nakamura, Y., Kurt, H., Gupta, S., and Nakano,
I. (2013) Tumor-specific activation of the C-JUN/MELK pathway regulates glioma stem cell
growth in a p53-dependent manner. Stem Cells. 31, 870–881
31. Wang, Y., Begley, M., Li, Q., Huang, H.-T., Lako, A., Eck, M. J., Gray, N. S., Mitchison, T. J.,
Cantley, L. C., and Zhao, J. J. (2016) Mitotic MELK-eIF4B signaling controls protein synthesis
and tumor cell survival. Proc. Natl. Acad. Sci. 113, 9810–9815
32. Lin, M.-L., Park, J.-H., Nishidate, T., Nakamura, Y., and Katagiri, T. (2007) Involvement of
15You can also read